A person voting in an election

Voter demographics of every state

Written by:
October 26, 2022
Canva

Voter demographics of every state

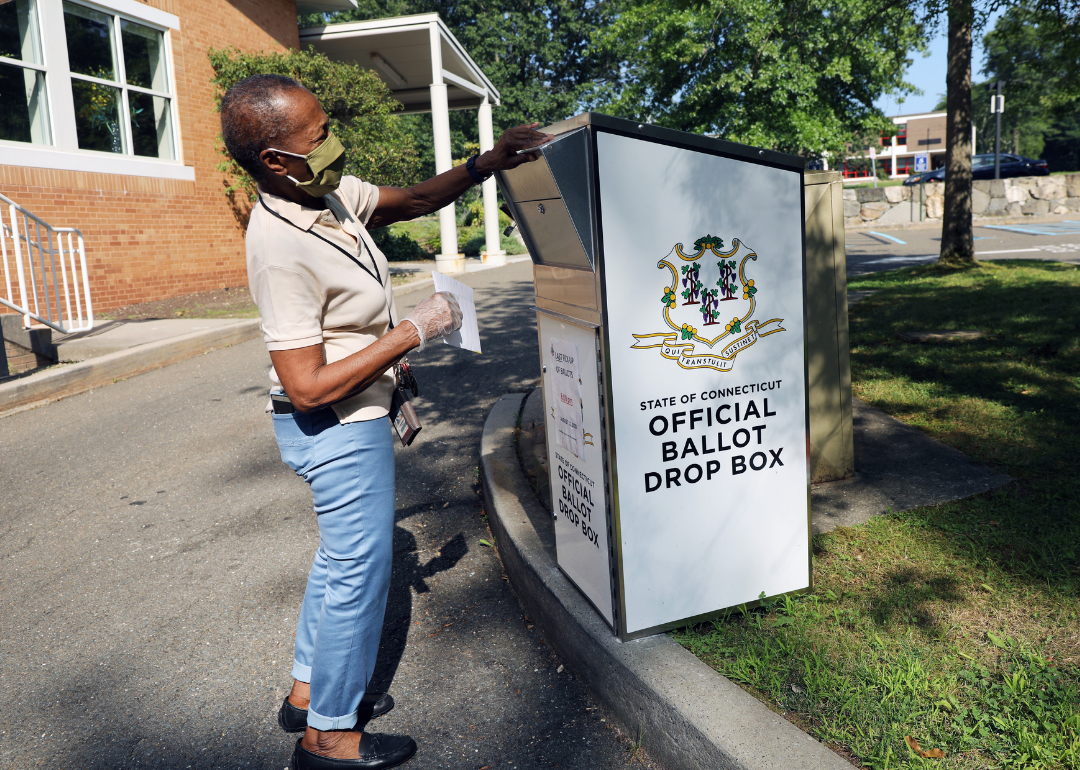
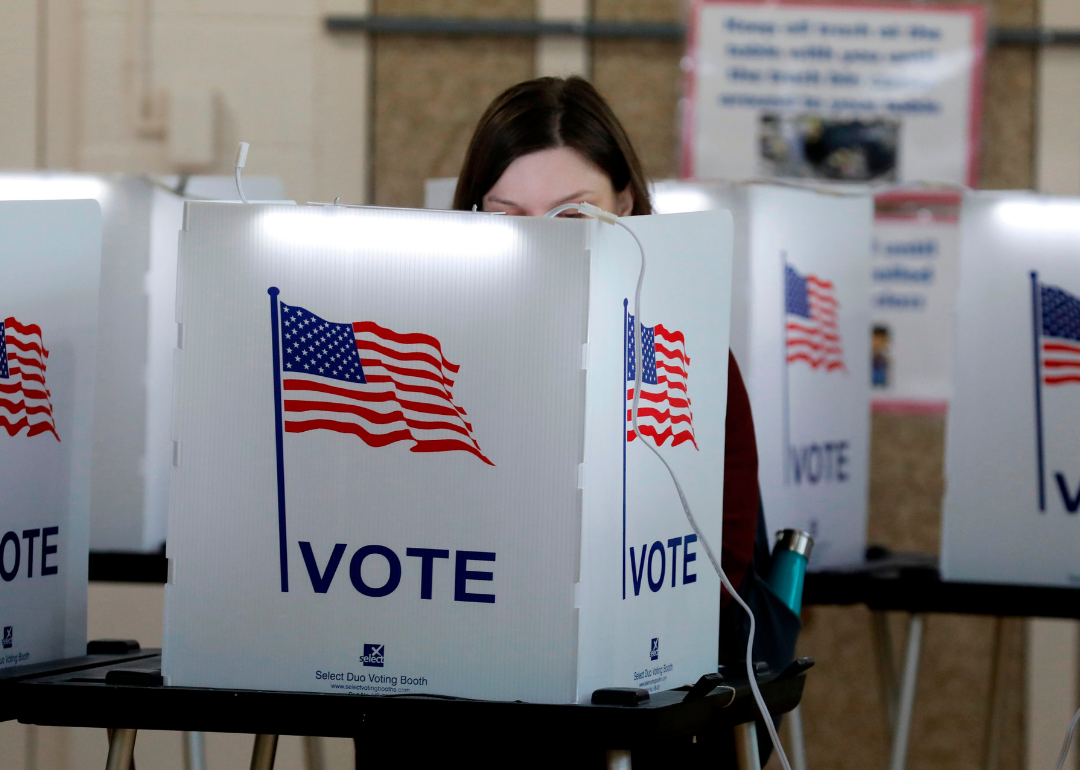
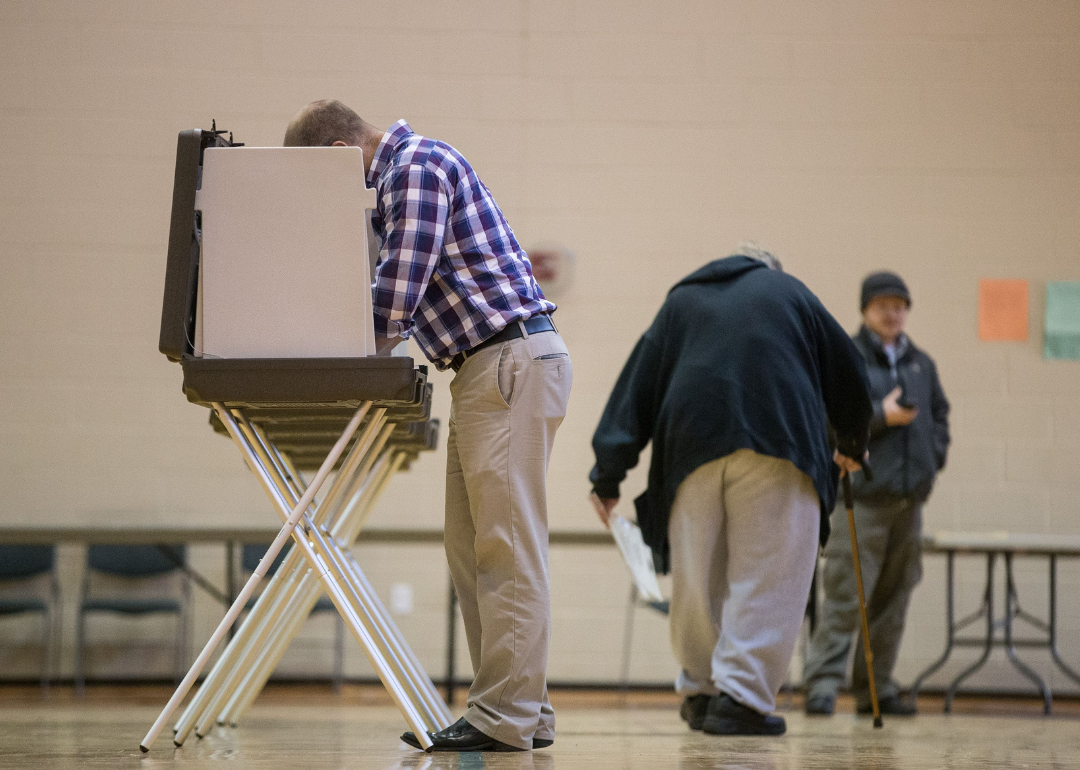
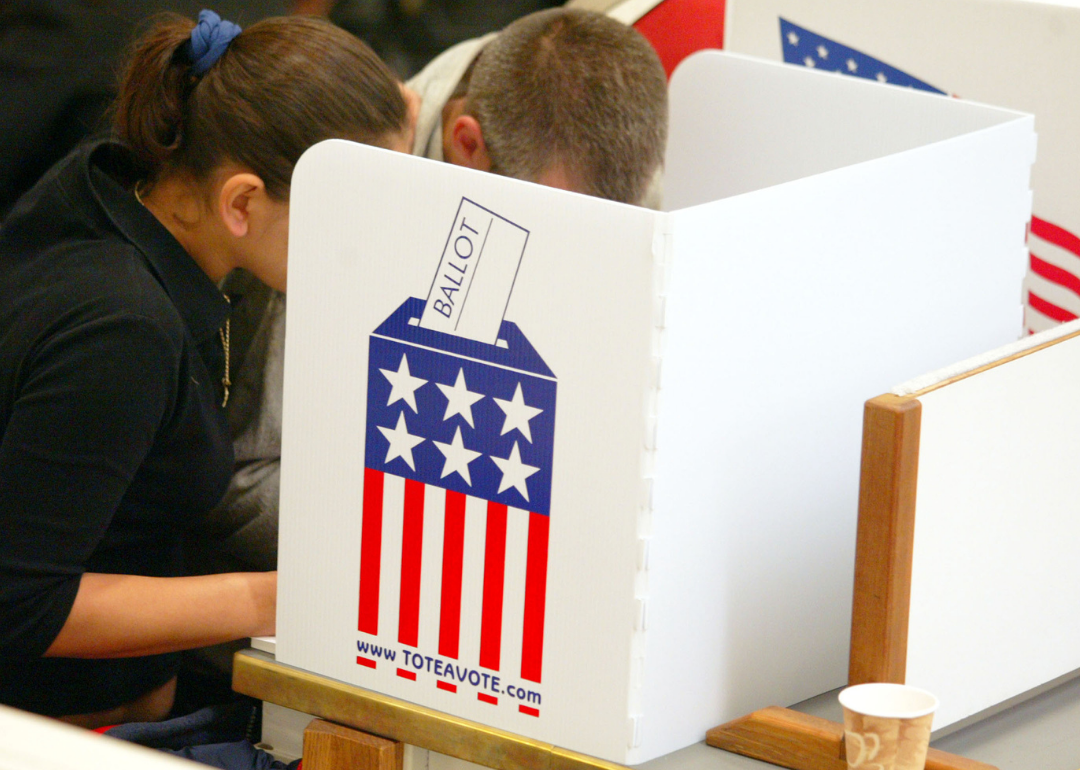
Midterm elections have the power to reshape the U.S. Congress, set the stage for future presidential elections, and alter the direction of the country at large. In 2020, more than two-thirds of estimated eligible voters in the U.S. voted in the presidential election, the largest voter turnout of the 21st century, according to the U.S. Census Bureau.

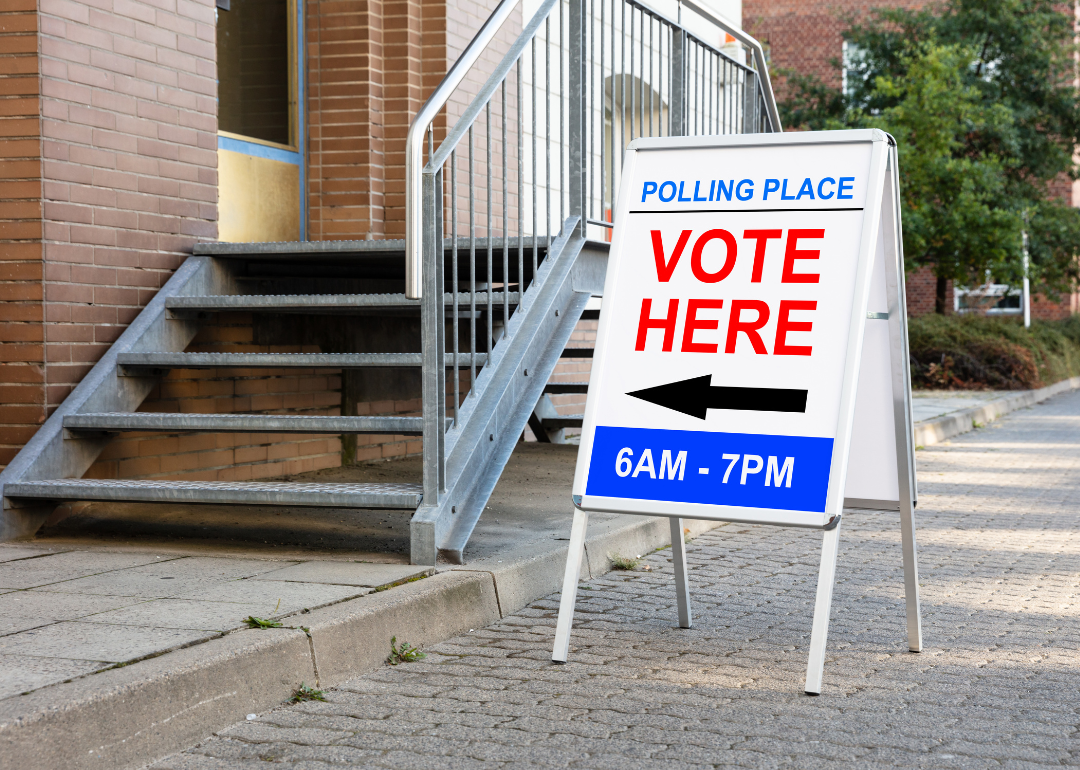
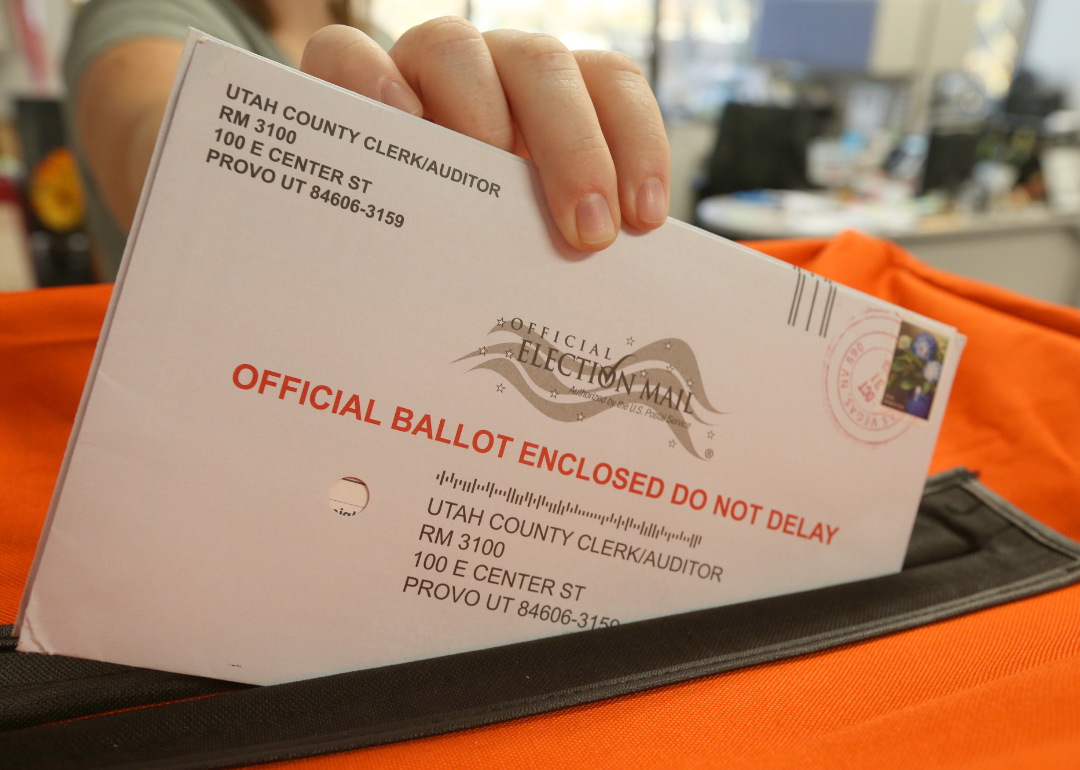
Polling and research experts predict that on midterm election day, Nov. 8, 2022, a new record number of American voters will head to the polls, incentivized by the particularly polarizing politics of the last two years. Inflation, abortion rights, health care, immigration, and the controversies surrounding Donald Trump since he was voted out of office—including the Jan. 6 hearings—are primary concerns that will drive voters to the polls, according to an NPR/PBS NewsHour/Marist National Poll.

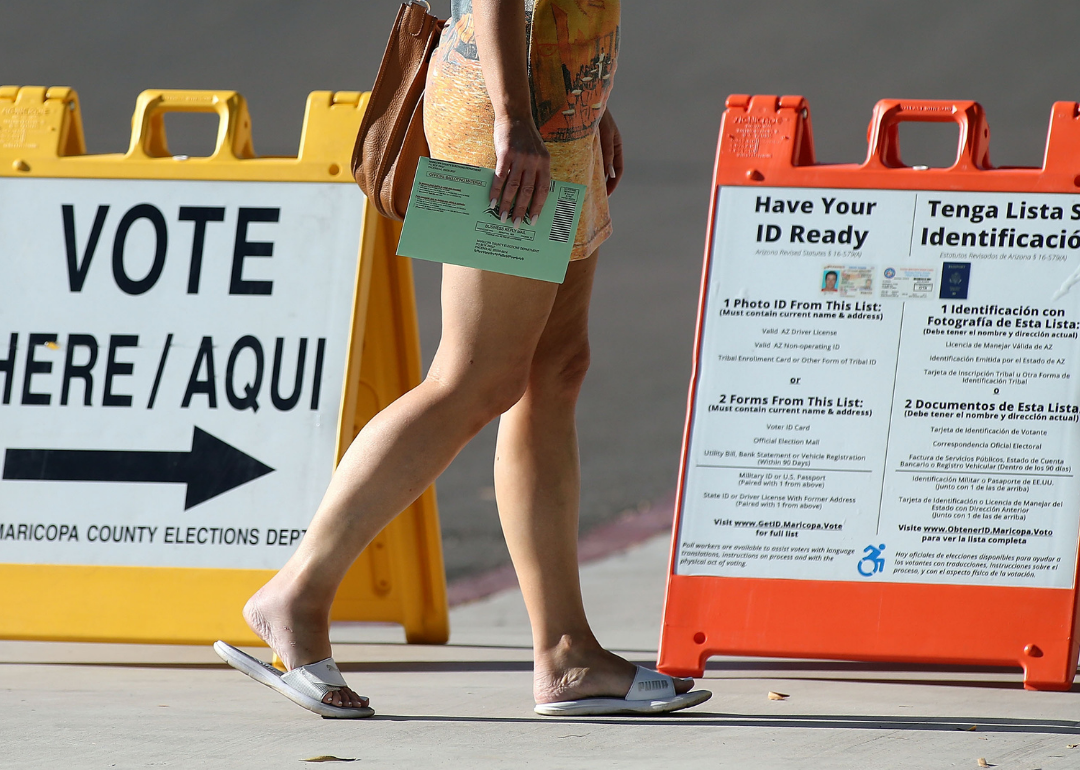
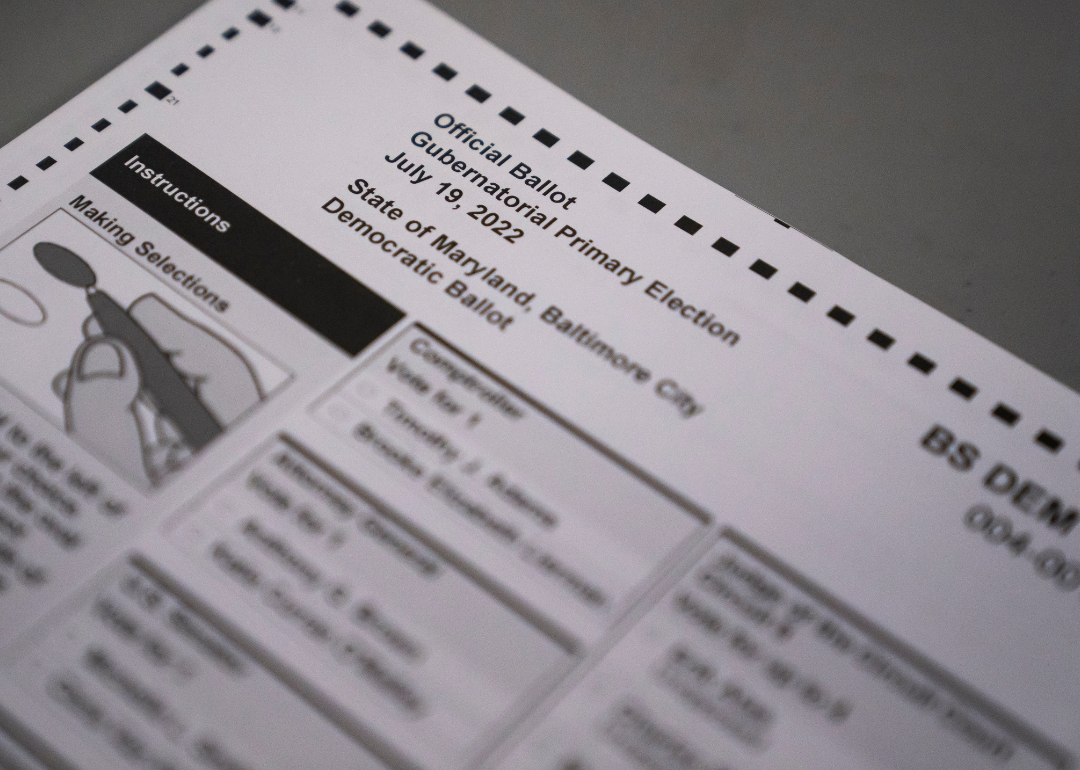
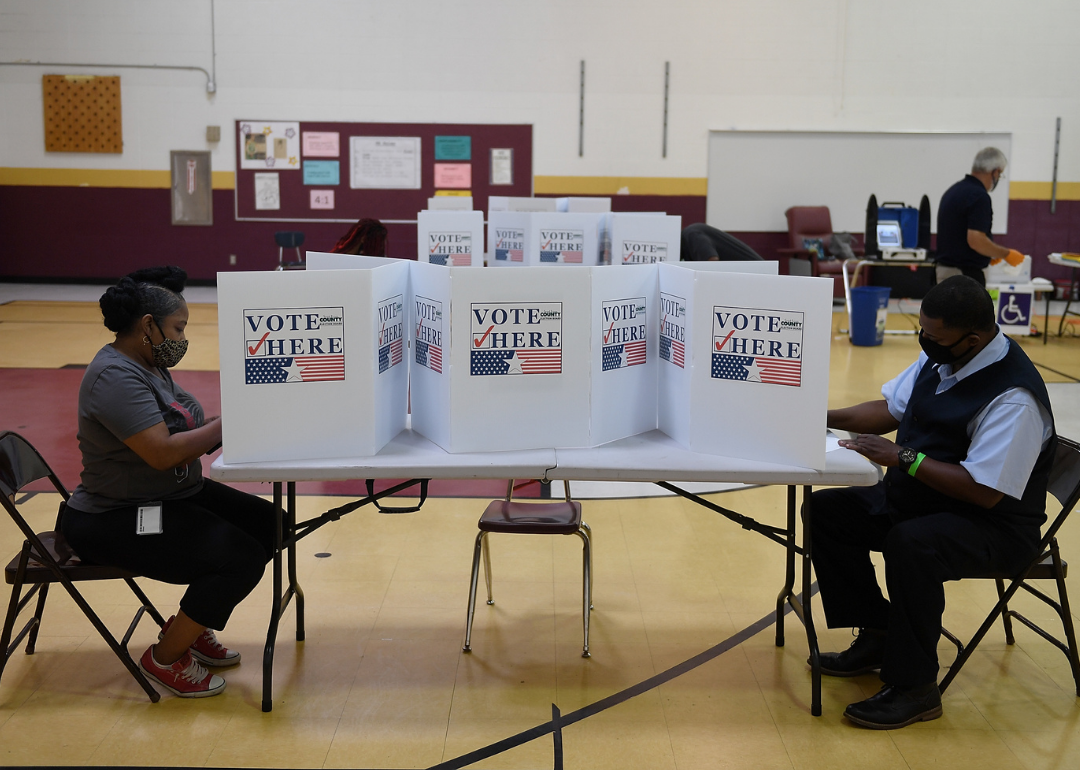
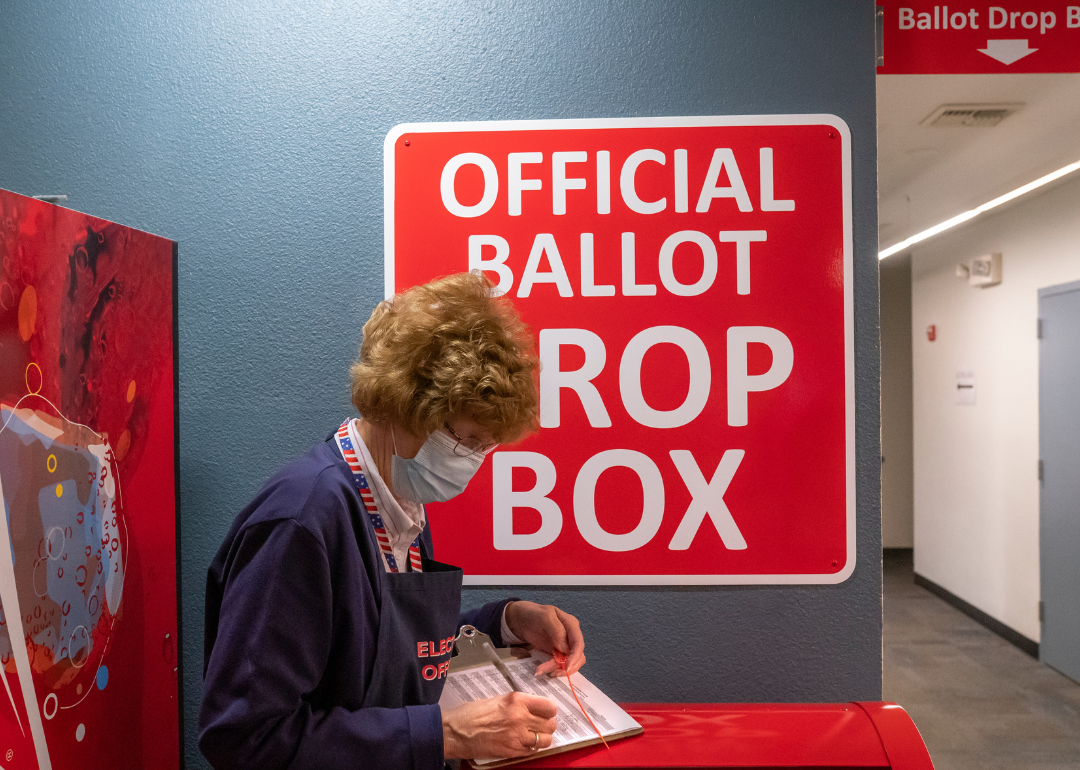
Stacker compiled voter demographics for each state and Washington D.C. using the 2021 U.S. Census Bureau's American Community Survey (released in September 2022) to better understand how the electorate may vote on these issues. Each slide shows the state's voting-age population (citizens who are 18 or older) and the breakdown of that population by sex, age, race, and education level. In order to avoid making any assumptions about the data or the participants of the American Community Survey, Stacker used the exact wording of the "race" and "sex" framework that was provided in the census data.

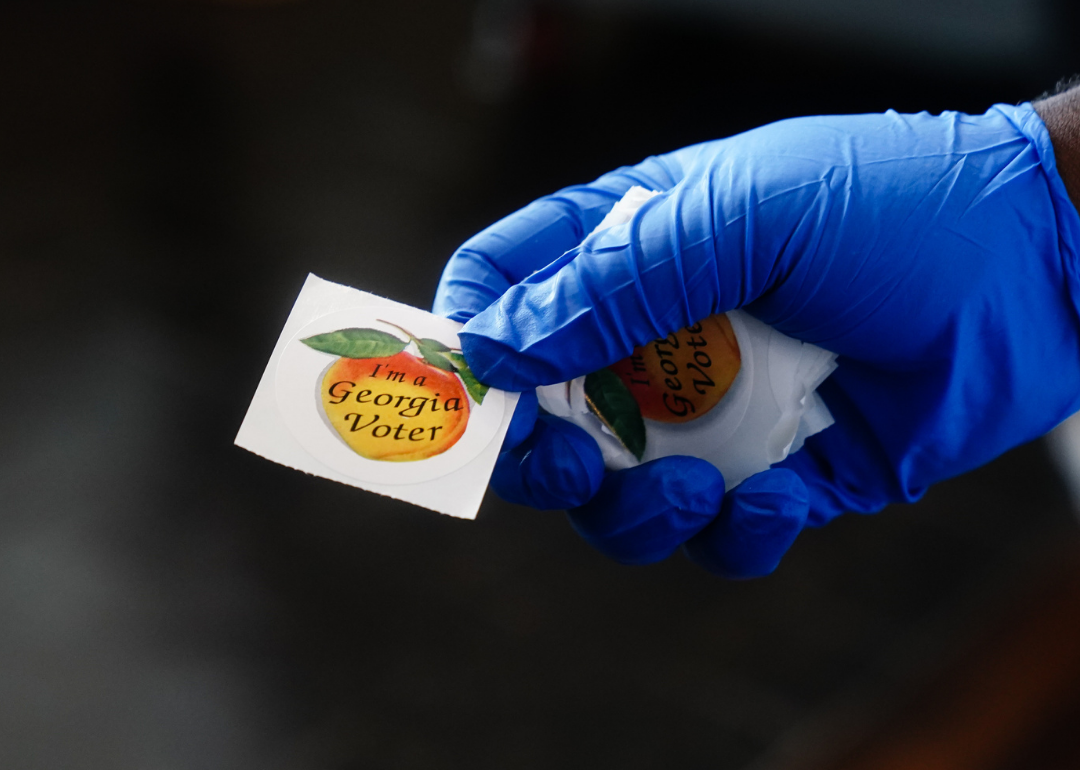
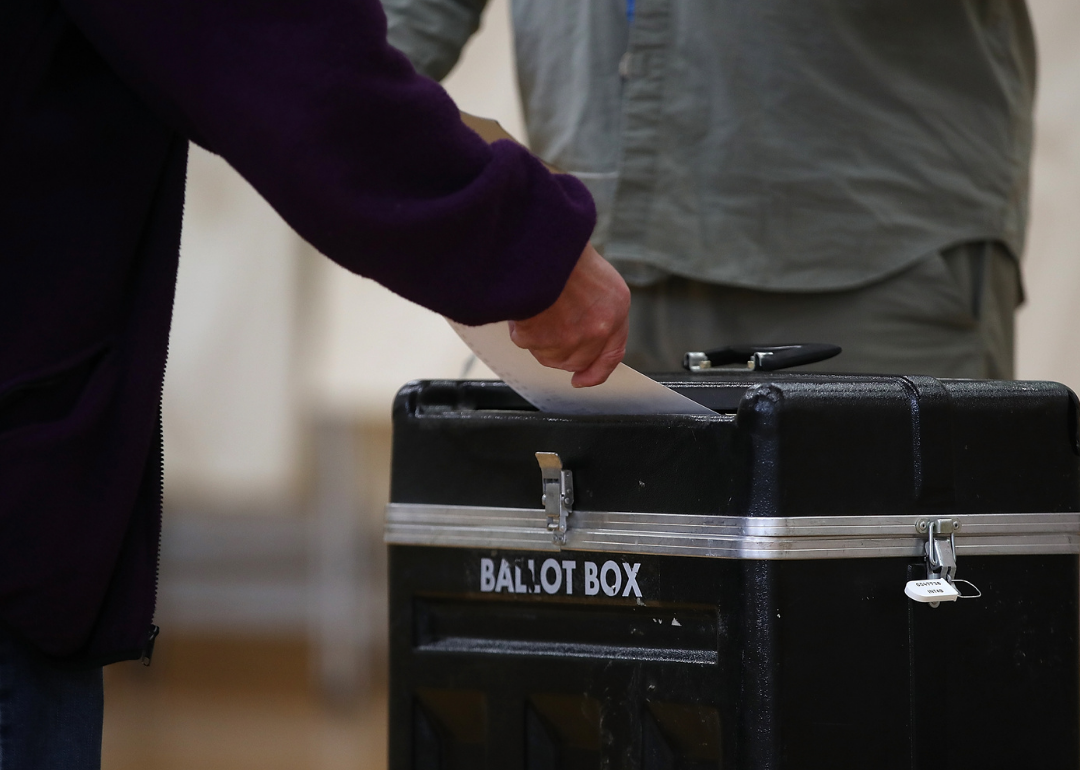
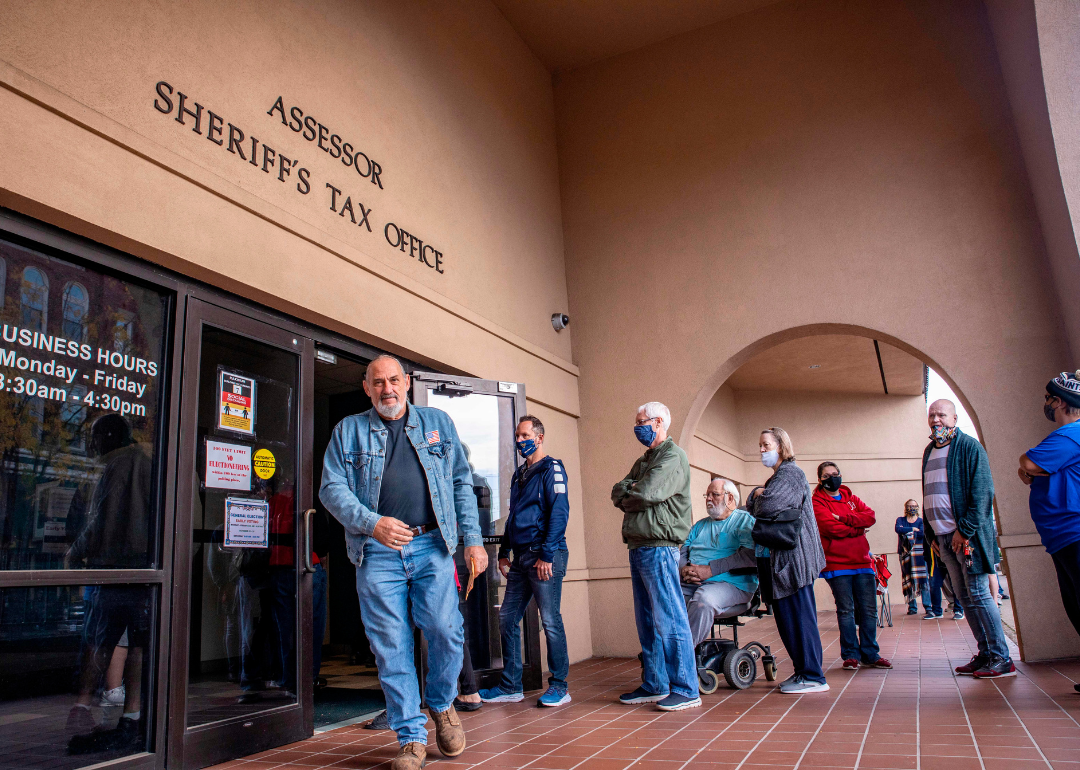
Eyes will be fixed on key races for congressional control across the country, including in Georgia, where Black Americans make up one-third of all eligible voters statewide and are more likely than any other segment of the population to vote Democrat. Roughly half of all eligible Black voters live in eight states.

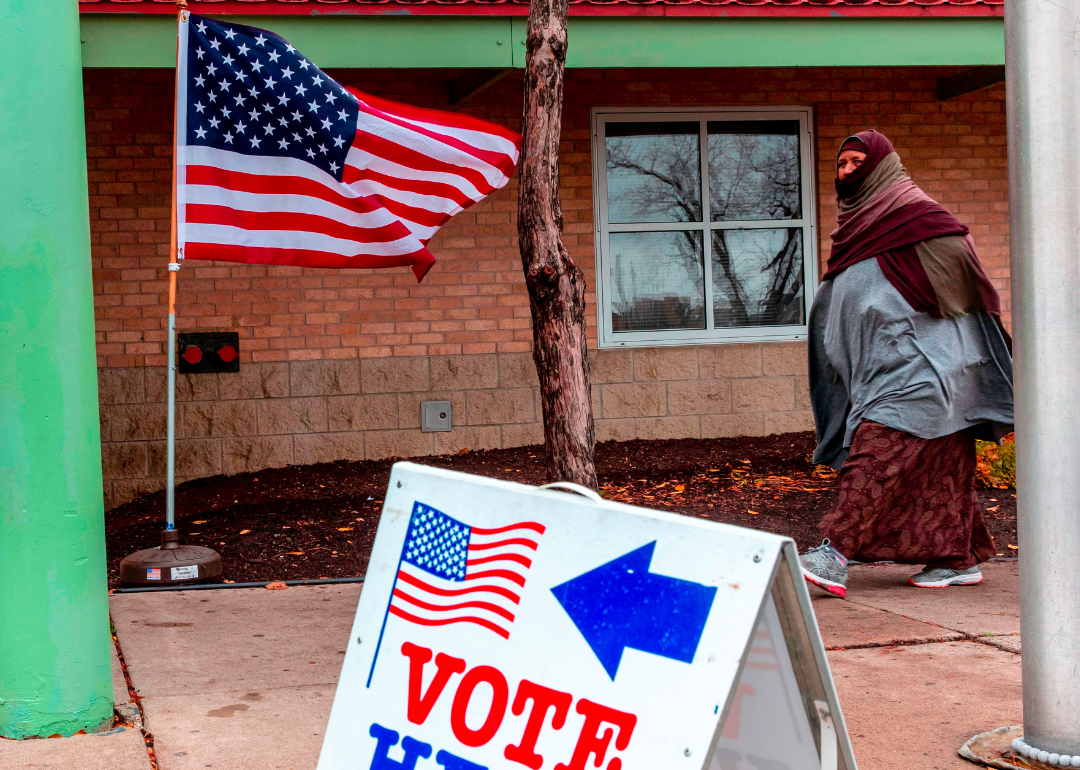
Eligible Hispanic voters have also seen significant changes since the last midterm elections, growing by nearly 4.7 million. About 3 out of every 5 new eligible voters in the last four years have been Hispanic. This demographic is an important target for both Democrats and Republicans in the 2022 midterms. While the majority of Hispanic and Latino voters lean Democrat, Trump—and the Republican Party more broadly—has gained popularity with this group in recent years.

Continue reading for an overview of the voter demographics of every state.

A pencil marking a ballot
1 / 51
Canva

Alabama

- Voting-eligible population: 3,829,788
- Breakdown by sex
--- Male: 47.7%
--- Female: 52.3%
- Breakdown by age
--- 18-29 years old: 19.9%
--- 30-44 years old: 23.9%
--- 45-64 years old: 33.2%
--- 65+ years old: 23.0%
- Breakdown by race/ethnicity
--- White: 68.2%
--- Black or African American: 25.6%
--- Asian: 0.9%
--- Hispanic or Latino: 2.3%
--- Native American or Alaska Native: 0.4%
--- Native Hawaiian or Pacific Islander: data unavailable
--- Two or more races: 3.9%
- Breakdown by education
--- Less than high school education: 2.9%
--- Some high school (no diploma): 8.8%
--- High school graduate or equivalency: 32.0%
--- Some college (no degree): 22.6%
--- Associate's degree: 8.4%
--- Bachelor's degree: 15.7%
--- Graduate or professional degree: 9.6%

2 / 51
John Moore // Getty Images

Alaska

- Voting-eligible population: 533,852
- Breakdown by sex
--- Male: 52.7%
--- Female: 47.3%
- Breakdown by age
--- 18-29 years old: 22.2%
--- 30-44 years old: 28.9%
--- 45-64 years old: 31.0%
--- 65+ years old: 18.0%
- Breakdown by race/ethnicity
--- White: 64.7%
--- Black or African American: data unavailable
--- Asian: 5.3%
--- Hispanic or Latino: 5.9%
--- Native American or Alaska Native: data unavailable
--- Native Hawaiian or Pacific Islander: 0.0%
--- Two or more races: 10.3%
- Breakdown by education
--- Less than high school education: 1.9%
--- Some high school (no diploma): 5.2%
--- High school graduate or equivalency: 30.6%
--- Some college (no degree): 25.2%
--- Associate's degree: 7.8%
--- Bachelor's degree: 18.7%
--- Graduate or professional degree: 10.4%

3 / 51
Ralph Freso // Getty Images

Arizona

- Voting-eligible population: 5,216,518
- Breakdown by sex
--- Male: 49.5%
--- Female: 50.5%
- Breakdown by age
--- 18-29 years old: 21.2%
--- 30-44 years old: 23.9%
--- 45-64 years old: 30.2%
--- 65+ years old: 24.7%
- Breakdown by race/ethnicity
--- White: 65.8%
--- Black or African American: 4.4%
--- Asian: 2.7%
--- Hispanic or Latino: 25.0%
--- Native American or Alaska Native: 3.9%
--- Native Hawaiian or Pacific Islander: data unavailable
--- Two or more races: 15.3%
- Breakdown by education
--- Less than high school education: 2.9%
--- Some high school (no diploma): 6.3%
--- High school graduate or equivalency: 24.9%
--- Some college (no degree): 25.8%
--- Associate's degree: 9.3%
--- Bachelor's degree: 19.3%
--- Graduate or professional degree: 11.5%

4 / 51
MICHAEL B. THOMAS // Getty Images

Arkansas

- Voting-eligible population: 2,237,649
- Breakdown by sex
--- Male: 48.5%
--- Female: 51.5%
- Breakdown by age
--- 18-29 years old: 20.2%
--- 30-44 years old: 24.4%
--- 45-64 years old: 32.1%
--- 65+ years old: 23.3%
- Breakdown by race/ethnicity
--- White: 74.5%
--- Black or African American: 14.6%
--- Asian: 1.0%
--- Hispanic or Latino: 4.3%
--- Native American or Alaska Native: 0.5%
--- Native Hawaiian or Pacific Islander: 0.0%
--- Two or more races: 7.6%
- Breakdown by education
--- Less than high school education: 3.1%
--- Some high school (no diploma): 7.0%
--- High school graduate or equivalency: 35.0%
--- Some college (no degree): 23.6%
--- Associate's degree: 7.6%
--- Bachelor's degree: 15.3%
--- Graduate or professional degree: 8.3%

A line of voters at a polling place
5 / 51
Canva

California

- Voting-eligible population: 26,028,290
- Breakdown by sex
--- Male: 49.4%
--- Female: 50.6%
- Breakdown by age
--- 18-29 years old: 22.0%
--- 30-44 years old: 25.9%
--- 45-64 years old: 31.1%
--- 65+ years old: 21.1%
- Breakdown by race/ethnicity
--- White: 46.8%
--- Black or African American: 6.4%
--- Asian: 14.5%
--- Hispanic or Latino: 32.2%
--- Native American or Alaska Native: 1.2%
--- Native Hawaiian or Pacific Islander: 0.0%
--- Two or more races: 15.8%
- Breakdown by education
--- Less than high school education: 4.7%
--- Some high school (no diploma): 5.7%
--- High school graduate or equivalency: 22.4%
--- Some college (no degree): 23.7%
--- Associate's degree: 8.3%
--- Bachelor's degree: 22.3%
--- Graduate or professional degree: 12.8%

6 / 51
Hyoung Chang/MediaNews Group/The Denver Post // Getty Images

Colorado

- Voting-eligible population: 4,303,604
- Breakdown by sex
--- Male: 50.4%
--- Female: 49.6%
- Breakdown by age
--- 18-29 years old: 21.3%
--- 30-44 years old: 27.7%
--- 45-64 years old: 31.0%
--- 65+ years old: 20.0%
- Breakdown by race/ethnicity
--- White: 76.5%
--- Black or African American: 3.7%
--- Asian: 2.6%
--- Hispanic or Latino: 16.8%
--- Native American or Alaska Native: 1.0%
--- Native Hawaiian or Pacific Islander: 0.0%
--- Two or more races: 11.4%
- Breakdown by education
--- Less than high school education: 2.0%
--- Some high school (no diploma): 4.4%
--- High school graduate or equivalency: 21.7%
--- Some college (no degree): 21.9%
--- Associate's degree: 8.0%
--- Bachelor's degree: 26.5%
--- Graduate or professional degree: 15.5%

7 / 51
Spencer Platt // Getty Images

Connecticut

- Voting-eligible population: 2,659,979
- Breakdown by sex
--- Male: 48.4%
--- Female: 51.6%
- Breakdown by age
--- 18-29 years old: 20.1%
--- 30-44 years old: 22.0%
--- 45-64 years old: 34.4%
--- 65+ years old: 23.6%
- Breakdown by race/ethnicity
--- White: 72.0%
--- Black or African American: 10.0%
--- Asian: 3.4%
--- Hispanic or Latino: 13.5%
--- Native American or Alaska Native: 0.3%
--- Native Hawaiian or Pacific Islander: data unavailable
--- Two or more races: 8.7%
- Breakdown by education
--- Less than high school education: 2.8%
--- Some high school (no diploma): 4.7%
--- High school graduate or equivalency: 26.2%
--- Some college (no degree): 19.1%
--- Associate's degree: 7.3%
--- Bachelor's degree: 22.9%
--- Graduate or professional degree: 17.0%

A "Vote Here" sign at a polling place
8 / 51
Canva

Delaware

- Voting-eligible population: 754,114
- Breakdown by sex
--- Male: 47.7%
--- Female: 52.3%
- Breakdown by age
--- 18-29 years old: 17.9%
--- 30-44 years old: 22.9%
--- 45-64 years old: 32.9%
--- 65+ years old: 26.3%
- Breakdown by race/ethnicity
--- White: 66.8%
--- Black or African American: 20.3%
--- Asian: 2.7%
--- Hispanic or Latino: 6.5%
--- Native American or Alaska Native: data unavailable
--- Native Hawaiian or Pacific Islander: data unavailable
--- Two or more races: 6.8%
- Breakdown by education
--- Less than high school education: 2.3%
--- Some high school (no diploma): 5.7%
--- High school graduate or equivalency: 29.6%
--- Some college (no degree): 20.6%
--- Associate's degree: 9.0%
--- Bachelor's degree: 19.4%
--- Graduate or professional degree: 13.4%

9 / 51
Joe Raedle // Getty Images

Florida

- Voting-eligible population: 15,855,982
- Breakdown by sex
--- Male: 48.4%
--- Female: 51.6%
- Breakdown by age
--- 18-29 years old: 17.5%
--- 30-44 years old: 22.5%
--- 45-64 years old: 32.3%
--- 65+ years old: 27.8%
- Breakdown by race/ethnicity
--- White: 62.4%
--- Black or African American: 14.2%
--- Asian: 2.4%
--- Hispanic or Latino: 21.7%
--- Native American or Alaska Native: 0.2%
--- Native Hawaiian or Pacific Islander: 0.0%
--- Two or more races: 15.7%
- Breakdown by education
--- Less than high school education: 3.1%
--- Some high school (no diploma): 5.9%
--- High school graduate or equivalency: 28.1%
--- Some college (no degree): 20.9%
--- Associate's degree: 10.4%
--- Bachelor's degree: 20.0%
--- Graduate or professional degree: 11.6%

10 / 51
Elijah Nouvelage // Getty Images

Georgia

- Voting-eligible population: 7,786,111
- Breakdown by sex
--- Male: 47.8%
--- Female: 52.2%
- Breakdown by age
--- 18-29 years old: 21.6%
--- 30-44 years old: 25.3%
--- 45-64 years old: 33.1%
--- 65+ years old: 20.0%
- Breakdown by race/ethnicity
--- White: 56.8%
--- Black or African American: 31.4%
--- Asian: 3.1%
--- Hispanic or Latino: 5.9%
--- Native American or Alaska Native: 0.3%
--- Native Hawaiian or Pacific Islander: data unavailable
--- Two or more races: 6.2%
- Breakdown by education
--- Less than high school education: 2.8%
--- Some high school (no diploma): 7.4%
--- High school graduate or equivalency: 28.3%
--- Some college (no degree): 21.7%
--- Associate's degree: 8.2%
--- Bachelor's degree: 19.7%
--- Graduate or professional degree: 12.0%

A poll worker on election day
11 / 51
Trevor Bexon // Shutterstock

Hawaii

- Voting-eligible population: 1,044,019
- Breakdown by sex
--- Male: 50.5%
--- Female: 49.5%
- Breakdown by age
--- 18-29 years old: 18.8%
--- 30-44 years old: 25.5%
--- 45-64 years old: 30.3%
--- 65+ years old: 25.3%
- Breakdown by race/ethnicity
--- White: 25.6%
--- Black or African American: 2.1%
--- Asian: 38.1%
--- Hispanic or Latino: 9.2%
--- Native American or Alaska Native: data unavailable
--- Native Hawaiian or Pacific Islander: 8.6%
--- Two or more races: 23.4%
- Breakdown by education
--- Less than high school education: 2.4%
--- Some high school (no diploma): 3.6%
--- High school graduate or equivalency: 27.6%
--- Some college (no degree): 21.6%
--- Associate's degree: 10.8%
--- Bachelor's degree: 21.7%
--- Graduate or professional degree: 12.3%

12 / 51
JEFF KOWALSKY // Getty Images

Idaho

- Voting-eligible population: 1,373,714
- Breakdown by sex
--- Male: 49.8%
--- Female: 50.2%
- Breakdown by age
--- 18-29 years old: 20.4%
--- 30-44 years old: 26.2%
--- 45-64 years old: 30.8%
--- 65+ years old: 22.6%
- Breakdown by race/ethnicity
--- White: 85.6%
--- Black or African American: 0.6%
--- Asian: 1.0%
--- Hispanic or Latino: 8.9%
--- Native American or Alaska Native: 1.1%
--- Native Hawaiian or Pacific Islander: data unavailable
--- Two or more races: 7.4%
- Breakdown by education
--- Less than high school education: 2.1%
--- Some high school (no diploma): 5.7%
--- High school graduate or equivalency: 28.8%
--- Some college (no degree): 25.2%
--- Associate's degree: 9.9%
--- Bachelor's degree: 19.1%
--- Graduate or professional degree: 9.3%

A polling place in Chicago, Illinois
13 / 51
Jonathan Daniel // Getty Images

Illinois

- Voting-eligible population: 9,087,338
- Breakdown by sex
--- Male: 48.7%
--- Female: 51.3%
- Breakdown by age
--- 18-29 years old: 20.5%
--- 30-44 years old: 24.6%
--- 45-64 years old: 32.6%
--- 65+ years old: 22.3%
- Breakdown by race/ethnicity
--- White: 67.5%
--- Black or African American: 14.1%
--- Asian: 4.6%
--- Hispanic or Latino: 12.6%
--- Native American or Alaska Native: 0.5%
--- Native Hawaiian or Pacific Islander: data unavailable
--- Two or more races: 8.1%
- Breakdown by education
--- Less than high school education: 2.8%
--- Some high school (no diploma): 5.3%
--- High school graduate or equivalency: 25.9%
--- Some college (no degree): 22.2%
--- Associate's degree: 8.4%
--- Bachelor's degree: 21.9%
--- Graduate or professional degree: 13.4%

14 / 51
SOPA Images // Getty Images

Indiana

- Voting-eligible population: 5,030,200
- Breakdown by sex
--- Male: 48.9%
--- Female: 51.1%
- Breakdown by age
--- 18-29 years old: 21.0%
--- 30-44 years old: 24.4%
--- 45-64 years old: 32.6%
--- 65+ years old: 22.0%
- Breakdown by race/ethnicity
--- White: 82.7%
--- Black or African American: 8.2%
--- Asian: 1.5%
--- Hispanic or Latino: 4.8%
--- Native American or Alaska Native: 0.2%
--- Native Hawaiian or Pacific Islander: data unavailable
--- Two or more races: 5.3%
- Breakdown by education
--- Less than high school education: 2.8%
--- Some high school (no diploma): 6.3%
--- High school graduate or equivalency: 34.0%
--- Some college (no degree): 21.6%
--- Associate's degree: 8.6%
--- Bachelor's degree: 17.5%
--- Graduate or professional degree: 9.0%

A voter holding a baby while completing a ballot in Des Moines, Iowa
15 / 51
Mario Tama // Getty Images

Iowa

- Voting-eligible population: 2,379,570
- Breakdown by sex
--- Male: 49.5%
--- Female: 50.5%
- Breakdown by age
--- 18-29 years old: 21.0%
--- 30-44 years old: 23.8%
--- 45-64 years old: 31.5%
--- 65+ years old: 23.7%
- Breakdown by race/ethnicity
--- White: 89.0%
--- Black or African American: 2.9%
--- Asian: 1.6%
--- Hispanic or Latino: 4.1%
--- Native American or Alaska Native: 0.4%
--- Native Hawaiian or Pacific Islander: 0.0%
--- Two or more races: 4.8%
- Breakdown by education
--- Less than high school education: 2.0%
--- Some high school (no diploma): 4.3%
--- High school graduate or equivalency: 30.5%
--- Some college (no degree): 23.3%
--- Associate's degree: 11.7%
--- Bachelor's degree: 19.7%
--- Graduate or professional degree: 8.5%

16 / 51
Scott Olson // Getty Images

Kansas

- Voting-eligible population: 2,128,111
- Breakdown by sex
--- Male: 49.5%
--- Female: 50.5%
- Breakdown by age
--- 18-29 years old: 21.4%
--- 30-44 years old: 24.5%
--- 45-64 years old: 31.3%
--- 65+ years old: 22.8%
- Breakdown by race/ethnicity
--- White: 81.9%
--- Black or African American: 5.3%
--- Asian: 2.1%
--- Hispanic or Latino: 8.1%
--- Native American or Alaska Native: 0.6%
--- Native Hawaiian or Pacific Islander: data unavailable
--- Two or more races: 7.5%
- Breakdown by education
--- Less than high school education: 2.1%
--- Some high school (no diploma): 5.0%
--- High school graduate or equivalency: 26.4%
--- Some college (no degree): 24.9%
--- Associate's degree: 8.8%
--- Bachelor's degree: 21.1%
--- Graduate or professional degree: 11.7%

17 / 51
Brett Carlsen // Getty Images

Kentucky

- Voting-eligible population: 3,405,618
- Breakdown by sex
--- Male: 48.8%
--- Female: 51.2%
- Breakdown by age
--- 18-29 years old: 20.1%
--- 30-44 years old: 24.3%
--- 45-64 years old: 33.1%
--- 65+ years old: 22.4%
- Breakdown by race/ethnicity
--- White: 86.7%
--- Black or African American: 6.8%
--- Asian: 0.9%
--- Hispanic or Latino: 2.0%
--- Native American or Alaska Native: 0.2%
--- Native Hawaiian or Pacific Islander: data unavailable
--- Two or more races: 4.5%
- Breakdown by education
--- Less than high school education: 3.9%
--- Some high school (no diploma): 7.4%
--- High school graduate or equivalency: 33.6%
--- Some college (no degree): 21.2%
--- Associate's degree: 8.7%
--- Bachelor's degree: 15.3%
--- Graduate or professional degree: 9.9%

18 / 51
Jonathan Bachman // Getty Images

Louisiana

- Voting-eligible population: 3,439,830
- Breakdown by sex
--- Male: 48.2%
--- Female: 51.8%
- Breakdown by age
--- 18-29 years old: 20.0%
--- 30-44 years old: 26.1%
--- 45-64 years old: 31.8%
--- 65+ years old: 22.1%
- Breakdown by race/ethnicity
--- White: 61.4%
--- Black or African American: 30.7%
--- Asian: 1.4%
--- Hispanic or Latino: 3.3%
--- Native American or Alaska Native: 0.5%
--- Native Hawaiian or Pacific Islander: data unavailable
--- Two or more races: 5.0%
- Breakdown by education
--- Less than high school education: 3.6%
--- Some high school (no diploma): 9.4%
--- High school graduate or equivalency: 33.6%
--- Some college (no degree): 22.7%
--- Associate's degree: 6.3%
--- Bachelor's degree: 15.9%
--- Graduate or professional degree: 8.5%

19 / 51
Portland Press Herald // Getty Images

Maine

- Voting-eligible population: 1,100,974
- Breakdown by sex
--- Male: 48.8%
--- Female: 51.2%
- Breakdown by age
--- 18-29 years old: 16.5%
--- 30-44 years old: 22.4%
--- 45-64 years old: 34.4%
--- 65+ years old: 26.7%
- Breakdown by race/ethnicity
--- White: 92.4%
--- Black or African American: 0.9%
--- Asian: 0.9%
--- Hispanic or Latino: 1.5%
--- Native American or Alaska Native: data unavailable
--- Native Hawaiian or Pacific Islander: data unavailable
--- Two or more races: 4.7%
- Breakdown by education
--- Less than high school education: 1.6%
--- Some high school (no diploma): 4.1%
--- High school graduate or equivalency: 30.6%
--- Some college (no degree): 20.4%
--- Associate's degree: 9.9%
--- Bachelor's degree: 20.9%
--- Graduate or professional degree: 12.6%

A Maryland ballot from July 2022
20 / 51
Nathan Howard // Getty Images

Maryland

- Voting-eligible population: 4,417,293
- Breakdown by sex
--- Male: 47.8%
--- Female: 52.2%
- Breakdown by age
--- 18-29 years old: 19.3%
--- 30-44 years old: 24.7%
--- 45-64 years old: 34.0%
--- 65+ years old: 22.0%
- Breakdown by race/ethnicity
--- White: 55.0%
--- Black or African American: 30.1%
--- Asian: 5.3%
--- Hispanic or Latino: 6.3%
--- Native American or Alaska Native: 0.3%
--- Native Hawaiian or Pacific Islander: data unavailable
--- Two or more races: 6.1%
- Breakdown by education
--- Less than high school education: 2.1%
--- Some high school (no diploma): 5.3%
--- High school graduate or equivalency: 25.0%
--- Some college (no degree): 20.4%
--- Associate's degree: 6.8%
--- Bachelor's degree: 22.1%
--- Graduate or professional degree: 18.3%

21 / 51
MediaNews Group/Boston Herald // Getty Images

Massachusetts

- Voting-eligible population: 5,121,488
- Breakdown by sex
--- Male: 48.0%
--- Female: 52.0%
- Breakdown by age
--- 18-29 years old: 20.6%
--- 30-44 years old: 23.2%
--- 45-64 years old: 33.2%
--- 65+ years old: 22.9%
- Breakdown by race/ethnicity
--- White: 76.7%
--- Black or African American: 6.0%
--- Asian: 5.1%
--- Hispanic or Latino: 9.3%
--- Native American or Alaska Native: 0.2%
--- Native Hawaiian or Pacific Islander: data unavailable
--- Two or more races: 7.8%
- Breakdown by education
--- Less than high school education: 3.1%
--- Some high school (no diploma): 4.6%
--- High school graduate or equivalency: 23.6%
--- Some college (no degree): 17.6%
--- Associate's degree: 7.4%
--- Bachelor's degree: 25.2%
--- Graduate or professional degree: 18.7%

Voters casting ballots in Warren, Michigan
22 / 51
GEOFF ROBINS // Getty Images

Michigan

- Voting-eligible population: 7,640,514
- Breakdown by sex
--- Male: 49.0%
--- Female: 51.0%
- Breakdown by age
--- 18-29 years old: 20.0%
--- 30-44 years old: 23.1%
--- 45-64 years old: 33.3%
--- 65+ years old: 23.6%
- Breakdown by race/ethnicity
--- White: 77.7%
--- Black or African American: 13.1%
--- Asian: 2.2%
--- Hispanic or Latino: 3.9%
--- Native American or Alaska Native: 0.5%
--- Native Hawaiian or Pacific Islander: data unavailable
--- Two or more races: 5.2%
- Breakdown by education
--- Less than high school education: 2.0%
--- Some high school (no diploma): 6.0%
--- High school graduate or equivalency: 29.7%
--- Some college (no degree): 24.0%
--- Associate's degree: 9.4%
--- Bachelor's degree: 18.2%
--- Graduate or professional degree: 10.7%

23 / 51
KEREM YUCEL // Getty Images

Minnesota

- Voting-eligible population: 4,221,515
- Breakdown by sex
--- Male: 49.7%
--- Female: 50.3%
- Breakdown by age
--- 18-29 years old: 19.5%
--- 30-44 years old: 25.4%
--- 45-64 years old: 32.6%
--- 65+ years old: 22.5%
- Breakdown by race/ethnicity
--- White: 83.7%
--- Black or African American: 5.1%
--- Asian: 4.0%
--- Hispanic or Latino: 3.5%
--- Native American or Alaska Native: 0.8%
--- Native Hawaiian or Pacific Islander: data unavailable
--- Two or more races: 4.8%
- Breakdown by education
--- Less than high school education: 1.8%
--- Some high school (no diploma): 3.8%
--- High school graduate or equivalency: 24.3%
--- Some college (no degree): 22.3%
--- Associate's degree: 11.6%
--- Bachelor's degree: 24.4%
--- Graduate or professional degree: 11.8%

24 / 51
Scott Olson // Getty Images

Mississippi

- Voting-eligible population: 2,226,474
- Breakdown by sex
--- Male: 47.7%
--- Female: 52.3%
- Breakdown by age
--- 18-29 years old: 20.6%
--- 30-44 years old: 24.7%
--- 45-64 years old: 32.5%
--- 65+ years old: 22.2%
- Breakdown by race/ethnicity
--- White: 58.7%
--- Black or African American: 35.4%
--- Asian: 0.6%
--- Hispanic or Latino: 2.0%
--- Native American or Alaska Native: data unavailable
--- Native Hawaiian or Pacific Islander: data unavailable
--- Two or more races: 4.1%
- Breakdown by education
--- Less than high school education: 3.9%
--- Some high school (no diploma): 9.2%
--- High school graduate or equivalency: 30.5%
--- Some college (no degree): 23.3%
--- Associate's degree: 10.3%
--- Bachelor's degree: 14.6%
--- Graduate or professional degree: 8.1%

25 / 51
Michael B. Thomas // Getty Images

Missouri

- Voting-eligible population: 4,675,531
- Breakdown by sex
--- Male: 48.7%
--- Female: 51.3%
- Breakdown by age
--- 18-29 years old: 19.8%
--- 30-44 years old: 24.7%
--- 45-64 years old: 32.5%
--- 65+ years old: 23.1%
- Breakdown by race/ethnicity
--- White: 81.0%
--- Black or African American: 10.3%
--- Asian: 1.4%
--- Hispanic or Latino: 2.9%
--- Native American or Alaska Native: 0.3%
--- Native Hawaiian or Pacific Islander: 0.0%
--- Two or more races: 5.9%
- Breakdown by education
--- Less than high school education: 2.2%
--- Some high school (no diploma): 6.3%
--- High school graduate or equivalency: 31.4%
--- Some college (no degree): 22.6%
--- Associate's degree: 8.2%
--- Bachelor's degree: 18.6%
--- Graduate or professional degree: 10.7%

26 / 51
Justin Sullivan // Getty Images

Montana

- Voting-eligible population: 857,649
- Breakdown by sex
--- Male: 50.6%
--- Female: 49.4%
- Breakdown by age
--- 18-29 years old: 19.5%
--- 30-44 years old: 24.3%
--- 45-64 years old: 30.9%
--- 65+ years old: 25.2%
- Breakdown by race/ethnicity
--- White: 87.5%
--- Black or African American: data unavailable
--- Asian: 0.6%
--- Hispanic or Latino: 3.3%
--- Native American or Alaska Native: data unavailable
--- Native Hawaiian or Pacific Islander: data unavailable
--- Two or more races: 5.3%
- Breakdown by education
--- Less than high school education: 1.3%
--- Some high school (no diploma): 4.8%
--- High school graduate or equivalency: 28.3%
--- Some college (no degree): 24.8%
--- Associate's degree: 8.6%
--- Bachelor's degree: 21.2%
--- Graduate or professional degree: 11.0%

A person playing violin for people waiting in line to vote in Nebraska
27 / 51
Tom Williams // Getty Images

Nebraska

- Voting-eligible population: 1,411,320
- Breakdown by sex
--- Male: 49.6%
--- Female: 50.4%
- Breakdown by age
--- 18-29 years old: 21.2%
--- 30-44 years old: 25.0%
--- 45-64 years old: 31.3%
--- 65+ years old: 22.6%
- Breakdown by race/ethnicity
--- White: 84.8%
--- Black or African American: 4.2%
--- Asian: 1.6%
--- Hispanic or Latino: 7.1%
--- Native American or Alaska Native: 1.0%
--- Native Hawaiian or Pacific Islander: data unavailable
--- Two or more races: 5.7%
- Breakdown by education
--- Less than high school education: 2.1%
--- Some high school (no diploma): 4.6%
--- High school graduate or equivalency: 26.1%
--- Some college (no degree): 24.3%
--- Associate's degree: 10.5%
--- Bachelor's degree: 21.7%
--- Graduate or professional degree: 10.8%

28 / 51
Ethan Miller // Getty Images

Nevada

- Voting-eligible population: 2,193,360
- Breakdown by sex
--- Male: 50.2%
--- Female: 49.8%
- Breakdown by age
--- 18-29 years old: 19.8%
--- 30-44 years old: 26.2%
--- 45-64 years old: 31.5%
--- 65+ years old: 22.5%
- Breakdown by race/ethnicity
--- White: 57.6%
--- Black or African American: 9.5%
--- Asian: 8.3%
--- Hispanic or Latino: 21.9%
--- Native American or Alaska Native: 1.3%
--- Native Hawaiian or Pacific Islander: 0.0%
--- Two or more races: 13.9%
- Breakdown by education
--- Less than high school education: 3.2%
--- Some high school (no diploma): 6.7%
--- High school graduate or equivalency: 29.0%
--- Some college (no degree): 25.5%
--- Associate's degree: 9.0%
--- Bachelor's degree: 17.5%
--- Graduate or professional degree: 9.2%

A poll watcher monitoring voters in Manchester, New Hampshire
29 / 51
JOSEPH PREZIOSO // Getty Images

New Hampshire

- Voting-eligible population: 1,103,239
- Breakdown by sex
--- Male: 49.6%
--- Female: 50.4%
- Breakdown by age
--- 18-29 years old: 18.6%
--- 30-44 years old: 22.4%
--- 45-64 years old: 35.1%
--- 65+ years old: 24.0%
- Breakdown by race/ethnicity
--- White: 90.6%
--- Black or African American: 1.2%
--- Asian: 1.8%
--- Hispanic or Latino: 3.4%
--- Native American or Alaska Native: data unavailable
--- Native Hawaiian or Pacific Islander: data unavailable
--- Two or more races: 5.1%
- Breakdown by education
--- Less than high school education: 1.7%
--- Some high school (no diploma): 3.9%
--- High school graduate or equivalency: 27.6%
--- Some college (no degree): 20.2%
--- Associate's degree: 9.4%
--- Bachelor's degree: 23.1%
--- Graduate or professional degree: 14.1%

A voter in Jersey City, New Jersey, walklin to a polling place to vote
30 / 51
Kena Betancur // Getty Images

New Jersey

- Voting-eligible population: 6,433,068
- Breakdown by sex
--- Male: 48.5%
--- Female: 51.5%
- Breakdown by age
--- 18-29 years old: 18.8%
--- 30-44 years old: 22.9%
--- 45-64 years old: 35.1%
--- 65+ years old: 23.3%
- Breakdown by race/ethnicity
--- White: 62.1%
--- Black or African American: 13.3%
--- Asian: 7.7%
--- Hispanic or Latino: 16.3%
--- Native American or Alaska Native: 0.2%
--- Native Hawaiian or Pacific Islander: data unavailable
--- Two or more races: 9.7%
- Breakdown by education
--- Less than high school education: 2.8%
--- Some high school (no diploma): 4.5%
--- High school graduate or equivalency: 25.9%
--- Some college (no degree): 18.3%
--- Associate's degree: 7.2%
--- Bachelor's degree: 25.6%
--- Graduate or professional degree: 15.6%

31 / 51
NurPhoto // Getty Images

New Mexico

- Voting-eligible population: 1,545,938
- Breakdown by sex
--- Male: 49.4%
--- Female: 50.6%
- Breakdown by age
--- 18-29 years old: 20.2%
--- 30-44 years old: 24.7%
--- 45-64 years old: 30.5%
--- 65+ years old: 24.6%
- Breakdown by race/ethnicity
--- White: 50.3%
--- Black or African American: 2.1%
--- Asian: 1.3%
--- Hispanic or Latino: 44.3%
--- Native American or Alaska Native: 9.4%
--- Native Hawaiian or Pacific Islander: data unavailable
--- Two or more races: 24.0%
- Breakdown by education
--- Less than high school education: 3.1%
--- Some high school (no diploma): 8.0%
--- High school graduate or equivalency: 27.2%
--- Some college (no degree): 24.5%
--- Associate's degree: 8.9%
--- Bachelor's degree: 15.5%
--- Graduate or professional degree: 12.8%

A polling place at the Brooklyn Museum in New York, New York
32 / 51
ANGELA WEISS // Getty Images

New York

- Voting-eligible population: 14,109,037
- Breakdown by sex
--- Male: 48.0%
--- Female: 52.0%
- Breakdown by age
--- 18-29 years old: 20.0%
--- 30-44 years old: 24.1%
--- 45-64 years old: 32.6%
--- 65+ years old: 23.3%
- Breakdown by race/ethnicity
--- White: 61.9%
--- Black or African American: 14.1%
--- Asian: 6.9%
--- Hispanic or Latino: 15.5%
--- Native American or Alaska Native: 0.5%
--- Native Hawaiian or Pacific Islander: 0.0%
--- Two or more races: 8.7%
- Breakdown by education
--- Less than high school education: 3.9%
--- Some high school (no diploma): 5.8%
--- High school graduate or equivalency: 24.8%
--- Some college (no degree): 17.8%
--- Associate's degree: 9.0%
--- Bachelor's degree: 22.3%
--- Graduate or professional degree: 16.4%

33 / 51
The Washington Post // Getty Images

North Carolina

- Voting-eligible population: 7,808,186
- Breakdown by sex
--- Male: 48.0%
--- Female: 52.0%
- Breakdown by age
--- 18-29 years old: 20.4%
--- 30-44 years old: 23.7%
--- 45-64 years old: 33.2%
--- 65+ years old: 22.7%
- Breakdown by race/ethnicity
--- White: 68.1%
--- Black or African American: 20.7%
--- Asian: 2.1%
--- Hispanic or Latino: 5.2%
--- Native American or Alaska Native: 1.0%
--- Native Hawaiian or Pacific Islander: data unavailable
--- Two or more races: 5.8%
- Breakdown by education
--- Less than high school education: 2.5%
--- Some high school (no diploma): 6.3%
--- High school graduate or equivalency: 26.3%
--- Some college (no degree): 22.6%
--- Associate's degree: 9.9%
--- Bachelor's degree: 20.8%
--- Graduate or professional degree: 11.6%

34 / 51
Sean Rayford // Getty Images

North Dakota

- Voting-eligible population: 576,588
- Breakdown by sex
--- Male: 51.6%
--- Female: 48.4%
- Breakdown by age
--- 18-29 years old: 23.7%
--- 30-44 years old: 25.7%
--- 45-64 years old: 29.1%
--- 65+ years old: 21.4%
- Breakdown by race/ethnicity
--- White: 86.8%
--- Black or African American: 2.0%
--- Asian: 0.8%
--- Hispanic or Latino: 3.5%
--- Native American or Alaska Native: data unavailable
--- Native Hawaiian or Pacific Islander: data unavailable
--- Two or more races: 4.5%
- Breakdown by education
--- Less than high school education: 2.3%
--- Some high school (no diploma): 4.3%
--- High school graduate or equivalency: 26.7%
--- Some college (no degree): 24.3%
--- Associate's degree: 13.7%
--- Bachelor's degree: 21.1%
--- Graduate or professional degree: 7.7%

Voters arriving to cast their ballots earlyat the Franklin County Board of Elections polling location in Columbus, Ohio
35 / 51
Drew Angerer // Getty Images

Ohio

- Voting-eligible population: 8,943,128
- Breakdown by sex
--- Male: 48.6%
--- Female: 51.4%
- Breakdown by age
--- 18-29 years old: 19.7%
--- 30-44 years old: 23.9%
--- 45-64 years old: 33.1%
--- 65+ years old: 23.3%
- Breakdown by race/ethnicity
--- White: 81.1%
--- Black or African American: 11.2%
--- Asian: 1.6%
--- Hispanic or Latino: 3.0%
--- Native American or Alaska Native: 0.2%
--- Native Hawaiian or Pacific Islander: data unavailable
--- Two or more races: 4.8%
- Breakdown by education
--- Less than high school education: 2.3%
--- Some high school (no diploma): 6.0%
--- High school graduate or equivalency: 33.7%
--- Some college (no degree): 21.2%
--- Associate's degree: 8.5%
--- Bachelor's degree: 18.0%
--- Graduate or professional degree: 10.3%

36 / 51
Brett Deering // Getty Images

Oklahoma

- Voting-eligible population: 2,903,864
- Breakdown by sex
--- Male: 49.0%
--- Female: 51.0%
- Breakdown by age
--- 18-29 years old: 21.4%
--- 30-44 years old: 25.7%
--- 45-64 years old: 31.0%
--- 65+ years old: 22.0%
- Breakdown by race/ethnicity
--- White: 71.0%
--- Black or African American: 7.0%
--- Asian: 1.7%
--- Hispanic or Latino: 7.0%
--- Native American or Alaska Native: 7.2%
--- Native Hawaiian or Pacific Islander: 0.0%
--- Two or more races: 10.8%
- Breakdown by education
--- Less than high school education: 2.6%
--- Some high school (no diploma): 7.9%
--- High school graduate or equivalency: 32.2%
--- Some college (no degree): 23.8%
--- Associate's degree: 7.9%
--- Bachelor's degree: 17.2%
--- Graduate or professional degree: 8.4%

37 / 51
Craig Mitchelldyer // Getty Images

Oregon

- Voting-eligible population: 3,200,314
- Breakdown by sex
--- Male: 49.3%
--- Female: 50.7%
- Breakdown by age
--- 18-29 years old: 19.0%
--- 30-44 years old: 25.9%
--- 45-64 years old: 30.9%
--- 65+ years old: 24.2%
- Breakdown by race/ethnicity
--- White: 80.5%
--- Black or African American: 1.8%
--- Asian: 3.6%
--- Hispanic or Latino: 9.3%
--- Native American or Alaska Native: 1.2%
--- Native Hawaiian or Pacific Islander: 0.0%
--- Two or more races: 9.3%
- Breakdown by education
--- Less than high school education: 1.9%
--- Some high school (no diploma): 5.2%
--- High school graduate or equivalency: 23.5%
--- Some college (no degree): 26.4%
--- Associate's degree: 8.9%
--- Bachelor's degree: 21.6%
--- Graduate or professional degree: 12.5%

38 / 51
Jessica Kourkounis // Getty Images

Pennsylvania

- Voting-eligible population: 9,918,163
- Breakdown by sex
--- Male: 48.8%
--- Female: 51.2%
- Breakdown by age
--- 18-29 years old: 18.9%
--- 30-44 years old: 23.5%
--- 45-64 years old: 33.1%
--- 65+ years old: 24.5%
- Breakdown by race/ethnicity
--- White: 79.5%
--- Black or African American: 10.0%
--- Asian: 2.5%
--- Hispanic or Latino: 6.0%
--- Native American or Alaska Native: 0.2%
--- Native Hawaiian or Pacific Islander: data unavailable
--- Two or more races: 5.0%
- Breakdown by education
--- Less than high school education: 2.3%
--- Some high school (no diploma): 5.6%
--- High school graduate or equivalency: 34.0%
--- Some college (no degree): 17.5%
--- Associate's degree: 8.5%
--- Bachelor's degree: 19.8%
--- Graduate or professional degree: 12.3%

"I Voted" stickers at the Hope Highlands Middle School polling site in Cranston, Rhode Island
39 / 51
Boston Globe // Getty Images

Rhode Island

- Voting-eligible population: 827,415
- Breakdown by sex
--- Male: 48.3%
--- Female: 51.7%
- Breakdown by age
--- 18-29 years old: 20.6%
--- 30-44 years old: 23.1%
--- 45-64 years old: 32.8%
--- 65+ years old: 23.5%
- Breakdown by race/ethnicity
--- White: 78.0%
--- Black or African American: 4.3%
--- Asian: 2.2%
--- Hispanic or Latino: 11.8%
--- Native American or Alaska Native: data unavailable
--- Native Hawaiian or Pacific Islander: data unavailable
--- Two or more races: 9.1%
- Breakdown by education
--- Less than high school education: 3.0%
--- Some high school (no diploma): 6.2%
--- High school graduate or equivalency: 28.2%
--- Some college (no degree): 20.2%
--- Associate's degree: 7.6%
--- Bachelor's degree: 20.8%
--- Graduate or professional degree: 14.0%

40 / 51
LOGAN CYRUS // Getty Images

South Carolina

- Voting-eligible population: 3,940,745
- Breakdown by sex
--- Male: 47.8%
--- Female: 52.2%
- Breakdown by age
--- 18-29 years old: 19.5%
--- 30-44 years old: 23.5%
--- 45-64 years old: 32.6%
--- 65+ years old: 24.3%
- Breakdown by race/ethnicity
--- White: 67.6%
--- Black or African American: 25.0%
--- Asian: 1.2%
--- Hispanic or Latino: 3.4%
--- Native American or Alaska Native: 0.2%
--- Native Hawaiian or Pacific Islander: data unavailable
--- Two or more races: 4.5%
- Breakdown by education
--- Less than high school education: 2.5%
--- Some high school (no diploma): 7.5%
--- High school graduate or equivalency: 29.3%
--- Some college (no degree): 21.6%
--- Associate's degree: 9.8%
--- Bachelor's degree: 18.7%
--- Graduate or professional degree: 10.6%

A person voting in a polling place
41 / 51
Halfpoint // Shutterstock

South Dakota

- Voting-eligible population: 659,768
- Breakdown by sex
--- Male: 50.3%
--- Female: 49.7%
- Breakdown by age
--- 18-29 years old: 20.2%
--- 30-44 years old: 24.7%
--- 45-64 years old: 31.3%
--- 65+ years old: 23.8%
- Breakdown by race/ethnicity
--- White: 85.6%
--- Black or African American: 1.5%
--- Asian: 0.7%
--- Hispanic or Latino: 2.7%
--- Native American or Alaska Native: data unavailable
--- Native Hawaiian or Pacific Islander: data unavailable
--- Two or more races: 4.2%
- Breakdown by education
--- Less than high school education: 2.1%
--- Some high school (no diploma): 5.5%
--- High school graduate or equivalency: 29.8%
--- Some college (no degree): 21.8%
--- Associate's degree: 11.9%
--- Bachelor's degree: 20.2%
--- Graduate or professional degree: 8.7%

Voters waiting in-line to entering a polling station in Franklin, Tennessee
42 / 51
Alex Wong // Getty Images

Tennessee

- Voting-eligible population: 5,248,512
- Breakdown by sex
--- Male: 48.2%
--- Female: 51.8%
- Breakdown by age
--- 18-29 years old: 20.1%
--- 30-44 years old: 24.4%
--- 45-64 years old: 33.1%
--- 65+ years old: 22.4%
- Breakdown by race/ethnicity
--- White: 77.5%
--- Black or African American: 15.3%
--- Asian: 1.1%
--- Hispanic or Latino: 2.8%
--- Native American or Alaska Native: 0.2%
--- Native Hawaiian or Pacific Islander: data unavailable
--- Two or more races: 4.7%
- Breakdown by education
--- Less than high school education: 2.9%
--- Some high school (no diploma): 6.5%
--- High school graduate or equivalency: 32.3%
--- Some college (no degree): 22.2%
--- Associate's degree: 7.6%
--- Bachelor's degree: 18.4%
--- Graduate or professional degree: 10.0%

43 / 51
Sergio Flores // Getty Images

Texas

- Voting-eligible population: 19,375,866
- Breakdown by sex
--- Male: 49.2%
--- Female: 50.8%
- Breakdown by age
--- 18-29 years old: 22.8%
--- 30-44 years old: 27.0%
--- 45-64 years old: 31.3%
--- 65+ years old: 18.9%
- Breakdown by race/ethnicity
--- White: 55.1%
--- Black or African American: 12.9%
--- Asian: 4.2%
--- Hispanic or Latino: 31.9%
--- Native American or Alaska Native: 0.7%
--- Native Hawaiian or Pacific Islander: 0.0%
--- Two or more races: 19.3%
- Breakdown by education
--- Less than high school education: 3.9%
--- Some high school (no diploma): 6.7%
--- High school graduate or equivalency: 26.6%
--- Some college (no degree): 23.6%
--- Associate's degree: 7.8%
--- Bachelor's degree: 20.9%
--- Graduate or professional degree: 10.6%

44 / 51
George Frey // Getty Images

Utah

- Voting-eligible population: 2,251,328
- Breakdown by sex
--- Male: 50.1%
--- Female: 49.9%
- Breakdown by age
--- 18-29 years old: 26.7%
--- 30-44 years old: 28.6%
--- 45-64 years old: 27.8%
--- 65+ years old: 16.9%
- Breakdown by race/ethnicity
--- White: 84.7%
--- Black or African American: 0.9%
--- Asian: 2.1%
--- Hispanic or Latino: 10.1%
--- Native American or Alaska Native: 0.9%
--- Native Hawaiian or Pacific Islander: 0.0%
--- Two or more races: 7.0%
- Breakdown by education
--- Less than high school education: 1.6%
--- Some high school (no diploma): 4.7%
--- High school graduate or equivalency: 23.9%
--- Some college (no degree): 27.8%
--- Associate's degree: 9.4%
--- Bachelor's degree: 21.7%
--- Graduate or professional degree: 10.9%

A polling place inside the Robert Miller Community Center in Burlington, Vermont
45 / 51
Chip Somodevilla // Getty Images

Vermont

- Voting-eligible population: 518,387
- Breakdown by sex
--- Male: 49.3%
--- Female: 50.7%
- Breakdown by age
--- 18-29 years old: 19.6%
--- 30-44 years old: 22.0%
--- 45-64 years old: 33.0%
--- 65+ years old: 25.3%
- Breakdown by race/ethnicity
--- White: 93.0%
--- Black or African American: 0.9%
--- Asian: 1.0%
--- Hispanic or Latino: 1.8%
--- Native American or Alaska Native: data unavailable
--- Native Hawaiian or Pacific Islander: data unavailable
--- Two or more races: 4.2%
- Breakdown by education
--- Less than high school education: 1.5%
--- Some high school (no diploma): 4.3%
--- High school graduate or equivalency: 26.9%
--- Some college (no degree): 19.1%
--- Associate's degree: 7.6%
--- Bachelor's degree: 24.6%
--- Graduate or professional degree: 16.0%

46 / 51
ANDREW CABALLERO-REYNOLDS // Getty Images

Virginia

- Voting-eligible population: 6,354,439
- Breakdown by sex
--- Male: 48.9%
--- Female: 51.1%
- Breakdown by age
--- 18-29 years old: 20.5%
--- 30-44 years old: 25.0%
--- 45-64 years old: 32.8%
--- 65+ years old: 21.7%
- Breakdown by race/ethnicity
--- White: 65.9%
--- Black or African American: 19.0%
--- Asian: 5.5%
--- Hispanic or Latino: 6.5%
--- Native American or Alaska Native: 0.4%
--- Native Hawaiian or Pacific Islander: data unavailable
--- Two or more races: 6.9%
- Breakdown by education
--- Less than high school education: 2.5%
--- Some high school (no diploma): 5.1%
--- High school graduate or equivalency: 25.5%
--- Some college (no degree): 20.9%
--- Associate's degree: 7.5%
--- Bachelor's degree: 22.4%
--- Graduate or professional degree: 16.2%

An election worker making a record of a ballot pickup in Vancouver, Washington
47 / 51
Nathan Howard // Getty Images

Washington

- Voting-eligible population: 5,529,508
- Breakdown by sex
--- Male: 50.0%
--- Female: 50.0%
- Breakdown by age
--- 18-29 years old: 20.1%
--- 30-44 years old: 26.6%
--- 45-64 years old: 31.4%
--- 65+ years old: 21.9%
- Breakdown by race/ethnicity
--- White: 74.5%
--- Black or African American: 3.8%
--- Asian: 7.2%
--- Hispanic or Latino: 8.7%
--- Native American or Alaska Native: 1.2%
--- Native Hawaiian or Pacific Islander: 0.0%
--- Two or more races: 9.3%
- Breakdown by education
--- Less than high school education: 2.0%
--- Some high school (no diploma): 4.5%
--- High school graduate or equivalency: 23.4%
--- Some college (no degree): 23.8%
--- Associate's degree: 10.4%
--- Bachelor's degree: 23.0%
--- Graduate or professional degree: 12.9%

Voting systems at a polling station in Washington, D.C.
48 / 51
Xinhua News Agency // Getty Images

Washington D.C.

- Voting-eligible population: 502,670
- Breakdown by sex
--- Male: 46.6%
--- Female: 53.4%
- Breakdown by age
--- 18-29 years old: 25.4%
--- 30-44 years old: 33.6%
--- 45-64 years old: 24.6%
--- 65+ years old: 16.3%
- Breakdown by race/ethnicity
--- White: 42.7%
--- Black or African American: 43.4%
--- Asian: 3.9%
--- Hispanic or Latino: 7.2%
--- Native American or Alaska Native: data unavailable
--- Native Hawaiian or Pacific Islander: data unavailable
--- Two or more races: 7.5%
- Breakdown by education
--- Less than high school education: 2.3%
--- Some high school (no diploma): 3.8%
--- High school graduate or equivalency: 15.7%
--- Some college (no degree): 16.2%
--- Associate's degree: 3.0%
--- Bachelor's degree: 25.7%
--- Graduate or professional degree: 33.2%

Early voters outside of the Judge Black Annex polling location in Parkersburg, West Virginia
49 / 51
STEPHEN ZENNER // Getty Images

West Virginia

- Voting-eligible population: 1,408,767
- Breakdown by sex
--- Male: 49.3%
--- Female: 50.7%
- Breakdown by age
--- 18-29 years old: 17.9%
--- 30-44 years old: 22.7%
--- 45-64 years old: 33.3%
--- 65+ years old: 26.1%
- Breakdown by race/ethnicity
--- White: 92.2%
--- Black or African American: 3.0%
--- Asian: 0.5%
--- Hispanic or Latino: 1.1%
--- Native American or Alaska Native: data unavailable
--- Native Hawaiian or Pacific Islander: data unavailable
--- Two or more races: 3.8%
- Breakdown by education
--- Less than high school education: 3.0%
--- Some high school (no diploma): 8.1%
--- High school graduate or equivalency: 39.8%
--- Some college (no degree): 19.2%
--- Associate's degree: 7.6%
--- Bachelor's degree: 13.6%
--- Graduate or professional degree: 8.8%

Voters, children, and pets waiting in line inside a polling station in Milwaukee, Wisconsin
50 / 51
The Washington Post // Getty Images

Wisconsin

- Voting-eligible population: 4,480,576
- Breakdown by sex
--- Male: 49.7%
--- Female: 50.3%
- Breakdown by age
--- 18-29 years old: 19.7%
--- 30-44 years old: 23.5%
--- 45-64 years old: 33.4%
--- 65+ years old: 23.4%
- Breakdown by race/ethnicity
--- White: 85.3%
--- Black or African American: 5.5%
--- Asian: 2.1%
--- Hispanic or Latino: 4.6%
--- Native American or Alaska Native: 0.7%
--- Native Hawaiian or Pacific Islander: data unavailable
--- Two or more races: 4.9%
- Breakdown by education
--- Less than high school education: 1.8%
--- Some high school (no diploma): 4.6%
--- High school graduate or equivalency: 30.9%
--- Some college (no degree): 21.6%
--- Associate's degree: 10.8%
--- Bachelor's degree: 20.6%
--- Graduate or professional degree: 9.7%

51 / 51
JASON REDMOND // Getty Images

Wyoming

- Voting-eligible population: 436,049
- Breakdown by sex
--- Male: 50.9%
--- Female: 49.1%
- Breakdown by age
--- 18-29 years old: 19.4%
--- 30-44 years old: 25.4%
--- 45-64 years old: 31.5%
--- 65+ years old: 23.7%
- Breakdown by race/ethnicity
--- White: 87.9%
--- Black or African American: data unavailable
--- Asian: 0.6%
--- Hispanic or Latino: 7.9%
--- Native American or Alaska Native: data unavailable
--- Native Hawaiian or Pacific Islander: data unavailable
--- Two or more races: 6.9%
- Breakdown by education
--- Less than high school education: 1.3%
--- Some high school (no diploma): 5.0%
--- High school graduate or equivalency: 28.4%
--- Some college (no degree): 26.3%
--- Associate's degree: 11.9%
--- Bachelor's degree: 17.5%
--- Graduate or professional degree: 9.5%

Trending Now