10 statistics about each state's real estate market
This story originally appeared on ZeroDown and was produced and distributed in partnership with Stacker Studio.
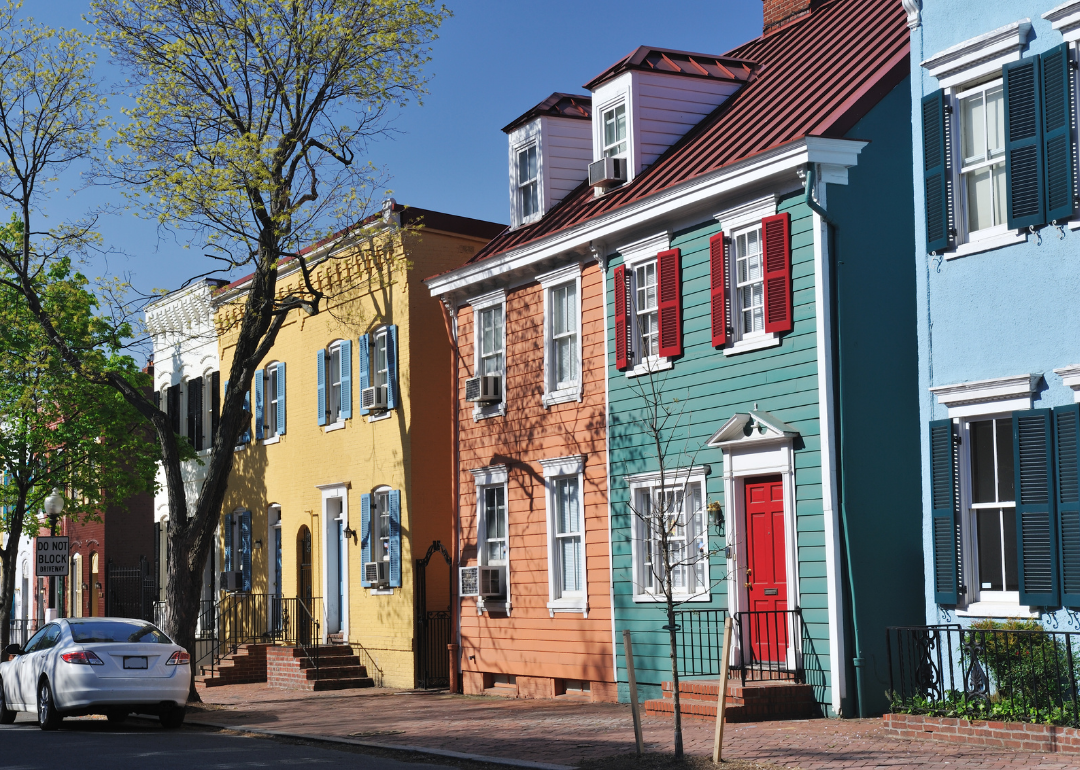
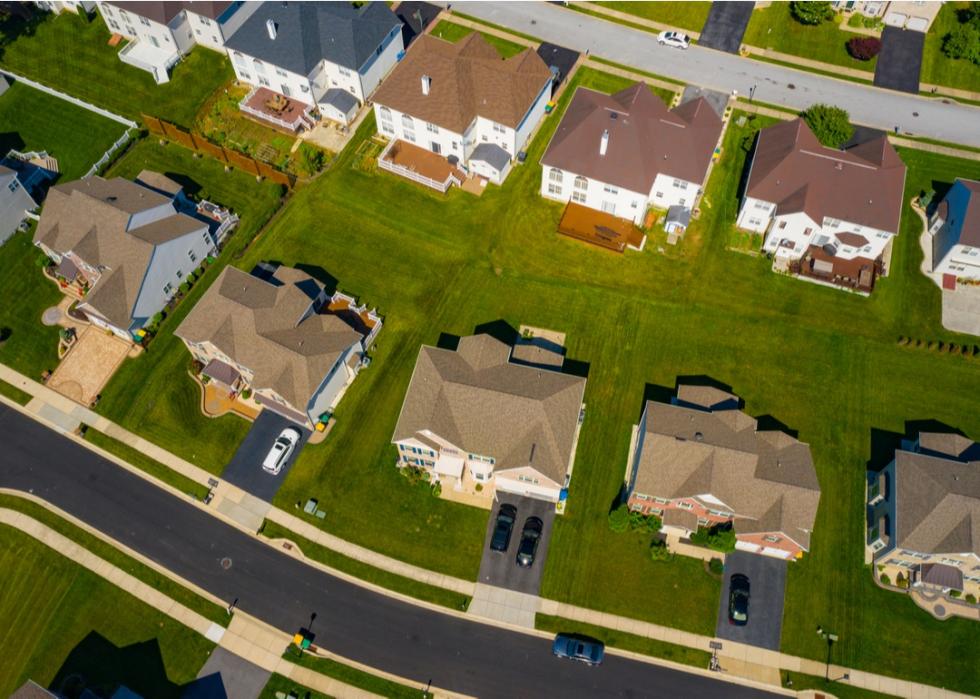
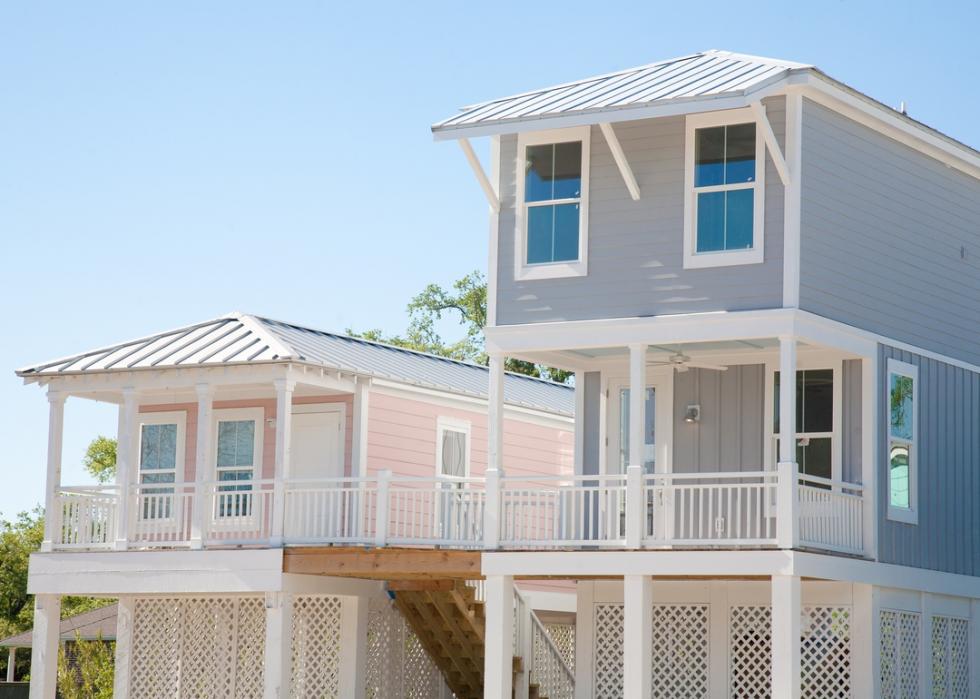
10 statistics about each state's real estate market
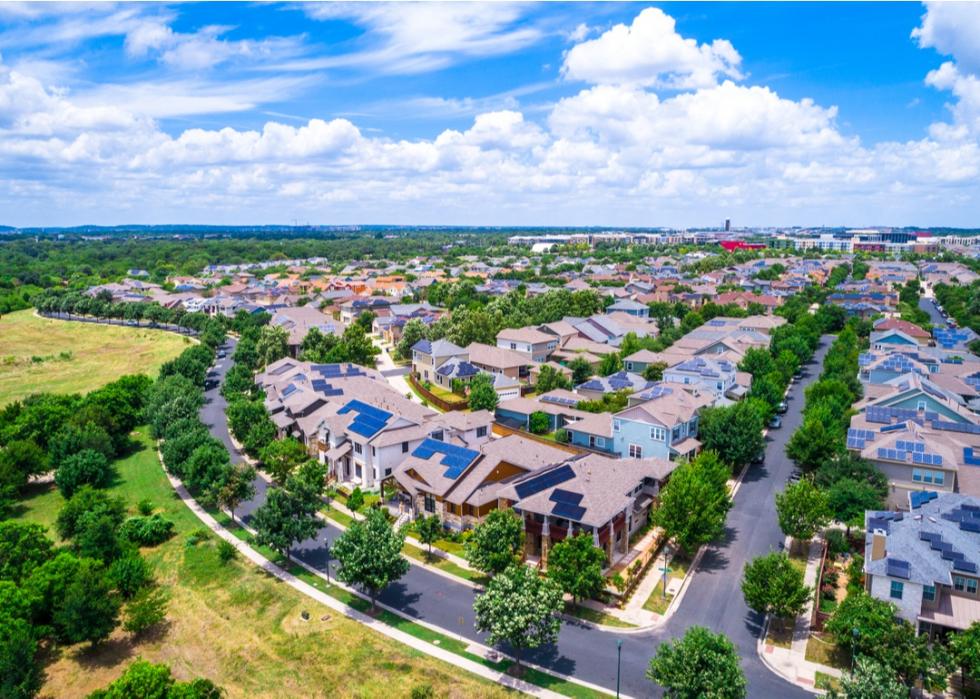
The economy of real estate is both simple and complex. Like with any other commodity, supply and demand determine cost within the housing market, and right now, home costs are at a record high—an increase of 18% since September 2020. But the factors creating record-low inventory and a surge in buying interest are varied and complicated.
To illustrate just how skewed the market is, we can look at the months of supply metric. This measure tells us how many months it would take for all homes on the market to sell at the current rate. In a balanced real estate market, that number is six. Since 2019, the average months of supply have dipped from about four to fewer than two. The number of single-family homes for sale in the U.S. at the beginning of 2021 was just 870,000, the lowest in roughly 40 years, according to a 2021 study by Harvard University.
The COVID-19 pandemic created a world where some people found the financial flexibility to purchase a home—and an incentive to do so quickly. Remote work, shutdowns, and record-low mortgage rates pushed people—particularly those under 35—who may have otherwise delayed home buying to suddenly seek out more space for themselves, their families, and a yard for their pandemic puppies in cheaper neighborhoods away from employment hubs and large metros.
For others, the pandemic created a new reality of financial insecurity, delinquent mortgage or rent payments, risk of eviction, and being priced out of previously affordable neighborhoods. Nearly a quarter of households earning less than $25,000 annually were behind on mortgage payments as of early 2021. In that same time frame, one-fifth of all renters in the U.S. were behind on their monthly payments. Within these overall figures, the burden of the economic fallout due to the pandemic falls disproportionately on low-income and minority families.
Investment firms have found themselves on the favorable side of the pandemic housing crisis, accounting for owning one of out every six homes, and 25% of all apartments purchased in quarter two of 2021. Investors have been able to take advantage of the low interest rates and the demand for rentals, particularly among those who are priced out of the market.
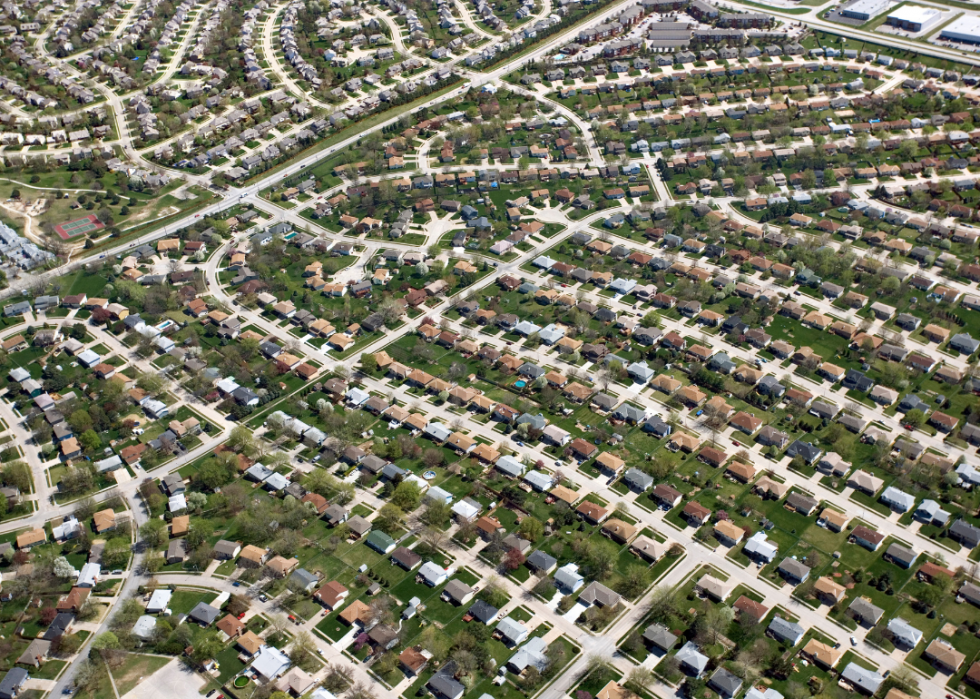
While the pandemic has played a significant role in driving demand for housing, it is only partially to blame for the supply shortage. That problem—which is actually an underproduction problem—began two decades before the world had ever heard of COVID-19.
According to the National Association of Realtors (NAR), the U.S. built 276,000 fewer homes per year, on average, between 2001 and 2020, compared to the 30 years prior. Had the pace of production not dropped over the last 20 years, there would be 5.5 million more homes in existence. The NAR estimates the U.S. would need to construct more than 2 million new units per year over the next decade to close the gap. Under the best circumstances, this pace would be difficult to achieve. Under the actual circumstances—where supply chain disruptions are impacting 88% of construction projects and nearly 90% of construction firms cannot find enough skilled craftsmen to meet demand—it feels like a Sisyphean task.
The real estate market is nuanced from state to state, and while many national trends hold true at a more localized level, it is important to understand the context of your individual state.
To analyze every state’s real estate market, rent-to-own platform ZeroDown compiled current and historical data from the U.S. Census Bureau and the Department of Housing and Urban Development. The data will cover homeownership rates, vacancies, foreclosures, mortgages, new housing construction, and manufacturing, as well as housing characteristics such as the median age, square feet, and the number of rooms for homes in every state.
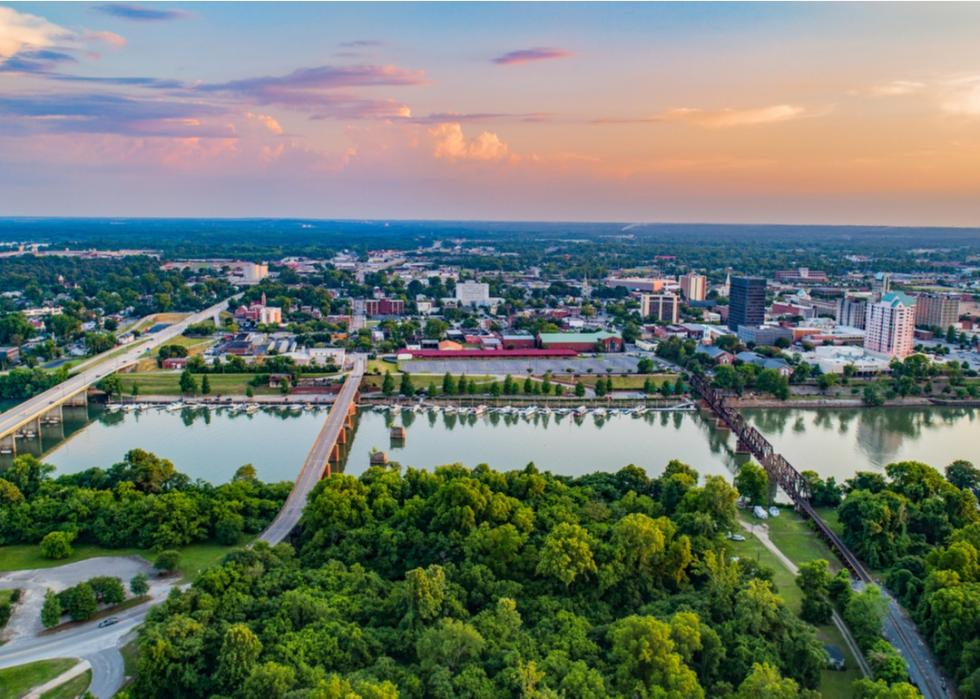
Alabama
- Homeownership rate: 73.3%
- Homeowner vacancy rate: 0.7%
- Rental vacancy rate: 12.5%
- Occupied housing units: 1,897,576
--- Owner-occupied housing units: 1,305,223, renter-occupied housing units: 592,353
--- Year homes were built: 2014 or later (4.9%), 2010 to 2013 (3.7%), 2000 to 2009 (15.3%), 1980 to 1999 (33.2%), 1960 to 1979 (27.1%), 1940 to 1959 (11.4%), 1939 or earlier (4.5%)
--- Number of bedrooms: no bedroom (1.1%), 1 bedroom (6.1%), 2 or 3 bedrooms (70.3%), 4 or more bedrooms (22.5%)
--- Type of heating used: utility gas (26.5%), bottled, tank, or LP gas (5.6%), electricity (66.4%), fuel oil, kerosene, etc. (0.1%), coal or coke (0.0%), all other fuels (0.9%), no fuel used (0.4%)
- New building permits: 19,982 ($4,358,692 value)
- Manufactured homes shipped to state: 3,368 (average sales price: $80,000)
Alaska
- Homeownership rate: 64.1%
- Homeowner vacancy rate: 1.3%
- Rental vacancy rate: 3.8%
- Occupied housing units: 252,199
--- Owner-occupied housing units: 163,272, renter-occupied housing units: 88,927
--- Year homes were built: 2014 or later (3.9%), 2010 to 2013 (2.5%), 2000 to 2009 (15.1%), 1980 to 1999 (38.6%), 1960 to 1979 (31.3%), 1940 to 1959 (6.8%), 1939 or earlier (1.7%)
--- Number of bedrooms: no bedroom (3.7%), 1 bedroom (10.8%), 2 or 3 bedrooms (63.7%), 4 or more bedrooms (21.8%)
--- Type of heating used: utility gas (48.6%), bottled, tank, or LP gas (1.9%), electricity (12.1%), fuel oil, kerosene, etc. (30.8%), coal or coke (0.4%), all other fuels (5.6%), no fuel used (0.5%)
- New building permits: 1,420 ($381,356 value)
- Manufactured homes shipped to state: 7 (average sales price: data not available)
Arizona
- Homeownership rate: 64.1%
- Homeowner vacancy rate: 0.7%
- Rental vacancy rate: 4.7%
- Occupied housing units: 2,670,441
--- Owner-occupied housing units: 1,742,670, renter-occupied housing units: 927,771
--- Year homes were built: 2014 or later (5.3%), 2010 to 2013 (2.9%), 2000 to 2009 (22.7%), 1980 to 1999 (37.2%), 1960 to 1979 (23.8%), 1940 to 1959 (6.8%), 1939 or earlier (1.3%)
--- Number of bedrooms: no bedroom (2.5%), 1 bedroom (10.0%), 2 or 3 bedrooms (63.5%), 4 or more bedrooms (24.0%)
--- Type of heating used: utility gas (32.9%), bottled, tank, or LP gas (2.8%), electricity (60.5%), fuel oil, kerosene, etc. (0.1%), coal or coke (0.0%), all other fuels (2.8%), no fuel used (0.9%)
- New building permits: 60,342 ($13,798,358 value)
- Manufactured homes shipped to state: 1,599 (average sales price: $106,800)
Arkansas
- Homeownership rate: 66.9%
- Homeowner vacancy rate: 1.2%
- Rental vacancy rate: 8.9%
- Occupied housing units: 1,163,647
--- Owner-occupied housing units: 761,809, renter-occupied housing units: 401,838
--- Year homes were built: 2014 or later (5.5%), 2010 to 2013 (4.2%), 2000 to 2009 (16.3%), 1980 to 1999 (32.7%), 1960 to 1979 (27.1%), 1940 to 1959 (9.9%), 1939 or earlier (4.2%)
--- Number of bedrooms: no bedroom (1.7%), 1 bedroom (7.1%), 2 or 3 bedrooms (74.8%), 4 or more bedrooms (16.4%)
--- Type of heating used: utility gas (38.7%), bottled, tank, or LP gas (6.7%), electricity (50.6%), fuel oil, kerosene, etc. (0.1%), coal or coke (0.0%), all other fuels (3.7%), no fuel used (0.3%)
- New building permits: 12,493 ($2,353,746 value)
- Manufactured homes shipped to state: 1,362 (average sales price: $82,100)
California
- Homeownership rate: 54.4%
- Homeowner vacancy rate: 0.6%
- Rental vacancy rate: 4.0%
- Occupied housing units: 13,157,873
--- Owner-occupied housing units: 7,218,742, renter-occupied housing units: 5,939,131
--- Year homes were built: 2014 or later (2.9%), 2010 to 2013 (1.7%), 2000 to 2009 (10.8%), 1980 to 1999 (25.7%), 1960 to 1979 (30.8%), 1940 to 1959 (19.2%), 1939 or earlier (8.9%)
--- Number of bedrooms: no bedroom (4.2%), 1 bedroom (13.3%), 2 or 3 bedrooms (60.4%), 4 or more bedrooms (22.2%)
--- Type of heating used: utility gas (64.4%), bottled, tank, or LP gas (3.2%), electricity (26.6%), fuel oil, kerosene, etc. (0.2%), coal or coke (0.0%), all other fuels (2.5%), no fuel used (3.1%)
- New building permits: 106,075 ($25,423,120 value)
- Manufactured homes shipped to state: 2,243 (average sales price: $118,700)
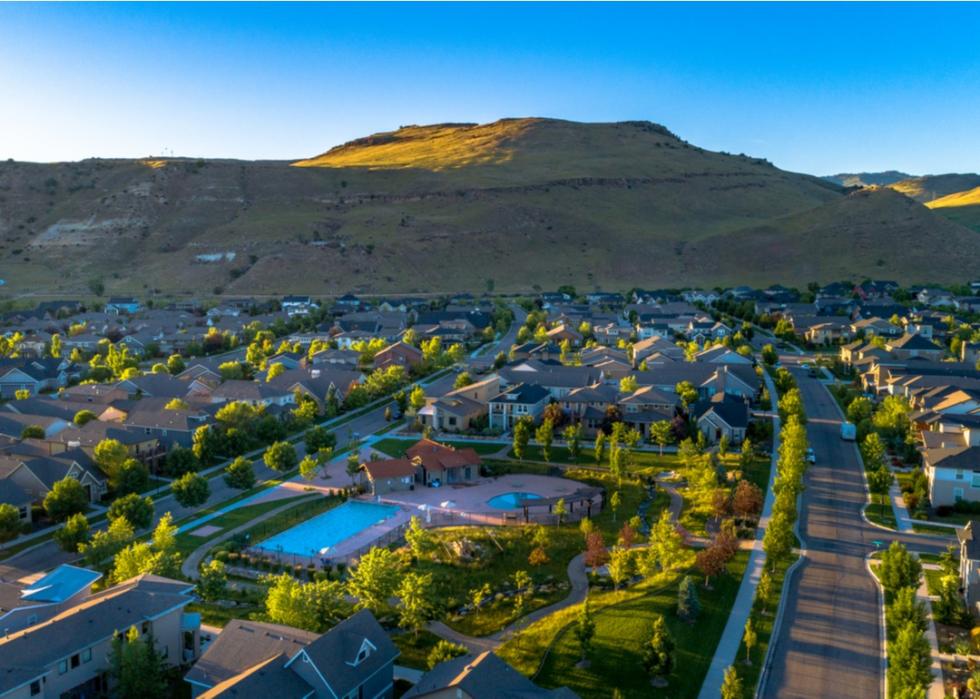
Colorado
- Homeownership rate: 66.1%
- Homeowner vacancy rate: 1.7%
- Rental vacancy rate: 3.9%
- Occupied housing units: 2,235,103
--- Owner-occupied housing units: 1,471,912, renter-occupied housing units: 763,191
--- Year homes were built: 2014 or later (6.9%), 2010 to 2013 (3.1%), 2000 to 2009 (16.5%), 1980 to 1999 (30.2%), 1960 to 1979 (26.1%), 1940 to 1959 (10.1%), 1939 or earlier (7.1%)
--- Number of bedrooms: no bedroom (2.1%), 1 bedroom (11.2%), 2 or 3 bedrooms (56.8%), 4 or more bedrooms (29.9%)
--- Type of heating used: utility gas (68.4%), bottled, tank, or LP gas (4.8%), electricity (23.6%), fuel oil, kerosene, etc. (0.1%), coal or coke (0.0%), all other fuels (2.5%), no fuel used (0.5%)
- New building permits: 40,469 ($10,266,541 value)
- Manufactured homes shipped to state: 641 (average sales price: $88,200)
Connecticut
- Homeownership rate: 64.5%
- Homeowner vacancy rate: 0.4%
- Rental vacancy rate: 4.1%
- Occupied housing units: 1,377,166
--- Owner-occupied housing units: 895,594, renter-occupied housing units: 481,572
--- Year homes were built: 2014 or later (2.2%), 2010 to 2013 (1.4%), 2000 to 2009 (6.7%), 1980 to 1999 (20.6%), 1960 to 1979 (27.2%), 1940 to 1959 (21.7%), 1939 or earlier (20.2%)
--- Number of bedrooms: no bedroom (2.0%), 1 bedroom (12.3%), 2 or 3 bedrooms (62.7%), 4 or more bedrooms (23.0%)
--- Type of heating used: utility gas (36.3%), bottled, tank, or LP gas (4.9%), electricity (17.3%), fuel oil, kerosene, etc. (38.9%), coal or coke (0.0%), all other fuels (2.3%), no fuel used (0.3%)
- New building permits: 5,471 ($1,061,756 value)
- Manufactured homes shipped to state: 105 (average sales price: $82,000)
Delaware
- Homeownership rate: 72.3%
- Homeowner vacancy rate: 0.4%
- Rental vacancy rate: 3.0%
- Occupied housing units: 376,239
--- Owner-occupied housing units: 264,503, renter-occupied housing units: 111,736
--- Year homes were built: 2014 or later (6.0%), 2010 to 2013 (4.0%), 2000 to 2009 (15.5%), 1980 to 1999 (28.2%), 1960 to 1979 (21.8%), 1940 to 1959 (15.5%), 1939 or earlier (8.9%)
--- Number of bedrooms: no bedroom (1.1%), 1 bedroom (7.5%), 2 or 3 bedrooms (65.3%), 4 or more bedrooms (26.1%)
--- Type of heating used: utility gas (42.4%), bottled, tank, or LP gas (10.1%), electricity (35.1%), fuel oil, kerosene, etc. (10.2%), coal or coke (0.1%), all other fuels (1.7%), no fuel used (0.4%)
- New building permits: 8,455 ($1,099,377 value)
- Manufactured homes shipped to state: 294 (average sales price: $93,800)
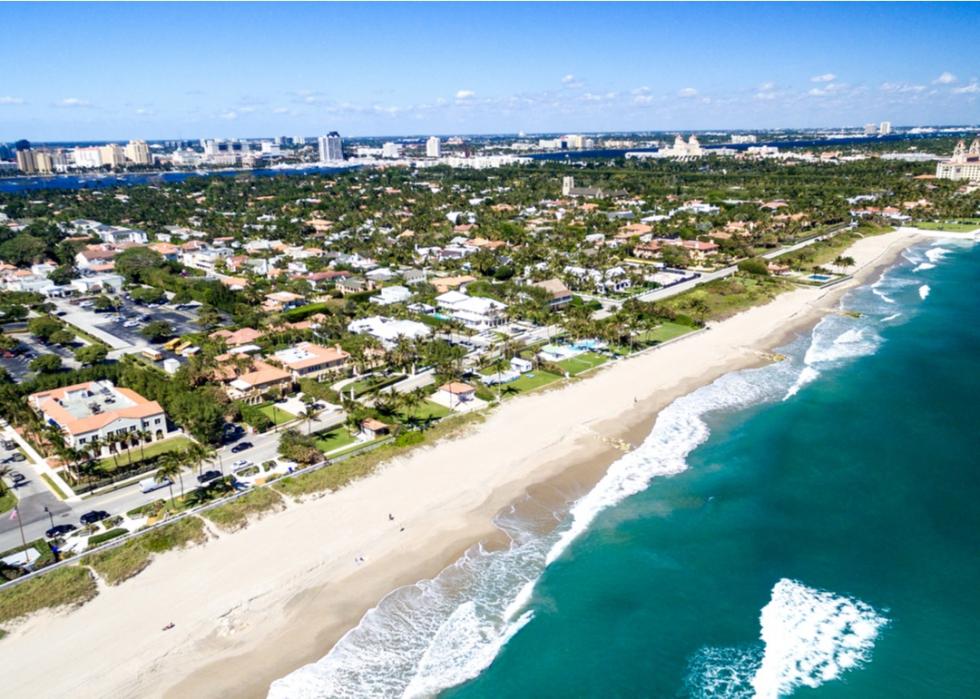
Florida
- Homeownership rate: 67.1%
- Homeowner vacancy rate: 1.0%
- Rental vacancy rate: 5.9%
- Occupied housing units: 7,905,832
--- Owner-occupied housing units: 5,237,519, renter-occupied housing units: 2,668,313
--- Year homes were built: 2014 or later (5.7%), 2010 to 2013 (2.7%), 2000 to 2009 (18.2%), 1980 to 1999 (36.9%), 1960 to 1979 (25.4%), 1940 to 1959 (9.1%), 1939 or earlier (2.0%)
--- Number of bedrooms: no bedroom (1.9%), 1 bedroom (9.4%), 2 or 3 bedrooms (70.1%), 4 or more bedrooms (18.5%)
--- Type of heating used: utility gas (4.7%), bottled, tank, or LP gas (0.8%), electricity (92.1%), fuel oil, kerosene, etc. (0.1%), coal or coke (0.0%), all other fuels (0.4%), no fuel used (1.9%)
- New building permits: 164,074 ($36,884,176 value)
- Manufactured homes shipped to state: 4,863 (average sales price: $89,200)
Georgia
- Homeownership rate: 62.8%
- Homeowner vacancy rate: 0.8%
- Rental vacancy rate: 6.4%
- Occupied housing units: 3,852,714
--- Owner-occupied housing units: 2,470,572, renter-occupied housing units: 1,382,142
--- Year homes were built: 2014 or later (6.0%), 2010 to 2013 (2.9%), 2000 to 2009 (20.5%), 1980 to 1999 (37.3%), 1960 to 1979 (21.6%), 1940 to 1959 (8.0%), 1939 or earlier (3.7%)
--- Number of bedrooms: no bedroom (1.4%), 1 bedroom (7.4%), 2 or 3 bedrooms (62.4%), 4 or more bedrooms (28.8%)
--- Type of heating used: utility gas (38.6%), bottled, tank, or LP gas (4.5%), electricity (55.6%), fuel oil, kerosene, etc. (0.1%), coal or coke (0.0%), all other fuels (0.7%), no fuel used (0.5%)
- New building permits: 55,827 ($11,592,571 value)
- Manufactured homes shipped to state: 2,753 (average sales price: $83,500)
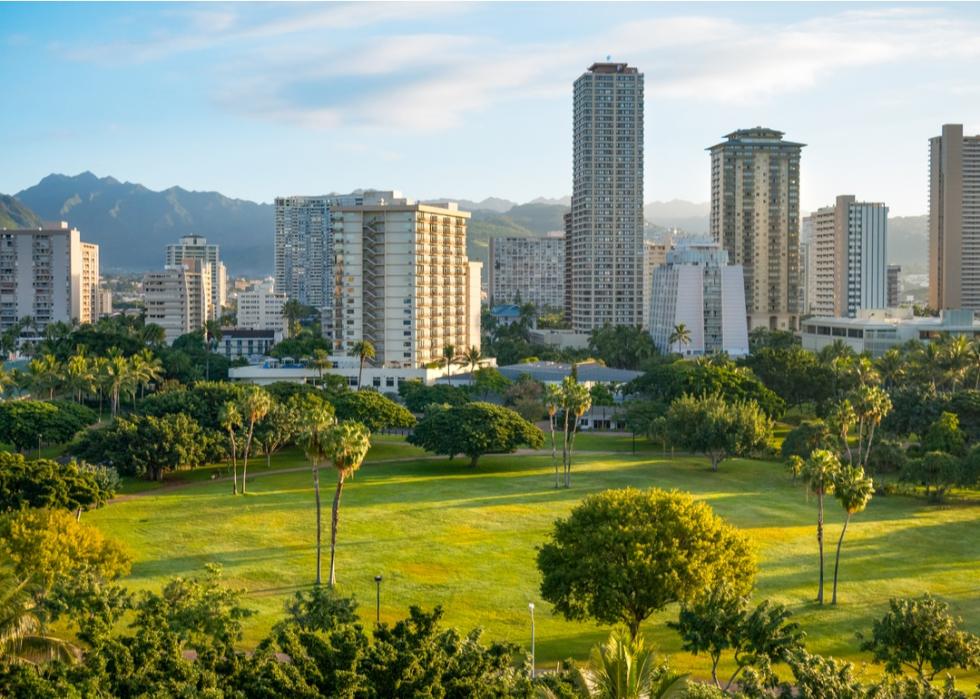
Hawaii
- Homeownership rate: 56.6%
- Homeowner vacancy rate: 0.7%
- Rental vacancy rate: 4.7%
- Occupied housing units: 465,299
--- Owner-occupied housing units: 279,960, renter-occupied housing units: 185,339
--- Year homes were built: 2014 or later (3.6%), 2010 to 2013 (2.9%), 2000 to 2009 (11.6%), 1980 to 1999 (27.8%), 1960 to 1979 (38.4%), 1940 to 1959 (12.4%), 1939 or earlier (3.3%)
--- Number of bedrooms: no bedroom (5.4%), 1 bedroom (10.3%), 2 or 3 bedrooms (62.2%), 4 or more bedrooms (22.1%)
--- Type of heating used: utility gas (2.1%), bottled, tank, or LP gas (1.5%), electricity (33.7%), fuel oil, kerosene, etc. (0.1%), coal or coke (0.1%), all other fuels (3.9%), no fuel used (58.6%)
- New building permits: 3,164 ($1,169,770 value)
- Manufactured homes shipped to state: 3 (average sales price: data not available)
Idaho
- Homeownership rate: 71.4%
- Homeowner vacancy rate: 1.0%
- Rental vacancy rate: 3.4%
- Occupied housing units: 655,859
--- Owner-occupied housing units: 469,387, renter-occupied housing units: 186,472
--- Year homes were built: 2014 or later (8.0%), 2010 to 2013 (3.3%), 2000 to 2009 (19.8%), 1980 to 1999 (27.8%), 1960 to 1979 (23.3%), 1940 to 1959 (9.4%), 1939 or earlier (8.4%)
--- Number of bedrooms: no bedroom (1.5%), 1 bedroom (5.7%), 2 or 3 bedrooms (62.9%), 4 or more bedrooms (29.9%)
--- Type of heating used: utility gas (50.9%), bottled, tank, or LP gas (5.2%), electricity (34.4%), fuel oil, kerosene, etc. (1.5%), coal or coke (0.0%), all other fuels (7.6%), no fuel used (0.3%)
- New building permits: 19,130 ($3,948,590 value)
- Manufactured homes shipped to state: 376 (average sales price: $108,900)
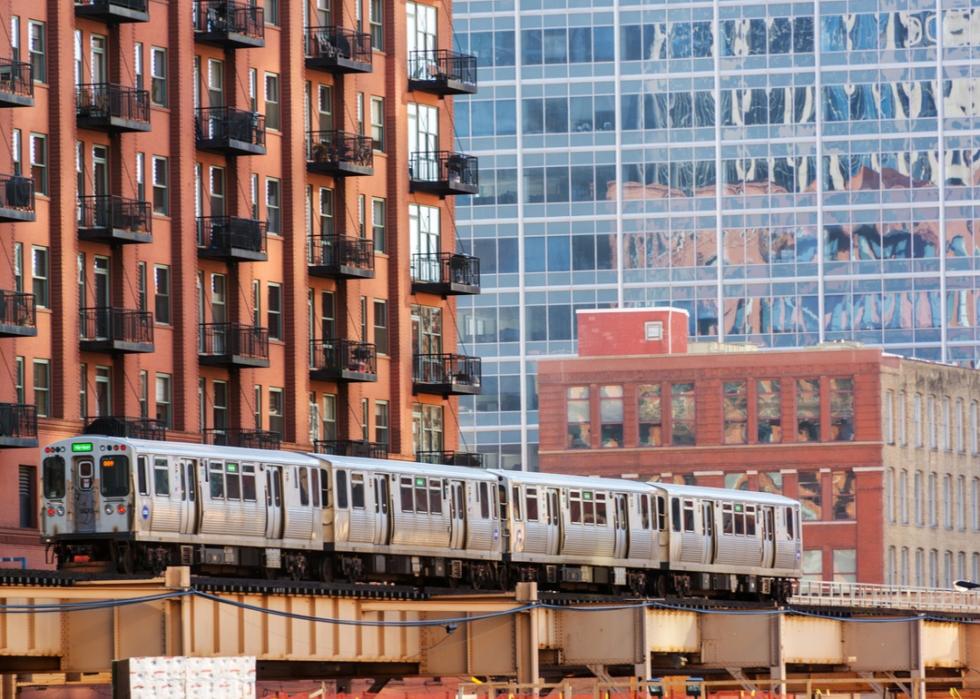
Illinois
- Homeownership rate: 68.7%
- Homeowner vacancy rate: 1.1%
- Rental vacancy rate: 8.8%
- Occupied housing units: 4,866,006
--- Owner-occupied housing units: 3,211,867, renter-occupied housing units: 1,654,139
--- Year homes were built: 2014 or later (2.1%), 2010 to 2013 (1.4%), 2000 to 2009 (10.9%), 1980 to 1999 (20.7%), 1960 to 1979 (26.5%), 1940 to 1959 (18.1%), 1939 or earlier (20.3%)
--- Number of bedrooms: no bedroom (2.5%), 1 bedroom (11.2%), 2 or 3 bedrooms (64.6%), 4 or more bedrooms (21.8%)
--- Type of heating used: utility gas (77.1%), bottled, tank, or LP gas (4.2%), electricity (17.0%), fuel oil, kerosene, etc. (0.1%), coal or coke (0.0%), all other fuels (0.9%), no fuel used (0.6%)
- New building permits: 18,058 ($3,646,298 value)
- Manufactured homes shipped to state: 855 (average sales price: $80,700)
Indiana
- Homeownership rate: 73.9%
- Homeowner vacancy rate: 0.8%
- Rental vacancy rate: 6.4%
- Occupied housing units: 2,597,765
--- Owner-occupied housing units: 1,800,483, renter-occupied housing units: 797,282
--- Year homes were built: 2014 or later (3.9%), 2010 to 2013 (2.4%), 2000 to 2009 (11.9%), 1980 to 1999 (25.2%), 1960 to 1979 (24.4%), 1940 to 1959 (16.3%), 1939 or earlier (15.9%)
--- Number of bedrooms: no bedroom (1.3%), 1 bedroom (8.6%), 2 or 3 bedrooms (68.7%), 4 or more bedrooms (21.4%)
--- Type of heating used: utility gas (59.8%), bottled, tank, or LP gas (7.1%), electricity (29.7%), fuel oil, kerosene, etc. (0.6%), coal or coke (0.1%), all other fuels (2.2%), no fuel used (0.4%)
- New building permits: 24,919 ($5,872,298 value)
- Manufactured homes shipped to state: 1,169 (average sales price: $71,100)
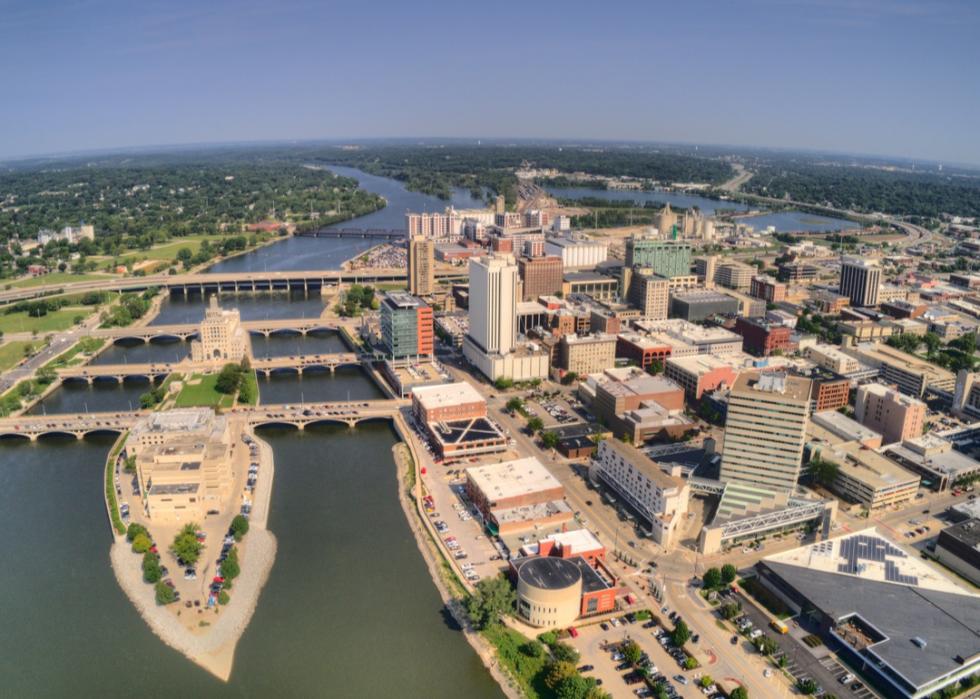
Iowa
- Homeownership rate: 73.4%
- Homeowner vacancy rate: 0.8%
- Rental vacancy rate: 5.7%
- Occupied housing units: 1,287,221
--- Owner-occupied housing units: 907,880, renter-occupied housing units: 379,341
--- Year homes were built: 2014 or later (4.7%), 2010 to 2013 (3.0%), 2000 to 2009 (11.0%), 1980 to 1999 (18.1%), 1960 to 1979 (23.9%), 1940 to 1959 (15.0%), 1939 or earlier (24.3%)
--- Number of bedrooms: no bedroom (1.6%), 1 bedroom (8.5%), 2 or 3 bedrooms (65.8%), 4 or more bedrooms (24.0%)
--- Type of heating used: utility gas (60.6%), bottled, tank, or LP gas (12.9%), electricity (23.7%), fuel oil, kerosene, etc. (0.4%), coal or coke (0.0%), all other fuels (1.9%), no fuel used (0.5%)
- New building permits: 12,623 ($2,701,682 value)
- Manufactured homes shipped to state: 464 (average sales price: $73,100)
Kansas
- Homeownership rate: 68.5%
- Homeowner vacancy rate: 1.0%
- Rental vacancy rate: 7.1%
- Occupied housing units: 1,138,329
--- Owner-occupied housing units: 756,566, renter-occupied housing units: 381,763
--- Year homes were built: 2014 or later (4.0%), 2010 to 2013 (2.6%), 2000 to 2009 (11.0%), 1980 to 1999 (24.9%), 1960 to 1979 (25.3%), 1940 to 1959 (17.3%), 1939 or earlier (15.0%)
--- Number of bedrooms: no bedroom (1.6%), 1 bedroom (8.4%), 2 or 3 bedrooms (62.4%), 4 or more bedrooms (27.5%)
--- Type of heating used: utility gas (64.3%), bottled, tank, or LP gas (8.0%), electricity (25.5%), fuel oil, kerosene, etc. (0.2%), coal or coke (0.0%), all other fuels (1.8%), no fuel used (0.2%)
- New building permits: 8,211 ($1,991,033 value)
- Manufactured homes shipped to state: 482 (average sales price: $62,500)
Kentucky
- Homeownership rate: 74.5%
- Homeowner vacancy rate: 1.2%
- Rental vacancy rate: 5.5%
- Occupied housing units: 1,748,732
--- Owner-occupied housing units: 1,171,824, renter-occupied housing units: 576,908
--- Year homes were built: 2014 or later (4.1%), 2010 to 2013 (3.0%), 2000 to 2009 (13.9%), 1980 to 1999 (29.5%), 1960 to 1979 (26.7%), 1940 to 1959 (13.3%), 1939 or earlier (9.4%)
--- Number of bedrooms: no bedroom (1.4%), 1 bedroom (8.0%), 2 or 3 bedrooms (70.1%), 4 or more bedrooms (20.5%)
--- Type of heating used: utility gas (36.9%), bottled, tank, or LP gas (6.2%), electricity (52.7%), fuel oil, kerosene, etc. (0.7%), coal or coke (0.1%), all other fuels (3.1%), no fuel used (0.3%)
- New building permits: 11,281 ($2,142,572 value)
- Manufactured homes shipped to state: 2,650 (average sales price: $80,900)

Louisiana
- Homeownership rate: 66.6%
- Homeowner vacancy rate: 1.1%
- Rental vacancy rate: 7.3%
- Occupied housing units: 1,741,076
--- Owner-occupied housing units: 1,157,652, renter-occupied housing units: 583,424
--- Year homes were built: 2014 or later (4.9%), 2010 to 2013 (3.9%), 2000 to 2009 (14.8%), 1980 to 1999 (27.8%), 1960 to 1979 (30.3%), 1940 to 1959 (12.6%), 1939 or earlier (5.6%)
--- Number of bedrooms: no bedroom (1.4%), 1 bedroom (7.7%), 2 or 3 bedrooms (71.9%), 4 or more bedrooms (19.0%)
--- Type of heating used: utility gas (33.3%), bottled, tank, or LP gas (1.8%), electricity (64.0%), fuel oil, kerosene, etc. (0.0%), coal or coke (0.0%), all other fuels (0.5%), no fuel used (0.4%)
- New building permits: 17,283 ($3,427,774 value)
- Manufactured homes shipped to state: 3,708 (average sales price: $77,700)

Maine
- Homeownership rate: 75.7%
- Homeowner vacancy rate: 0.8%
- Rental vacancy rate: 2.6%
- Occupied housing units: 573,618
--- Owner-occupied housing units: 414,119, renter-occupied housing units: 159,499
--- Year homes were built: 2014 or later (3.0%), 2010 to 2013 (2.2%), 2000 to 2009 (11.6%), 1980 to 1999 (27.8%), 1960 to 1979 (20.4%), 1940 to 1959 (11.9%), 1939 or earlier (23.2%)
--- Number of bedrooms: no bedroom (1.8%), 1 bedroom (10.7%), 2 or 3 bedrooms (69.0%), 4 or more bedrooms (18.5%)
--- Type of heating used: utility gas (7.8%), bottled, tank, or LP gas (12.1%), electricity (8.4%), fuel oil, kerosene, etc. (60.1%), coal or coke (0.2%), all other fuels (11.1%), no fuel used (0.4%)
- New building permits: 5,304 ($1,194,138 value)
- Manufactured homes shipped to state: 496 (average sales price: $86,500)
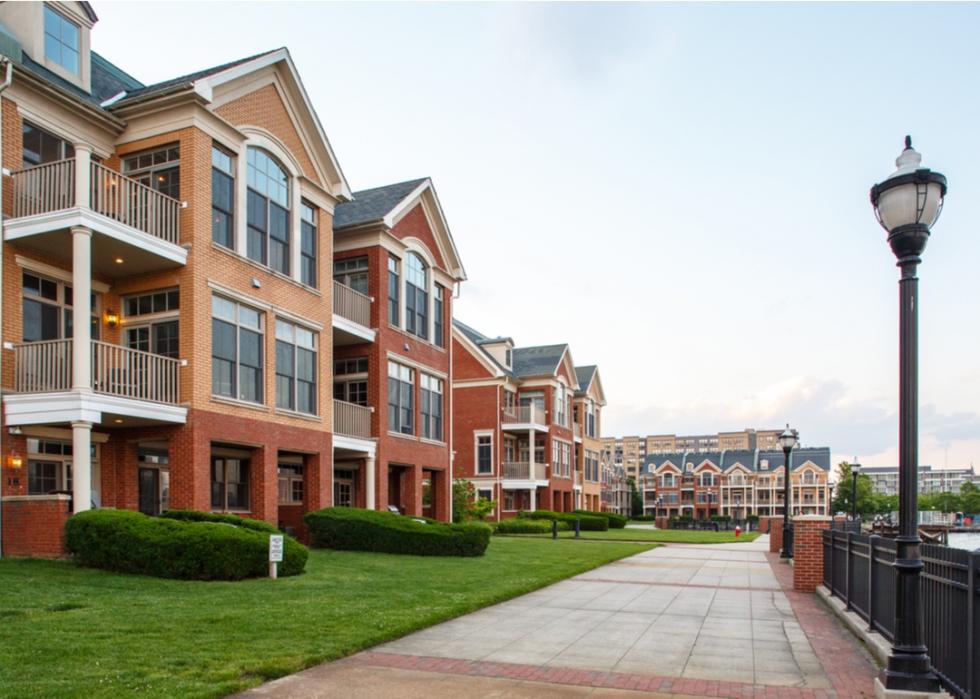
Maryland
- Homeownership rate: 70.7%
- Homeowner vacancy rate: 1.2%
- Rental vacancy rate: 6.2%
- Occupied housing units: 2,226,767
--- Owner-occupied housing units: 1,488,168, renter-occupied housing units: 738,599
--- Year homes were built: 2014 or later (4.2%), 2010 to 2013 (2.4%), 2000 to 2009 (11.2%), 1980 to 1999 (30.2%), 1960 to 1979 (25.2%), 1940 to 1959 (16.7%), 1939 or earlier (10.0%)
--- Number of bedrooms: no bedroom (1.9%), 1 bedroom (9.9%), 2 or 3 bedrooms (56.9%), 4 or more bedrooms (31.3%)
--- Type of heating used: utility gas (43.9%), bottled, tank, or LP gas (3.5%), electricity (42.2%), fuel oil, kerosene, etc. (7.9%), coal or coke (0.1%), all other fuels (1.9%), no fuel used (0.5%)
- New building permits: 17,982 ($3,853,541 value)
- Manufactured homes shipped to state: 75 (average sales price: $114,700)

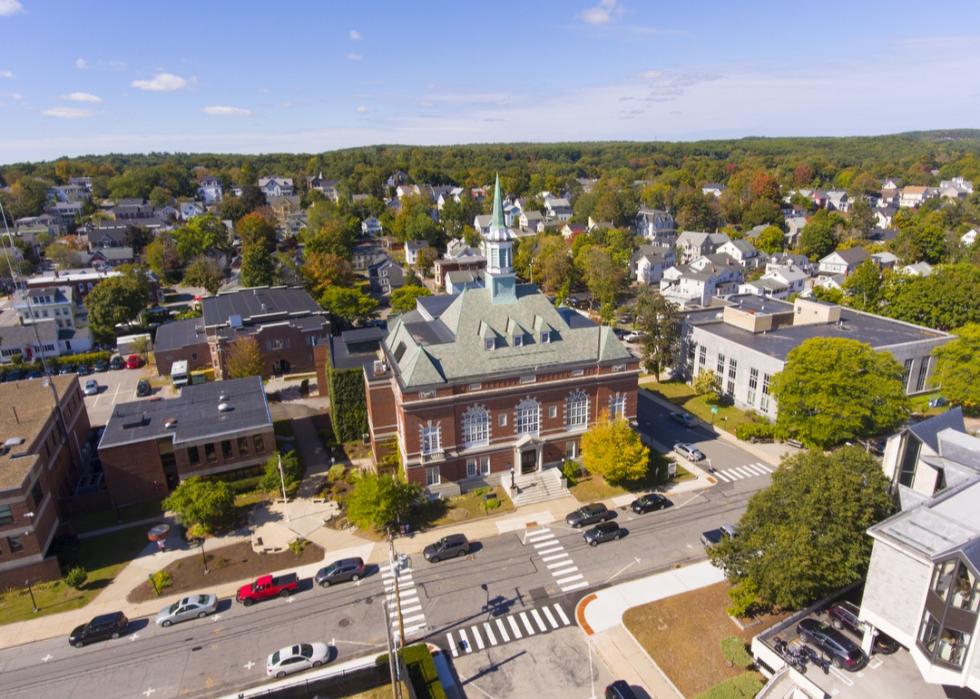
Massachusetts
- Homeownership rate: 61.4%
- Homeowner vacancy rate: 0.8%
- Rental vacancy rate: 2.1%
- Occupied housing units: 2,650,680
--- Owner-occupied housing units: 1,647,747, renter-occupied housing units: 1,002,933
--- Year homes were built: 2014 or later (3.0%), 2010 to 2013 (1.7%), 2000 to 2009 (6.9%), 1980 to 1999 (18.4%), 1960 to 1979 (22.2%), 1940 to 1959 (16.7%), 1939 or earlier (31.1%)
--- Number of bedrooms: no bedroom (2.4%), 1 bedroom (14.1%), 2 or 3 bedrooms (62.3%), 4 or more bedrooms (21.3%)
--- Type of heating used: utility gas (52.3%), bottled, tank, or LP gas (3.7%), electricity (16.9%), fuel oil, kerosene, etc. (24.4%), coal or coke (0.1%), all other fuels (2.2%), no fuel used (0.5%)
- New building permits: 17,025 ($4,761,486 value)
- Manufactured homes shipped to state: 115 (average sales price: $155,100)
Michigan
- Homeownership rate: 74.3%
- Homeowner vacancy rate: 0.6%
- Rental vacancy rate: 5.6%
- Occupied housing units: 3,969,880
--- Owner-occupied housing units: 2,841,195, renter-occupied housing units: 1,128,685
--- Year homes were built: 2014 or later (2.6%), 2010 to 2013 (1.2%), 2000 to 2009 (9.9%), 1980 to 1999 (23.2%), 1960 to 1979 (27.5%), 1940 to 1959 (21.7%), 1939 or earlier (13.8%)
--- Number of bedrooms: no bedroom (1.3%), 1 bedroom (8.3%), 2 or 3 bedrooms (68.8%), 4 or more bedrooms (21.7%)
--- Type of heating used: utility gas (76.4%), bottled, tank, or LP gas (8.4%), electricity (10.2%), fuel oil, kerosene, etc. (1.0%), coal or coke (0.0%), all other fuels (3.6%), no fuel used (0.4%)
- New building permits: 19,735 ($4,579,658 value)
- Manufactured homes shipped to state: 2,697 (average sales price: $77,300)

Minnesota
- Homeownership rate: 75.0%
- Homeowner vacancy rate: 0.7%
- Rental vacancy rate: 5.0%
- Occupied housing units: 2,222,568
--- Owner-occupied housing units: 1,598,396, renter-occupied housing units: 624,172
--- Year homes were built: 2014 or later (4.2%), 2010 to 2013 (2.3%), 2000 to 2009 (12.9%), 1980 to 1999 (26.6%), 1960 to 1979 (24.1%), 1940 to 1959 (14.0%), 1939 or earlier (15.8%)
--- Number of bedrooms: no bedroom (2.1%), 1 bedroom (11.2%), 2 or 3 bedrooms (57.0%), 4 or more bedrooms (29.7%)
--- Type of heating used: utility gas (66.2%), bottled, tank, or LP gas (11.2%), electricity (17.3%), fuel oil, kerosene, etc. (1.5%), coal or coke (0.0%), all other fuels (3.0%), no fuel used (0.7%)
- New building permits: 28,148 ($6,179,311 value)
- Manufactured homes shipped to state: 630 (average sales price: $81,300)
Mississippi
- Homeownership rate: 71.8%
- Homeowner vacancy rate: 1.2%
- Rental vacancy rate: 9.3%
- Occupied housing units: 1,100,229
--- Owner-occupied housing units: 740,651, renter-occupied housing units: 359,578
--- Year homes were built: 2014 or later (4.3%), 2010 to 2013 (3.1%), 2000 to 2009 (16.5%), 1980 to 1999 (32.9%), 1960 to 1979 (29.1%), 1940 to 1959 (9.8%), 1939 or earlier (4.3%)
--- Number of bedrooms: no bedroom (1.4%), 1 bedroom (5.2%), 2 or 3 bedrooms (74.2%), 4 or more bedrooms (19.2%)
--- Type of heating used: utility gas (28.9%), bottled, tank, or LP gas (11.4%), electricity (58.0%), fuel oil, kerosene, etc. (0.1%), coal or coke (0.0%), all other fuels (1.3%), no fuel used (0.3%)
- New building permits: 7,810 ($1,428,531 value)
- Manufactured homes shipped to state: 2,906 (average sales price: $78,200)
Missouri
- Homeownership rate: 72.2%
- Homeowner vacancy rate: 0.7%
- Rental vacancy rate: 6.9%
- Occupied housing units: 2,458,337
--- Owner-occupied housing units: 1,650,019, renter-occupied housing units: 808,318
--- Year homes were built: 2014 or later (3.7%), 2010 to 2013 (2.5%), 2000 to 2009 (12.8%), 1980 to 1999 (26.7%), 1960 to 1979 (26.6%), 1940 to 1959 (14.5%), 1939 or earlier (13.2%)
--- Number of bedrooms: no bedroom (1.5%), 1 bedroom (9.0%), 2 or 3 bedrooms (67.8%), 4 or more bedrooms (21.6%)
--- Type of heating used: utility gas (49.9%), bottled, tank, or LP gas (9.0%), electricity (37.1%), fuel oil, kerosene, etc. (0.2%), coal or coke (0.0%), all other fuels (3.4%), no fuel used (0.3%)
- New building permits: 19,839 ($4,021,896 value)
- Manufactured homes shipped to state: 1,084 (average sales price: $79,400)
Montana
- Homeownership rate: 67.8%
- Homeowner vacancy rate: 1.1%
- Rental vacancy rate: 3.8%
- Occupied housing units: 437,651
--- Owner-occupied housing units: 301,456, renter-occupied housing units: 136,195
--- Year homes were built: 2014 or later (5.5%), 2010 to 2013 (3.5%), 2000 to 2009 (14.7%), 1980 to 1999 (24.9%), 1960 to 1979 (26.2%), 1940 to 1959 (12.6%), 1939 or earlier (12.7%)
--- Number of bedrooms: no bedroom (1.9%), 1 bedroom (8.7%), 2 or 3 bedrooms (64.5%), 4 or more bedrooms (24.9%)
--- Type of heating used: utility gas (51.5%), bottled, tank, or LP gas (13.5%), electricity (26.2%), fuel oil, kerosene, etc. (0.9%), coal or coke (0.1%), all other fuels (7.6%), no fuel used (0.2%)
- New building permits: 5,980 ($1,051,886 value)
- Manufactured homes shipped to state: 254 (average sales price: $108,400)
Nebraska
- Homeownership rate: 70.3%
- Homeowner vacancy rate: 1.2%
- Rental vacancy rate: 7.7%
- Occupied housing units: 771,444
--- Owner-occupied housing units: 511,370, renter-occupied housing units: 260,074
--- Year homes were built: 2014 or later (4.8%), 2010 to 2013 (3.0%), 2000 to 2009 (11.3%), 1980 to 1999 (21.1%), 1960 to 1979 (26.6%), 1940 to 1959 (14.4%), 1939 or earlier (18.8%)
--- Number of bedrooms: no bedroom (1.6%), 1 bedroom (10.3%), 2 or 3 bedrooms (61.7%), 4 or more bedrooms (26.5%)
--- Type of heating used: utility gas (59.2%), bottled, tank, or LP gas (7.4%), electricity (30.6%), fuel oil, kerosene, etc. (0.4%), coal or coke (0.0%), all other fuels (1.9%), no fuel used (0.5%)
- New building permits: 9,483 ($1,643,788 value)
- Manufactured homes shipped to state: 167 (average sales price: $65,600)
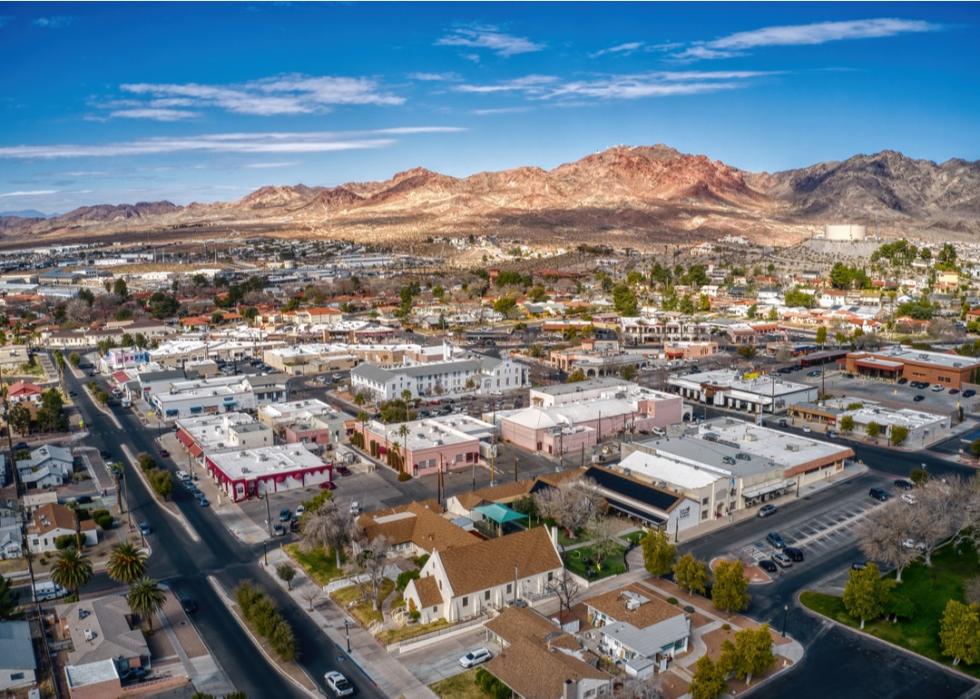
Nevada
- Homeownership rate: 61.7%
- Homeowner vacancy rate: 0.6%
- Rental vacancy rate: 4.8%
- Occupied housing units: 1,143,557
--- Owner-occupied housing units: 647,518, renter-occupied housing units: 496,039
--- Year homes were built: 2014 or later (5.9%), 2010 to 2013 (3.5%), 2000 to 2009 (25.5%), 1980 to 1999 (41.2%), 1960 to 1979 (18.8%), 1940 to 1959 (4.0%), 1939 or earlier (1.0%)
--- Number of bedrooms: no bedroom (2.7%), 1 bedroom (9.2%), 2 or 3 bedrooms (64.1%), 4 or more bedrooms (24.0%)
--- Type of heating used: utility gas (58.1%), bottled, tank, or LP gas (2.6%), electricity (36.1%), fuel oil, kerosene, etc. (0.5%), coal or coke (0.0%), all other fuels (2.1%), no fuel used (0.5%)
- New building permits: 19,716 ($4,057,456 value)
- Manufactured homes shipped to state: 391 (average sales price: $104,200)
New Hampshire
- Homeownership rate: 71.8%
- Homeowner vacancy rate: 0.8%
- Rental vacancy rate: 2.5%
- Occupied housing units: 541,396
--- Owner-occupied housing units: 384,166, renter-occupied housing units: 157,230
--- Year homes were built: 2014 or later (2.8%), 2010 to 2013 (2.2%), 2000 to 2009 (11.4%), 1980 to 1999 (30.3%), 1960 to 1979 (22.3%), 1940 to 1959 (10.0%), 1939 or earlier (21.0%)
--- Number of bedrooms: no bedroom (2.0%), 1 bedroom (10.8%), 2 or 3 bedrooms (67.8%), 4 or more bedrooms (19.4%)
--- Type of heating used: utility gas (21.3%), bottled, tank, or LP gas (17.4%), electricity (9.9%), fuel oil, kerosene, etc. (42.1%), coal or coke (0.1%), all other fuels (8.2%), no fuel used (1.0%)
- New building permits: 4,320 ($1,059,391 value)
- Manufactured homes shipped to state: 225 (average sales price: $89,900)
New Jersey
- Homeownership rate: 61.9%
- Homeowner vacancy rate: 1.0%
- Rental vacancy rate: 3.1%
- Occupied housing units: 3,286,264
--- Owner-occupied housing units: 2,081,798, renter-occupied housing units: 1,204,466
--- Year homes were built: 2014 or later (2.7%), 2010 to 2013 (1.7%), 2000 to 2009 (8.8%), 1980 to 1999 (21.8%), 1960 to 1979 (25.7%), 1940 to 1959 (21.6%), 1939 or earlier (17.7%)
--- Number of bedrooms: no bedroom (2.9%), 1 bedroom (13.9%), 2 or 3 bedrooms (57.4%), 4 or more bedrooms (25.7%)
--- Type of heating used: utility gas (75.3%), bottled, tank, or LP gas (2.2%), electricity (13.6%), fuel oil, kerosene, etc. (7.4%), coal or coke (0.0%), all other fuels (0.9%), no fuel used (0.6%)
- New building permits: 36,146 ($4,796,438 value)
- Manufactured homes shipped to state: 276 (average sales price: $88,800)
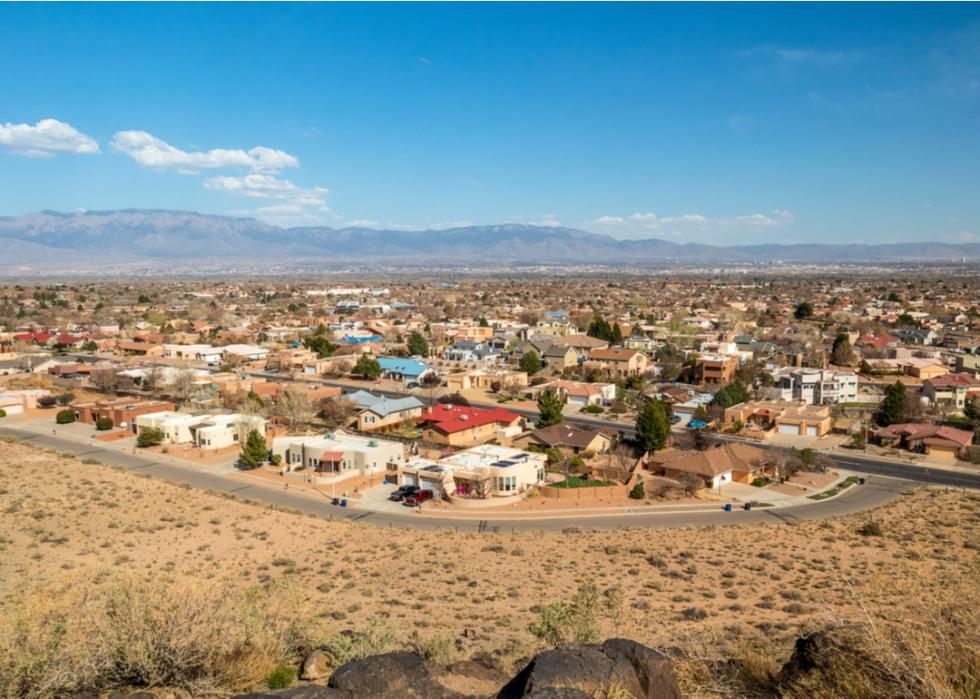
New Mexico
- Homeownership rate: 68.5%
- Homeowner vacancy rate: 1.5%
- Rental vacancy rate: 5.5%
- Occupied housing units: 793,420
--- Owner-occupied housing units: 540,052, renter-occupied housing units: 253,368
--- Year homes were built: 2014 or later (3.2%), 2010 to 2013 (2.9%), 2000 to 2009 (15.0%), 1980 to 1999 (34.9%), 1960 to 1979 (26.3%), 1940 to 1959 (13.7%), 1939 or earlier (4.1%)
--- Number of bedrooms: no bedroom (2.0%), 1 bedroom (7.6%), 2 or 3 bedrooms (72.0%), 4 or more bedrooms (18.4%)
--- Type of heating used: utility gas (61.8%), bottled, tank, or LP gas (6.2%), electricity (22.6%), fuel oil, kerosene, etc. (0.2%), coal or coke (0.1%), all other fuels (8.8%), no fuel used (0.3%)
- New building permits: 5,219 ($1,225,981 value)
- Manufactured homes shipped to state: 976 (average sales price: $88,900)

New York
- Homeownership rate: 54.0%
- Homeowner vacancy rate: 1.8%
- Rental vacancy rate: 5.1%
- Occupied housing units: 7,446,812
--- Owner-occupied housing units: 3,985,516, renter-occupied housing units: 3,461,296
--- Year homes were built: 2014 or later (2.0%), 2010 to 2013 (1.6%), 2000 to 2009 (5.9%), 1980 to 1999 (13.5%), 1960 to 1979 (23.2%), 1940 to 1959 (23.5%), 1939 or earlier (30.3%)
--- Number of bedrooms: no bedroom (4.6%), 1 bedroom (18.4%), 2 or 3 bedrooms (58.4%), 4 or more bedrooms (18.6%)
--- Type of heating used: utility gas (60.7%), bottled, tank, or LP gas (4.3%), electricity (12.2%), fuel oil, kerosene, etc. (18.7%), coal or coke (0.2%), all other fuels (2.7%), no fuel used (1.1%)
- New building permits: 37,330 ($6,406,410 value)
- Manufactured homes shipped to state: 1,141 (average sales price: $81,800)
North Carolina
- Homeownership rate: 64.6%
- Homeowner vacancy rate: 0.5%
- Rental vacancy rate: 4.9%
- Occupied housing units: 4,046,348
--- Owner-occupied housing units: 2,642,709, renter-occupied housing units: 1,403,639
--- Year homes were built: 2014 or later (6.5%), 2010 to 2013 (4.1%), 2000 to 2009 (18.8%), 1980 to 1999 (34.4%), 1960 to 1979 (21.9%), 1940 to 1959 (9.7%), 1939 or earlier (4.6%)
--- Number of bedrooms: no bedroom (1.4%), 1 bedroom (6.6%), 2 or 3 bedrooms (71.1%), 4 or more bedrooms (20.9%)
--- Type of heating used: utility gas (24.4%), bottled, tank, or LP gas (6.6%), electricity (64.3%), fuel oil, kerosene, etc. (2.6%), coal or coke (0.0%), all other fuels (1.6%), no fuel used (0.5%)
- New building permits: 80,474 ($16,111,594 value)
- Manufactured homes shipped to state: 4,066 (average sales price: $86,200)
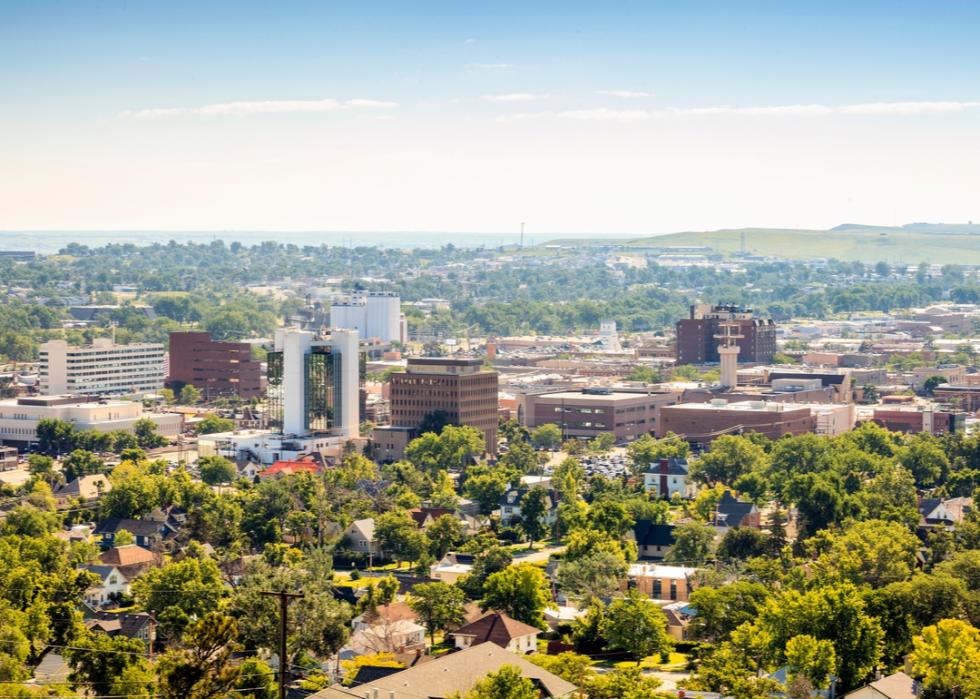
North Dakota
- Homeownership rate: 63.8%
- Homeowner vacancy rate: 1.0%
- Rental vacancy rate: 12.3%
- Occupied housing units: 323,519
--- Owner-occupied housing units: 198,411, renter-occupied housing units: 125,108
--- Year homes were built: 2014 or later (8.5%), 2010 to 2013 (7.7%), 2000 to 2009 (11.5%), 1980 to 1999 (21.4%), 1960 to 1979 (25.6%), 1940 to 1959 (12.9%), 1939 or earlier (12.4%)
--- Number of bedrooms: no bedroom (1.7%), 1 bedroom (10.7%), 2 or 3 bedrooms (58.6%), 4 or more bedrooms (29.0%)
--- Type of heating used: utility gas (40.0%), bottled, tank, or LP gas (13.9%), electricity (41.3%), fuel oil, kerosene, etc. (2.0%), coal or coke (0.2%), all other fuels (1.7%), no fuel used (0.8%)
- New building permits: 3,493 ($726,755 value)
- Manufactured homes shipped to state: 257 (average sales price: $97,500)
Ohio
- Homeownership rate: 68.2%
- Homeowner vacancy rate: 0.4%
- Rental vacancy rate: 4.0%
- Occupied housing units: 4,730,340
--- Owner-occupied housing units: 3,123,733, renter-occupied housing units: 1,606,607
--- Year homes were built: 2014 or later (2.7%), 2010 to 2013 (1.6%), 2000 to 2009 (9.5%), 1980 to 1999 (21.5%), 1960 to 1979 (26.3%), 1940 to 1959 (19.9%), 1939 or earlier (18.6%)
--- Number of bedrooms: no bedroom (1.5%), 1 bedroom (8.9%), 2 or 3 bedrooms (67.3%), 4 or more bedrooms (22.3%)
--- Type of heating used: utility gas (65.0%), bottled, tank, or LP gas (5.4%), electricity (24.7%), fuel oil, kerosene, etc. (2.0%), coal or coke (0.1%), all other fuels (2.4%), no fuel used (0.4%)
- New building permits: 29,686 ($6,418,479 value)
- Manufactured homes shipped to state: 1,215 (average sales price: $72,500)
Oklahoma
- Homeownership rate: 65.6%
- Homeowner vacancy rate: 1.2%
- Rental vacancy rate: 7.8%
- Occupied housing units: 1,495,151
--- Owner-occupied housing units: 979,898, renter-occupied housing units: 515,253
--- Year homes were built: 2014 or later (5.1%), 2010 to 2013 (3.8%), 2000 to 2009 (13.5%), 1980 to 1999 (26.6%), 1960 to 1979 (29.7%), 1940 to 1959 (14.3%), 1939 or earlier (7.0%)
--- Number of bedrooms: no bedroom (1.5%), 1 bedroom (8.1%), 2 or 3 bedrooms (72.1%), 4 or more bedrooms (18.3%)
--- Type of heating used: utility gas (51.0%), bottled, tank, or LP gas (6.7%), electricity (39.5%), fuel oil, kerosene, etc. (0.2%), coal or coke (0.0%), all other fuels (2.3%), no fuel used (0.3%)
- New building permits: 13,733 ($2,852,519 value)
- Manufactured homes shipped to state: 1,818 (average sales price: $87,900)
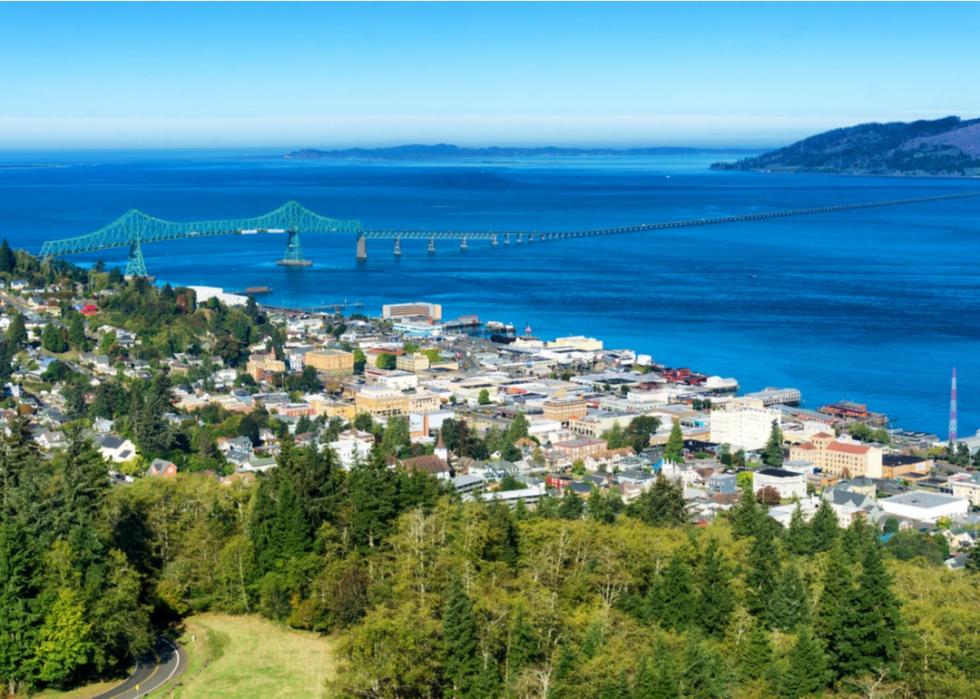
Oregon
- Homeownership rate: 67.6%
- Homeowner vacancy rate: 0.8%
- Rental vacancy rate: 5.8%
- Occupied housing units: 1,649,352
--- Owner-occupied housing units: 1,037,125, renter-occupied housing units: 612,227
--- Year homes were built: 2014 or later (4.3%), 2010 to 2013 (2.3%), 2000 to 2009 (14.0%), 1980 to 1999 (27.7%), 1960 to 1979 (27.7%), 1940 to 1959 (12.9%), 1939 or earlier (11.0%)
--- Number of bedrooms: no bedroom (3.6%), 1 bedroom (9.7%), 2 or 3 bedrooms (68.0%), 4 or more bedrooms (18.7%)
--- Type of heating used: utility gas (36.9%), bottled, tank, or LP gas (1.8%), electricity (52.4%), fuel oil, kerosene, etc. (1.6%), coal or coke (0.0%), all other fuels (6.9%), no fuel used (0.4%)
- New building permits: 18,665 ($4,067,001 value)
- Manufactured homes shipped to state: 1,089 (average sales price: $106,700)

Pennsylvania
- Homeownership rate: 68.9%
- Homeowner vacancy rate: 0.4%
- Rental vacancy rate: 5.4%
- Occupied housing units: 5,119,249
--- Owner-occupied housing units: 3,501,824, renter-occupied housing units: 1,617,425
--- Year homes were built: 2014 or later (2.4%), 2010 to 2013 (1.5%), 2000 to 2009 (8.1%), 1980 to 1999 (19.4%), 1960 to 1979 (22.9%), 1940 to 1959 (20.9%), 1939 or earlier (24.9%)
--- Number of bedrooms: no bedroom (1.9%), 1 bedroom (10.1%), 2 or 3 bedrooms (65.2%), 4 or more bedrooms (22.8%)
--- Type of heating used: utility gas (51.5%), bottled, tank, or LP gas (4.6%), electricity (23.9%), fuel oil, kerosene, etc. (15.5%), coal or coke (1.0%), all other fuels (3.1%), no fuel used (0.4%)
- New building permits: 25,706 ($5,077,342 value)
- Manufactured homes shipped to state: 1,264 (average sales price: $79,700)

Rhode Island
- Homeownership rate: 62.4%
- Homeowner vacancy rate: 1.0%
- Rental vacancy rate: 2.5%
- Occupied housing units: 407,174
--- Owner-occupied housing units: 251,146, renter-occupied housing units: 156,028
--- Year homes were built: 2014 or later (1.0%), 2010 to 2013 (0.7%), 2000 to 2009 (5.5%), 1980 to 1999 (20.0%), 1960 to 1979 (25.0%), 1940 to 1959 (19.6%), 1939 or earlier (28.3%)
--- Number of bedrooms: no bedroom (2.7%), 1 bedroom (14.1%), 2 or 3 bedrooms (67.6%), 4 or more bedrooms (15.6%)
--- Type of heating used: utility gas (55.3%), bottled, tank, or LP gas (3.6%), electricity (10.3%), fuel oil, kerosene, etc. (28.6%), coal or coke (0.0%), all other fuels (2.0%), no fuel used (0.2%)
- New building permits: 1,374 ($298,949 value)
- Manufactured homes shipped to state: 16 (average sales price: $89,300)
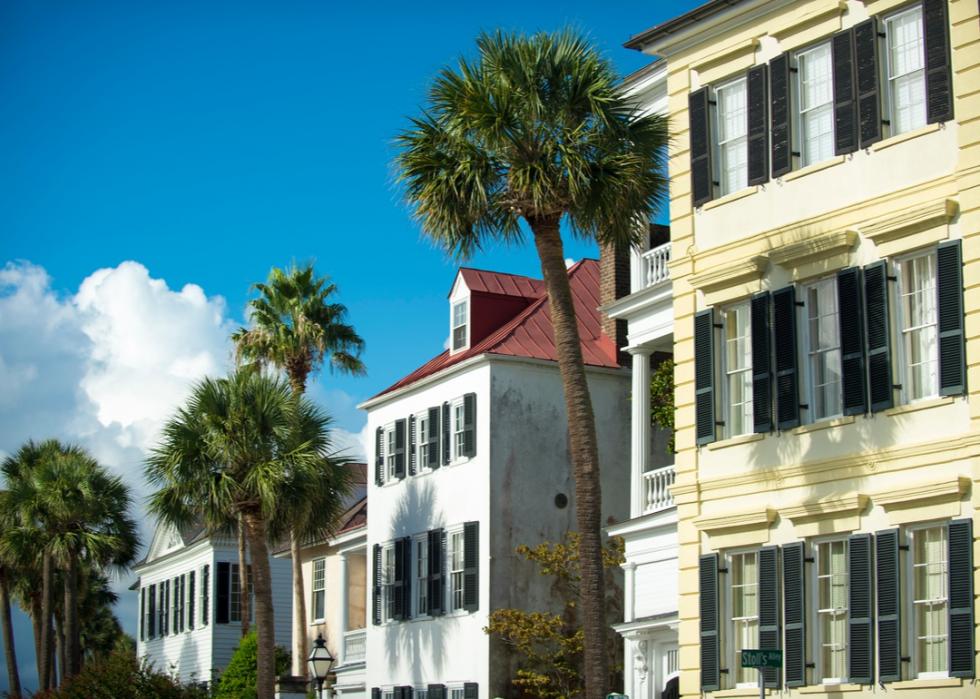
South Carolina
- Homeownership rate: 75.3%
- Homeowner vacancy rate: 0.8%
- Rental vacancy rate: 7.2%
- Occupied housing units: 1,975,915
--- Owner-occupied housing units: 1,388,492, renter-occupied housing units: 587,423
--- Year homes were built: 2014 or later (8.1%), 2010 to 2013 (4.1%), 2000 to 2009 (19.0%), 1980 to 1999 (33.5%), 1960 to 1979 (22.5%), 1940 to 1959 (9.0%), 1939 or earlier (3.8%)
--- Number of bedrooms: no bedroom (1.5%), 1 bedroom (5.0%), 2 or 3 bedrooms (70.8%), 4 or more bedrooms (22.7%)
--- Type of heating used: utility gas (23.5%), bottled, tank, or LP gas (3.4%), electricity (70.9%), fuel oil, kerosene, etc. (0.6%), coal or coke (0.0%), all other fuels (1.0%), no fuel used (0.5%)
- New building permits: 42,340 ($9,505,326 value)
- Manufactured homes shipped to state: 3,533 (average sales price: $90,900)
South Dakota
- Homeownership rate: 71.7%
- Homeowner vacancy rate: 0.7%
- Rental vacancy rate: 10.0%
- Occupied housing units: 353,799
--- Owner-occupied housing units: 239,931, renter-occupied housing units: 113,868
--- Year homes were built: 2014 or later (6.6%), 2010 to 2013 (4.1%), 2000 to 2009 (13.9%), 1980 to 1999 (23.1%), 1960 to 1979 (23.7%), 1940 to 1959 (13.0%), 1939 or earlier (15.6%)
--- Number of bedrooms: no bedroom (1.4%), 1 bedroom (9.1%), 2 or 3 bedrooms (58.6%), 4 or more bedrooms (30.9%)
--- Type of heating used: utility gas (46.4%), bottled, tank, or LP gas (16.3%), electricity (32.5%), fuel oil, kerosene, etc. (1.5%), coal or coke (0.0%), all other fuels (2.7%), no fuel used (0.7%)
- New building permits: 6,660 ($1,166,890 value)
- Manufactured homes shipped to state: 271 (average sales price: $88,700)
Tennessee
- Homeownership rate: 67.1%
- Homeowner vacancy rate: 0.7%
- Rental vacancy rate: 8.4%
- Occupied housing units: 2,654,737
--- Owner-occupied housing units: 1,765,720, renter-occupied housing units: 889,017
--- Year homes were built: 2014 or later (6.3%), 2010 to 2013 (3.3%), 2000 to 2009 (16.1%), 1980 to 1999 (31.8%), 1960 to 1979 (24.9%), 1940 to 1959 (12.3%), 1939 or earlier (5.3%)
--- Number of bedrooms: no bedroom (1.3%), 1 bedroom (7.3%), 2 or 3 bedrooms (70.5%), 4 or more bedrooms (21.0%)
--- Type of heating used: utility gas (31.3%), bottled, tank, or LP gas (3.7%), electricity (62.5%), fuel oil, kerosene, etc. (0.3%), coal or coke (0.0%), all other fuels (1.7%), no fuel used (0.3%)
- New building permits: 49,719 ($9,207,252 value)
- Manufactured homes shipped to state: 2,353 (average sales price: $86,000)
Texas
- Homeownership rate: 64.1%
- Homeowner vacancy rate: 0.9%
- Rental vacancy rate: 8.2%
- Occupied housing units: 9,985,126
--- Owner-occupied housing units: 6,179,278, renter-occupied housing units: 3,805,848
--- Year homes were built: 2014 or later (9.0%), 2010 to 2013 (5.1%), 2000 to 2009 (18.2%), 1980 to 1999 (30.9%), 1960 to 1979 (23.1%), 1940 to 1959 (10.6%), 1939 or earlier (3.1%)
--- Number of bedrooms: no bedroom (2.1%), 1 bedroom (12.1%), 2 or 3 bedrooms (61.8%), 4 or more bedrooms (23.9%)
--- Type of heating used: utility gas (35.0%), bottled, tank, or LP gas (2.8%), electricity (61.1%), fuel oil, kerosene, etc. (0.1%), coal or coke (0.0%), all other fuels (0.5%), no fuel used (0.4%)
- New building permits: 230,503 ($42,986,433 value)
- Manufactured homes shipped to state: 12,239 (average sales price: $88,200)
Utah
- Homeownership rate: 64.4%
- Homeowner vacancy rate: 0.5%
- Rental vacancy rate: 5.4%
- Occupied housing units: 1,023,855
--- Owner-occupied housing units: 723,288, renter-occupied housing units: 300,567
--- Year homes were built: 2014 or later (8.7%), 2010 to 2013 (4.6%), 2000 to 2009 (18.9%), 1980 to 1999 (29.0%), 1960 to 1979 (22.2%), 1940 to 1959 (9.9%), 1939 or earlier (6.6%)
--- Number of bedrooms: no bedroom (1.5%), 1 bedroom (6.5%), 2 or 3 bedrooms (47.6%), 4 or more bedrooms (44.4%)
--- Type of heating used: utility gas (80.8%), bottled, tank, or LP gas (2.3%), electricity (14.8%), fuel oil, kerosene, etc. (0.1%), coal or coke (0.1%), all other fuels (1.7%), no fuel used (0.2%)
- New building permits: 31,775 ($7,287,441 value)
- Manufactured homes shipped to state: 193 (average sales price: $99,200)
Vermont
- Homeownership rate: 73.7%
- Homeowner vacancy rate: 0.6%
- Rental vacancy rate: 3.5%
- Occupied housing units: 262,767
--- Owner-occupied housing units: 186,252, renter-occupied housing units: 76,515
--- Year homes were built: 2014 or later (3.1%), 2010 to 2013 (2.6%), 2000 to 2009 (11.2%), 1980 to 1999 (25.6%), 1960 to 1979 (23.6%), 1940 to 1959 (8.4%), 1939 or earlier (25.6%)
--- Number of bedrooms: no bedroom (3.6%), 1 bedroom (11.0%), 2 or 3 bedrooms (66.5%), 4 or more bedrooms (18.9%)
--- Type of heating used: utility gas (18.6%), bottled, tank, or LP gas (18.4%), electricity (6.4%), fuel oil, kerosene, etc. (41.4%), coal or coke (0.1%), all other fuels (15.1%), no fuel used (0.1%)
- New building permits: 2,077 ($396,203 value)
- Manufactured homes shipped to state: 120 (average sales price: $93,300)
Virginia
- Homeownership rate: 68.2%
- Homeowner vacancy rate: 0.9%
- Rental vacancy rate: 6.6%
- Occupied housing units: 3,191,847
--- Owner-occupied housing units: 2,110,713, renter-occupied housing units: 1,081,134
--- Year homes were built: 2014 or later (4.8%), 2010 to 2013 (3.2%), 2000 to 2009 (15.1%), 1980 to 1999 (32.1%), 1960 to 1979 (25.8%), 1940 to 1959 (12.5%), 1939 or earlier (6.5%)
--- Number of bedrooms: no bedroom (1.4%), 1 bedroom (8.1%), 2 or 3 bedrooms (60.8%), 4 or more bedrooms (29.7%)
--- Type of heating used: utility gas (32.6%), bottled, tank, or LP gas (4.2%), electricity (56.2%), fuel oil, kerosene, etc. (4.1%), coal or coke (0.0%), all other fuels (2.3%), no fuel used (0.5%)
- New building permits: 33,813 ($6,342,240 value)
- Manufactured homes shipped to state: 964 (average sales price: $89,300)
Washington
- Homeownership rate: 62.5%
- Homeowner vacancy rate: 0.8%
- Rental vacancy rate: 5.1%
- Occupied housing units: 2,932,477
--- Owner-occupied housing units: 1,849,692, renter-occupied housing units: 1,082,785
--- Year homes were built: 2014 or later (6.1%), 2010 to 2013 (3.4%), 2000 to 2009 (14.6%), 1980 to 1999 (29.4%), 1960 to 1979 (25.3%), 1940 to 1959 (11.8%), 1939 or earlier (9.4%)
--- Number of bedrooms: no bedroom (3.6%), 1 bedroom (11.2%), 2 or 3 bedrooms (62.2%), 4 or more bedrooms (23.1%)
--- Type of heating used: utility gas (34.2%), bottled, tank, or LP gas (3.0%), electricity (56.3%), fuel oil, kerosene, etc. (1.6%), coal or coke (0.0%), all other fuels (4.4%), no fuel used (0.5%)
- New building permits: 43,881 ($9,488,095 value)
- Manufactured homes shipped to state: 994 (average sales price: $109,700)
West Virginia
- Homeownership rate: 78.1%
- Homeowner vacancy rate: 0.6%
- Rental vacancy rate: 6.6%
- Occupied housing units: 728,175
--- Owner-occupied housing units: 534,568, renter-occupied housing units: 193,607
--- Year homes were built: 2014 or later (2.4%), 2010 to 2013 (2.4%), 2000 to 2009 (10.2%), 1980 to 1999 (26.7%), 1960 to 1979 (25.1%), 1940 to 1959 (17.8%), 1939 or earlier (15.3%)
--- Number of bedrooms: no bedroom (1.3%), 1 bedroom (6.0%), 2 or 3 bedrooms (73.9%), 4 or more bedrooms (18.8%)
--- Type of heating used: utility gas (39.9%), bottled, tank, or LP gas (5.3%), electricity (45.0%), fuel oil, kerosene, etc. (2.7%), coal or coke (0.6%), all other fuels (6.3%), no fuel used (0.2%)
- New building permits: 3,204 ($573,944 value)
- Manufactured homes shipped to state: 884 (average sales price: $86,700)
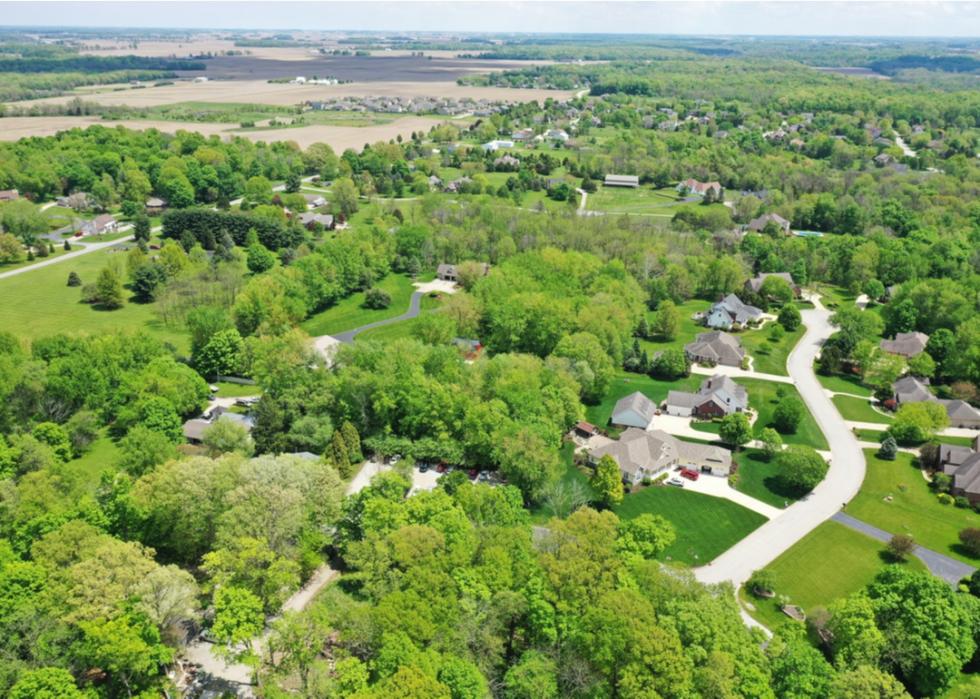
Wisconsin
- Homeownership rate: 67.5%
- Homeowner vacancy rate: 0.2%
- Rental vacancy rate: 5.1%
- Occupied housing units: 2,386,623
--- Owner-occupied housing units: 1,603,906, renter-occupied housing units: 782,717
--- Year homes were built: 2014 or later (3.4%), 2010 to 2013 (1.9%), 2000 to 2009 (12.0%), 1980 to 1999 (23.8%), 1960 to 1979 (24.2%), 1940 to 1959 (16.2%), 1939 or earlier (18.4%)
--- Number of bedrooms: no bedroom (1.6%), 1 bedroom (9.4%), 2 or 3 bedrooms (68.6%), 4 or more bedrooms (20.4%)
--- Type of heating used: utility gas (65.8%), bottled, tank, or LP gas (12.0%), electricity (16.1%), fuel oil, kerosene, etc. (1.7%), coal or coke (0.0%), all other fuels (3.8%), no fuel used (0.6%)
- New building permits: 21,226 ($4,733,365 value)
- Manufactured homes shipped to state: 596 (average sales price: $75,200)
Wyoming
- Homeownership rate: 72.7%
- Homeowner vacancy rate: 1.4%
- Rental vacancy rate: 7.5%
- Occupied housing units: 233,128
--- Owner-occupied housing units: 167,582, renter-occupied housing units: 65,546
--- Year homes were built: 2014 or later (4.4%), 2010 to 2013 (3.8%), 2000 to 2009 (14.1%), 1980 to 1999 (28.1%), 1960 to 1979 (25.6%), 1940 to 1959 (15.1%), 1939 or earlier (8.7%)
--- Number of bedrooms: no bedroom (0.9%), 1 bedroom (6.7%), 2 or 3 bedrooms (63.7%), 4 or more bedrooms (28.7%)
--- Type of heating used: utility gas (59.2%), bottled, tank, or LP gas (12.1%), electricity (22.8%), fuel oil, kerosene, etc. (0.1%), coal or coke (0.6%), all other fuels (4.9%), no fuel used (0.5%)
- New building permits: 2,128 ($703,859 value)
- Manufactured homes shipped to state: 135 (average sales price: $70,900)


