Builder looking at foundation of a house.
Stacker Studio

20 metros where home construction is slowing the most

Written by:
January 30, 2023
Simon Kadula // Shutterstock

This story originally appeared on Nashville MLS and was produced and distributed in partnership with Stacker Studio.

20 metros where home construction is slowing the most

​​Homebuilding slowed dramatically across the country in 2022 as mortgage rates rose, scaring away potential buyers. The construction starts of single-family homes dropped nearly 19% year over year in September, while building permits fell 17%, according to the Census Bureau.

Building permits are seen as a measure of future construction. In October 2022, home sales dropped for the ninth straight month.

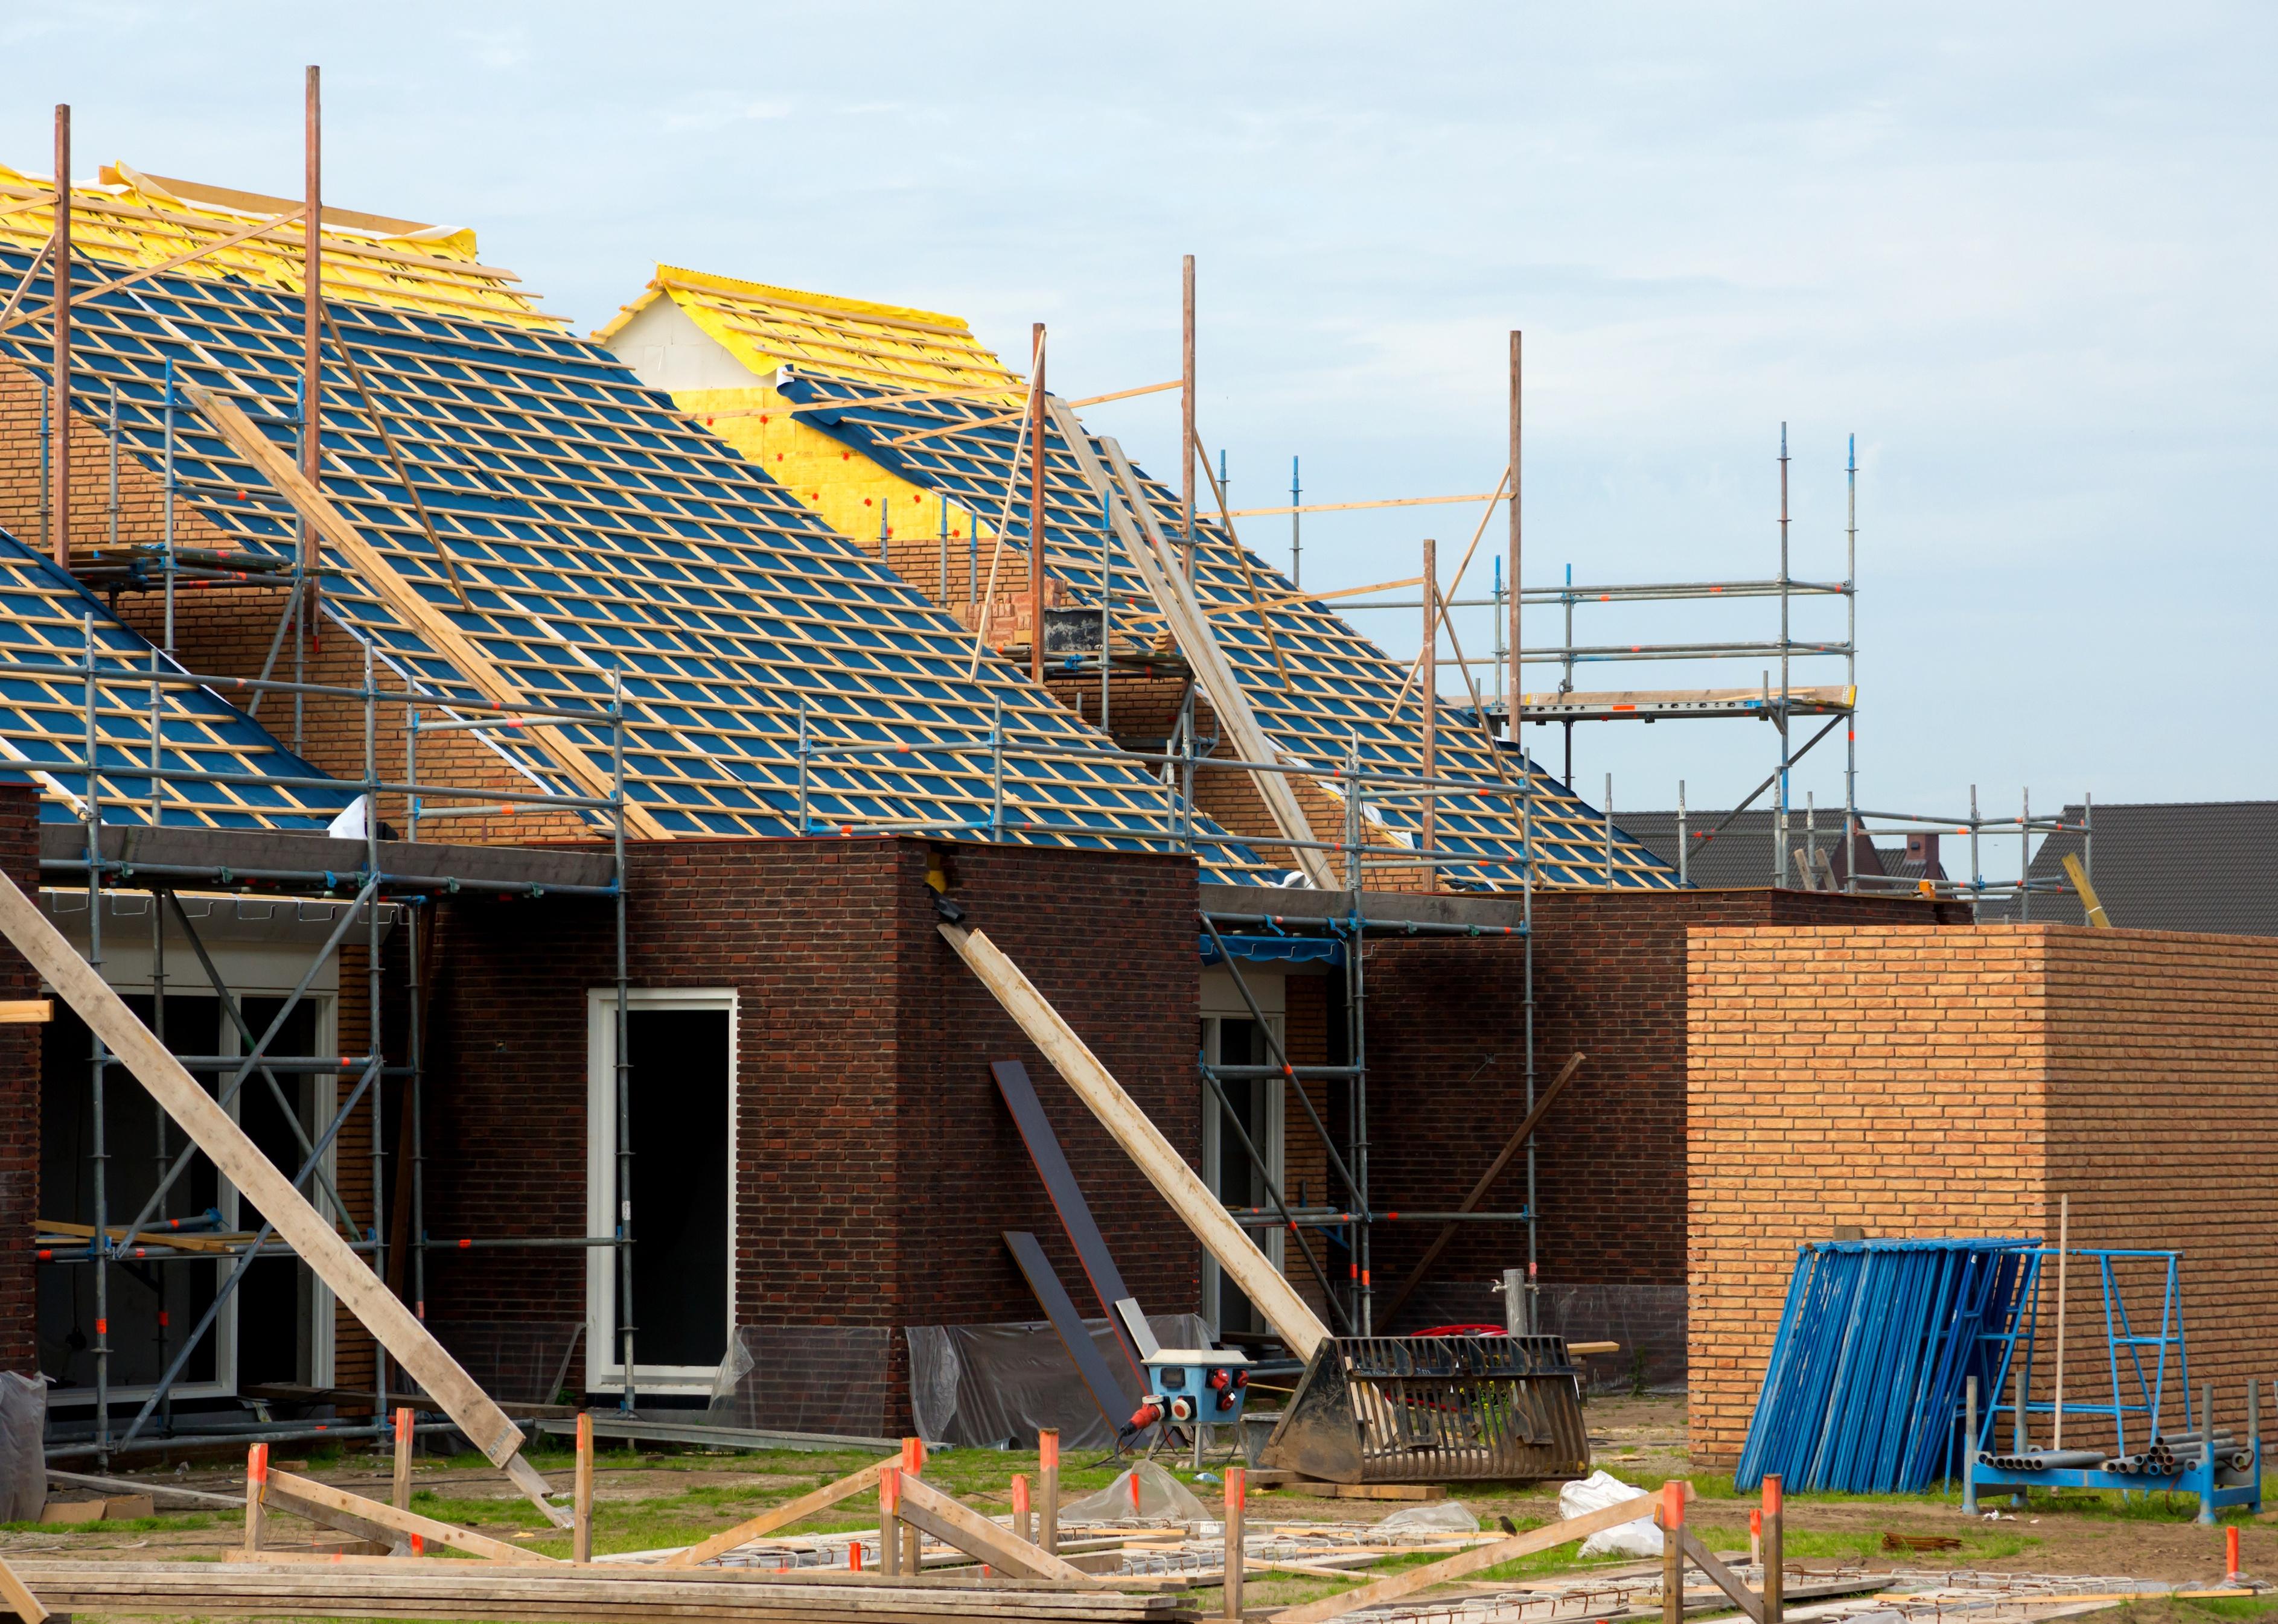
U.S. homebuilders did exceptionally well at the beginning of the coronavirus pandemic. Interest rates fell to a record low, demand soared as people cooped up at home looked for more room, and home prices rose 40% in two years. Homebuilders could not keep up.

But that scenario flipped as interest rates rose and the market suffered a sharp setback.

Three of the top 20 metropolitan areas that made this list are in Arkansas, while another five are in West Virginia. Both states are among the poorest in the country. Arkansas home prices ranked the third-lowest in the country, according to the Arkansas Economic Development Commission. Sixteen of the 20 metropolitan areas are in the South or Midwest.

The metropolitan area that tops the list is Bremerton, Washington, a one-hour ferry ride from Seattle and home to the West Coast's second-largest naval base, Naval Base Kitsap. Housing prices are flat across the Seattle area compared to a year ago, and in Kitsap County, the median home sold for $505,471 in November, up about 1%.

Nashville MLS analyzed data from the Census Bureau's Building Permits Survey to rank the top 20 metropolitan areas where construction is slowing the most based on the decrease in approved building permits from January and February 2022 to September and October 2022.

The analysis used two months of data to account for monthly variation and was limited to 236 metros with 100 or more permits in January and February out of the 384 metros with available data. Metro areas often include the identified city, nearby municipalities, and suburbs.

Homebuilders are warning that high interest rates could continue to worry buyers throughout 2023.

Real estate contruction site.
1 / 20
TonLammerts // Shutterstock

#20. Chico, California

- Drop in housing construction permits since early in the year: -52.6%
--- Permits authorized January & February: 437
--- Permits authorized September & October: 207

Water tower with barren trees and a telephone pole on a cloudy day in Sherman, Texas.
2 / 20
Edward H. Campbell // Shutterstock

#19. Sherman, Texas

- Drop in housing construction permits since early in the year: -53.4%
--- Permits authorized January & February: 296
--- Permits authorized September & October: 138

An old railroad trestle that has been made into a pedestrian walkway in Clarksville, Tennessee.
3 / 20
Real Window Creative // Shutterstock

#18. Clarksville, Tennessee

- Drop in housing construction permits since early in the year: -54.1%
--- Permits authorized January & February: 1,100
--- Permits authorized September & October: 505

Portland City Skyline from Portland Observatory on Munjoy Hill in Portland, Maine.
4 / 20
Wangkun Jia // Shutterstock

#17. Portland, Maine

- Drop in housing construction permits since early in the year: -54.1%
--- Permits authorized January & February: 993
--- Permits authorized September & October: 456

New residential construction home framing against a blue sky.
5 / 20
ungvar // Shutterstock

#16. Columbus, Georgia

- Drop in housing construction permits since early in the year: -55.1%
--- Permits authorized January & February: 285
--- Permits authorized September & October: 128

New home construction from above.
6 / 20
Lena Platonova // Shutterstock

#15. Greensboro, North Carolina

- Drop in housing construction permits since early in the year: -56.3%
--- Permits authorized January & February: 693
--- Permits authorized September & October: 303

Salinas arch way in the historic city center of Salinas, California.
7 / 20
Matt Gush // Shutterstock

#14. Salinas, California

- Drop in housing construction permits since early in the year: -58.6%
--- Permits authorized January & February: 222
--- Permits authorized September & October: 92

Low rise wooden framework of a building on a concrete base.
8 / 20
Imagenet // Shutterstock

#13. Baltimore

- Drop in housing construction permits since early in the year: -59.2%
--- Permits authorized January & February: 1,539
--- Permits authorized September & October: 628

Tri-Cities Washington area view from high vantage point.
9 / 20
J.D.S // Shutterstock

#12. Kennewick, Washington

- Drop in housing construction permits since early in the year: -59.5%
--- Permits authorized January & February: 482
--- Permits authorized September & October: 195

New home under construction in a neighborhood development.
10 / 20
ThomasPhoto // Shutterstock

#11. New Bern, North Carolina

- Drop in housing construction permits since early in the year: -62.0%
--- Permits authorized January & February: 192
--- Permits authorized September & October: 73

Drone aerial view of downtown Montgomery.
11 / 20
New Home Construction // Shutterstock

#10. Montgomery, Alabama

- Drop in housing construction permits since early in the year: -63.0%
--- Permits authorized January & February: 173
--- Permits authorized September & October: 64

Aerial view of downtown Provo, Utah, during summer.
12 / 20
Jacob Boomsma // Shutterstock

#9. Provo, Utah

- Drop in housing construction permits since early in the year: -63.2%
--- Permits authorized January & February: 2,035
--- Permits authorized September & October: 749

Houses and sky line of Ogden, Utah.
13 / 20
Paul W Thompson // Shutterstock

#8. Ogden, Utah

- Drop in housing construction permits since early in the year: -65.8%
--- Permits authorized January & February: 1,239
--- Permits authorized September & October: 424

A new home under construction.
14 / 20
karamysh // Shutterstock

#7. Goldsboro, North Carolina

- Drop in housing construction permits since early in the year: -66.7%
--- Permits authorized January & February: 147
--- Permits authorized September & October: 49

Historic downtown sidewalks and rowhouses of Savannah, Georgia.
15 / 20
Sean Pavone // Shutterstock

#6. Savannah, Georgia

- Drop in housing construction permits since early in the year: -66.9%
--- Permits authorized January & February: 812
--- Permits authorized September & October: 269

City view of Olympia, Washington.
16 / 20
John T Callery // Shutterstock

#5. Olympia, Washington

- Drop in housing construction permits since early in the year: -70.0%
--- Permits authorized January & February: 323
--- Permits authorized September & October: 97

New home construction framing.
17 / 20
Leena Robinson // Shutterstock

#4. Wenatchee, Washington

- Drop in housing construction permits since early in the year: -73.3%
--- Permits authorized January & February: 318
--- Permits authorized September & October: 85

Aerial view of housing development in Colorado Springs, Colorado.
18 / 20
Thomas Barrat // Shutterstock

#3. Colorado Springs, Colorado

- Drop in housing construction permits since early in the year: -73.6%
--- Permits authorized January & February: 2,298
--- Permits authorized September & October: 607

Aerial view of Muskegon, Michigan.
19 / 20
Jacob Boomsma // Shutterstock

#2. Muskegon, Michigan

- Drop in housing construction permits since early in the year: -77.1%
--- Permits authorized January & February: 253
--- Permits authorized September & October: 58

Wood framing for a new home under construction.
20 / 20
ungvar // Shutterstock

#1. Bremerton, Washington

- Drop in housing construction permits since early in the year: -79.4%
--- Permits authorized January & February: 533
--- Permits authorized September & October: 110

Trending Now