Smaller rental homes have higher vacancies, data shows
This story originally appeared on Rentlodex and was produced and distributed in partnership with Stacker Studio.
Smaller rental homes have higher vacancies, data shows
Property owners are having a harder time finding tenants for smaller rental homes, signaling a potential long-term shift in renter preferences.
Rentlodex collected rental vacancy data from the Census Bureau's Current Population Survey/Housing Vacancy Survey from March 9, 2021, to understand what characteristics determine whether a property is likely to be vacant. In this analysis, a housing unit is a house. apartment, or some group of rooms or single room that constitutes an individual living space.
It used to be the case that some 1 in 10 rental units sat vacant a decade ago, that ratio is closer to 1 in 20 today. The rental vacancy rate in 2020 was about 6%, compared to 1% for homeowner vacancies. Rental vacancies peaked in 2009 at 11.1% and declined since, according to Census Bureau data.
The median rent in 2020 for the U.S. was $1,108, an increase from $828 in 2010, according to census data. As rental housing stock has been slow to catch up with demand, the number of affordable rental units also declined over the decade leading up to 2020.
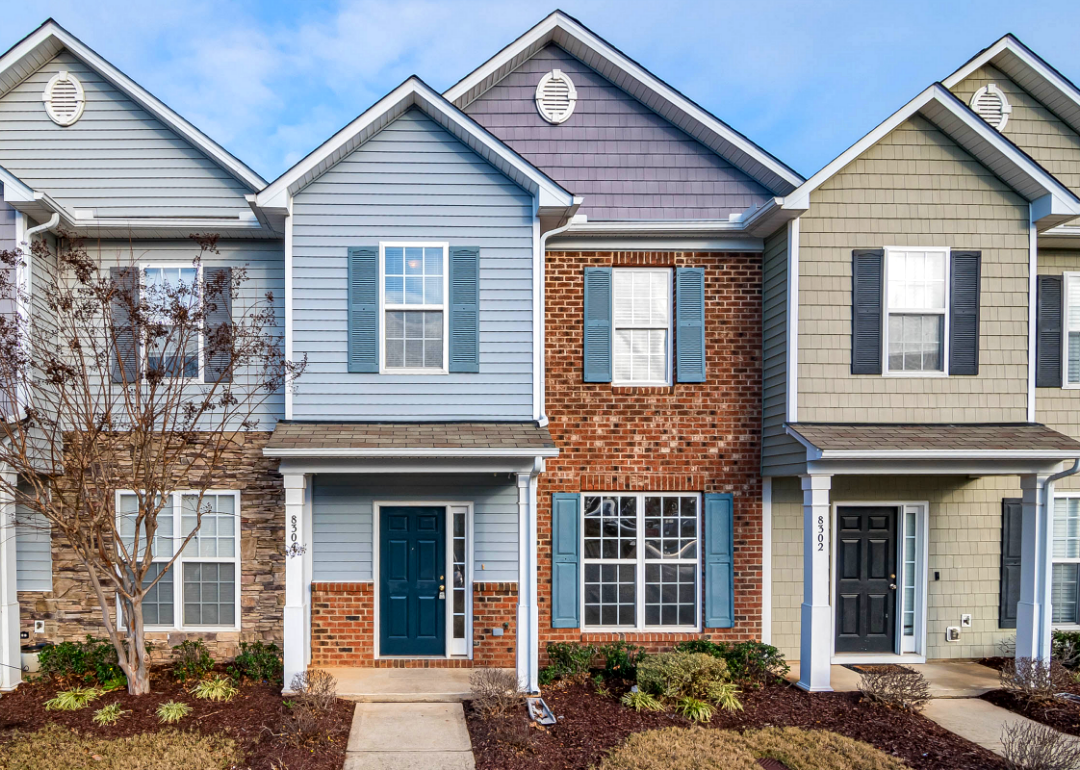
Smaller units are harder to rent
- 3 rooms or less: 10.2% (0.1% change from 2019)
- 4 rooms: 5.7% (-1.1% change from 2019)
- 5 rooms: 4.7% (-0.5% change from 2019)
- 6 rooms or more: 4.8% (-0.3% change from 2019)
Vacancy rate trends are shifting in recent years to reflect Americans' appetites for more space. They may also reflect that more Americans are choosing to rent larger dwellings with roommates to keep their rising cost of living manageable.
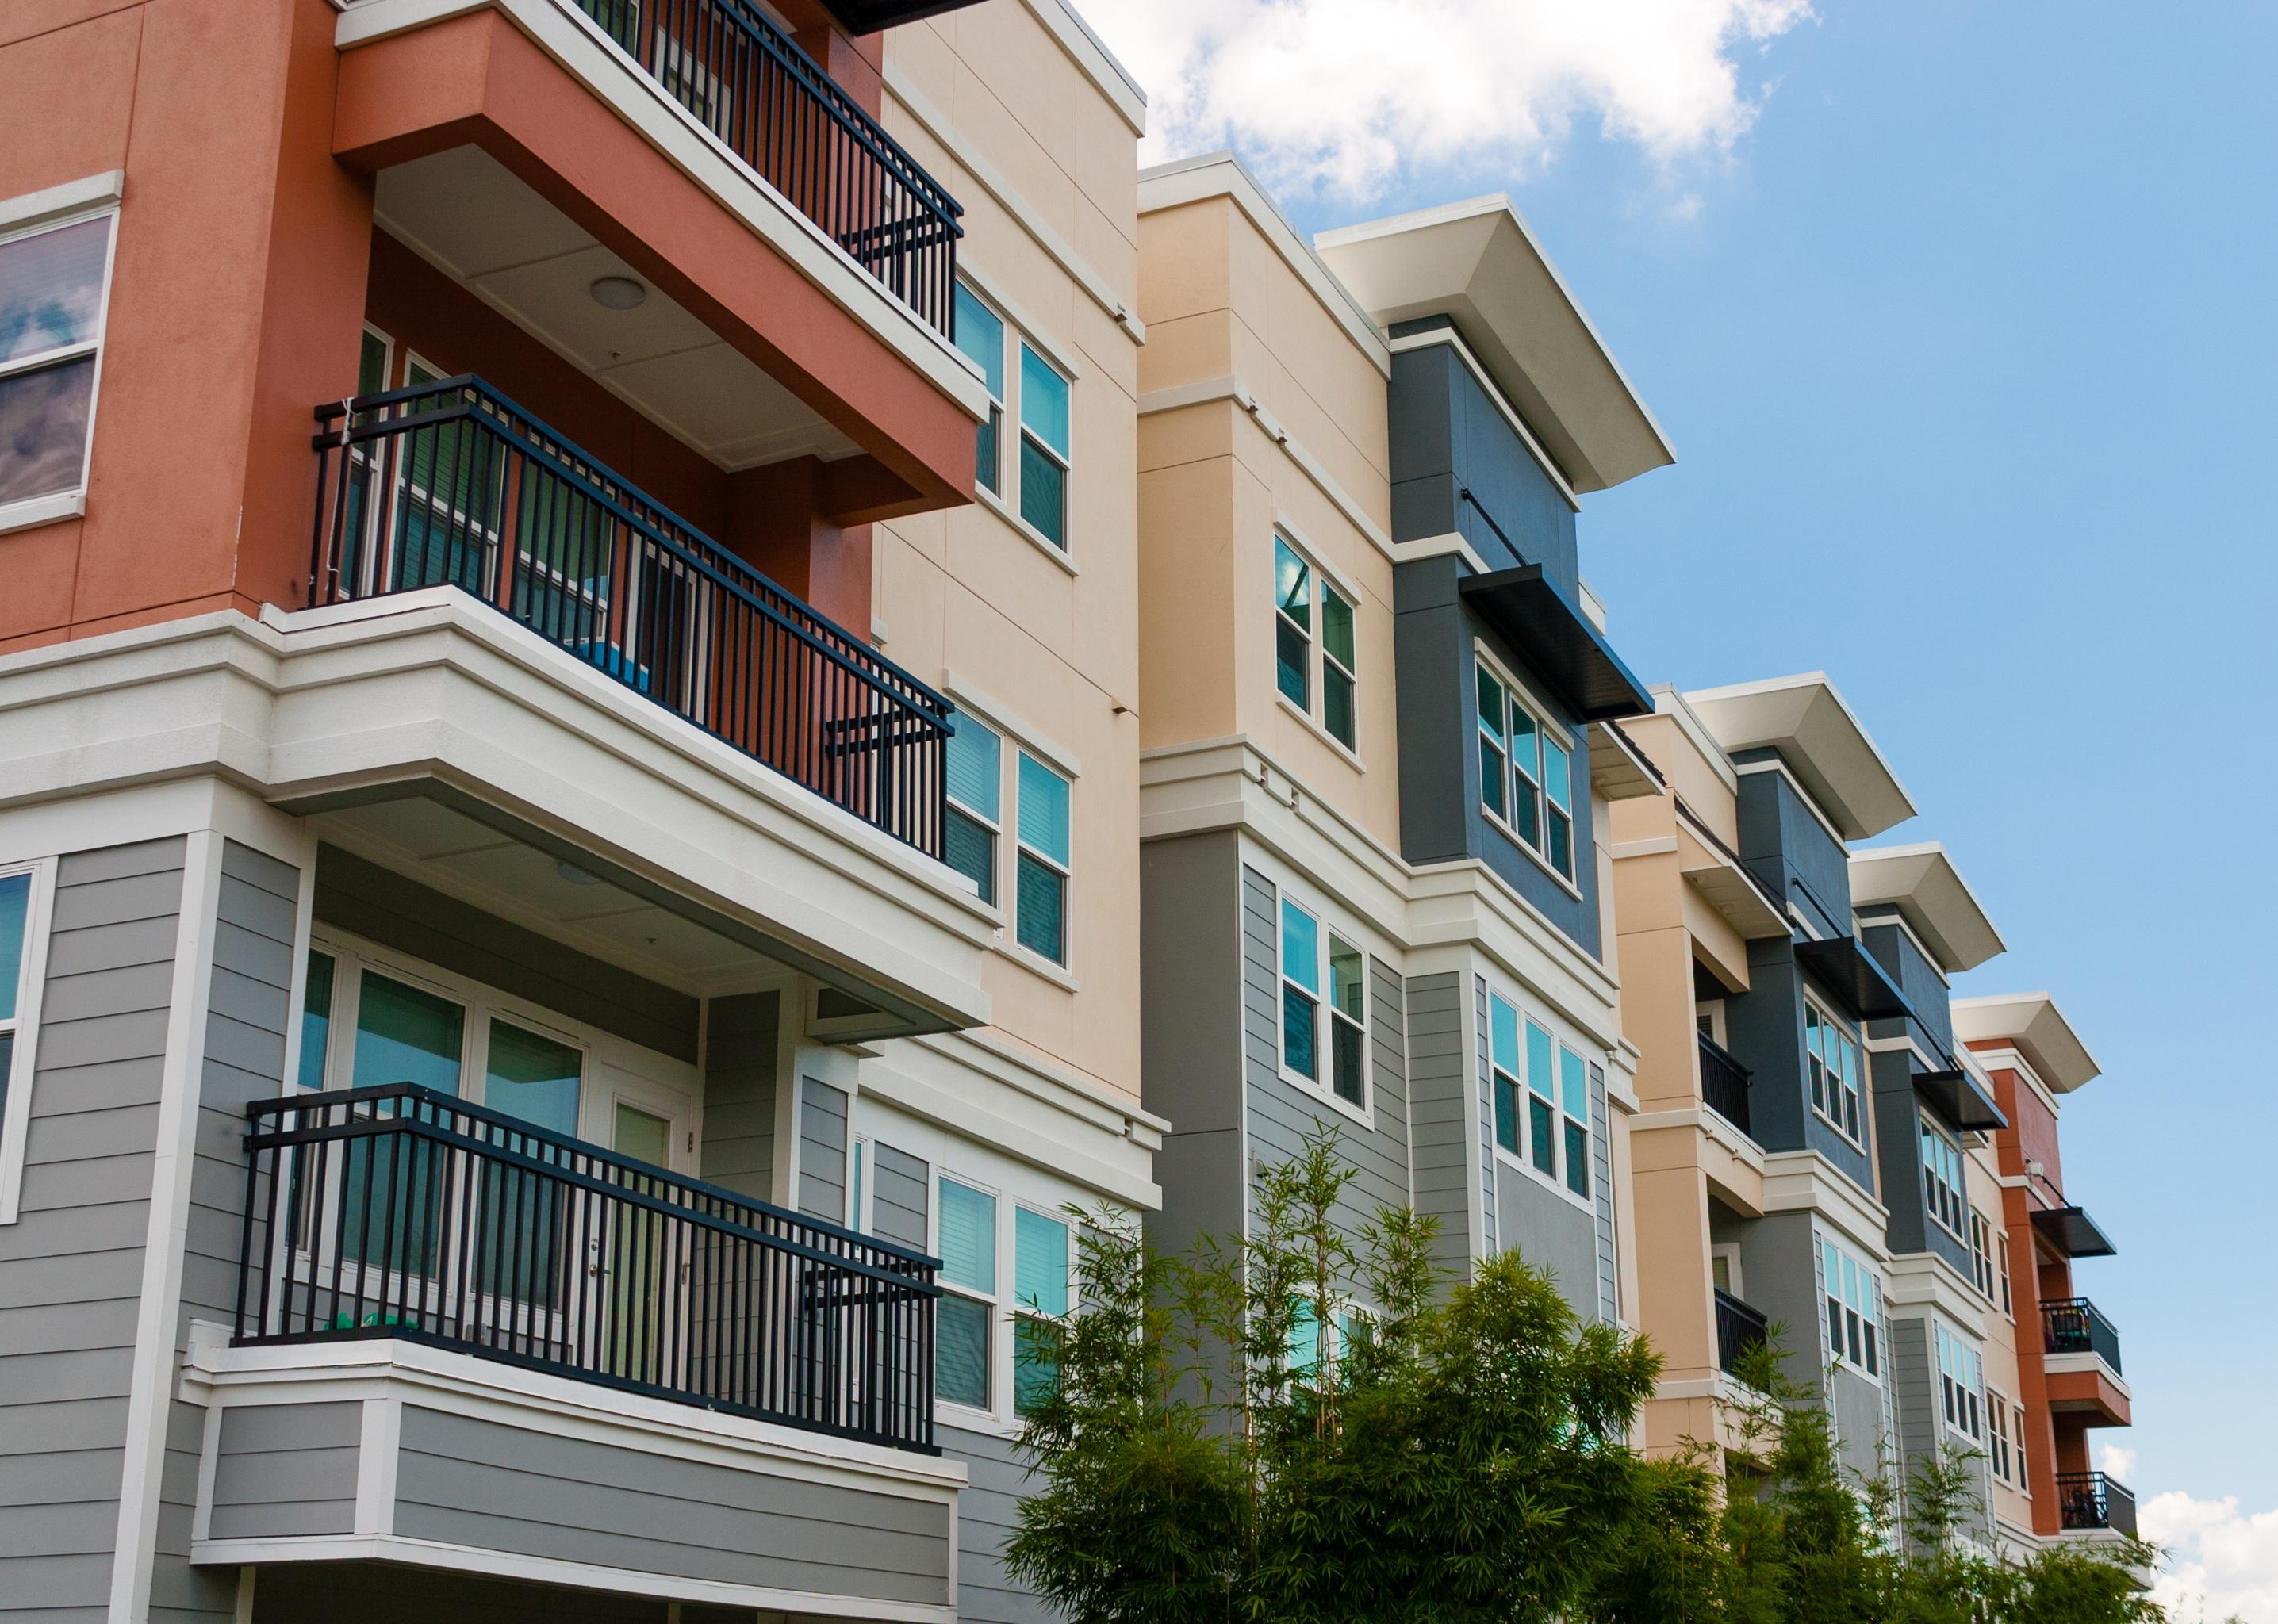
Buildings with more than 10 units tend to have more vacancies
- 1 unit in structure: 5.0% (-0.6% change from 2019)
- 2 to 4 units: 5.6% (-1.0% change from 2019)
- 5 to 9 units: 5.8% (-1.0% change from 2019)
- 10 units or more: 8.9% (0.4% change from 2019)
Multifamily rental complexes had a harder time filling all of their units compared to smaller property types. About 9% of units in multifamily complexes were left vacant in 2020. This was a boon for some renters because it resulted in discounts where property owners sought to maximize income by filling empty units.
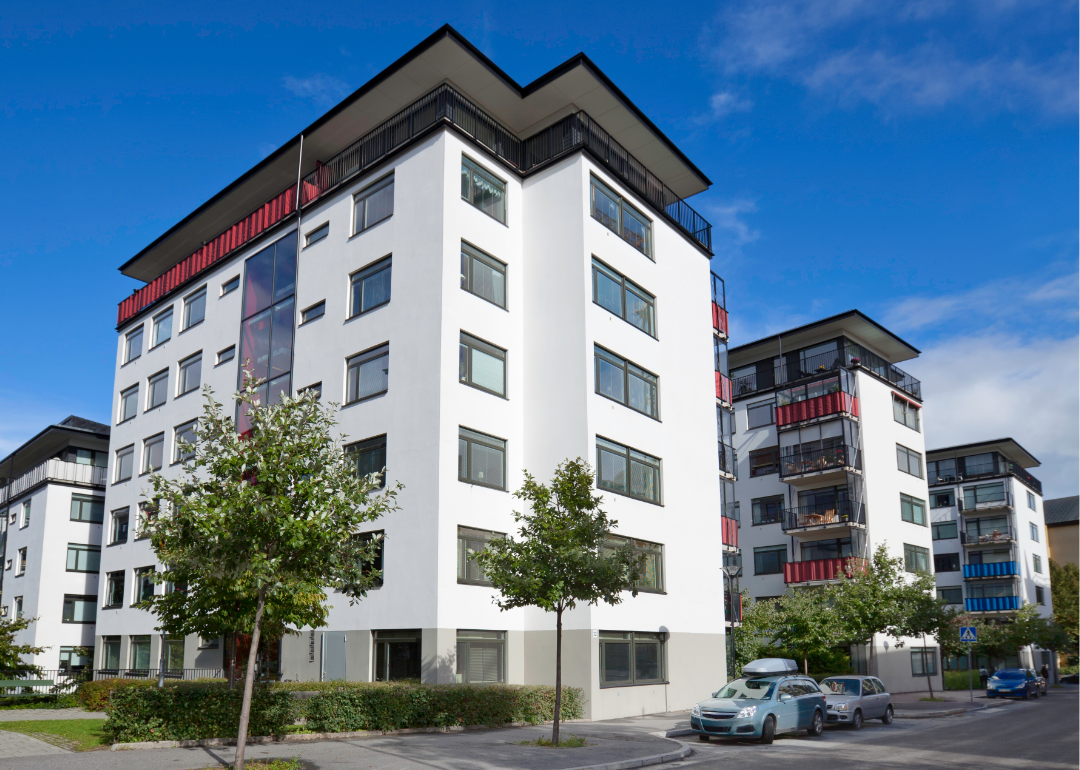
Newer buildings have higher vacancy rates than older ones
- April 1, 2010, or later: 19.1% (2.1% change from 2019)
- 2000 to April 2010: 6.8% (-0.1% change from 2019)
- 1990 to 1999: 5.8% (-0.7% change from 2019)
- 1980 to 1989: 5.4% (-1.5% change from 2019)
- 1970 to 1979: 5.6% (-0.7% change from 2019)
- 1960 to 1969: 5.5% (-0.9% change from 2019)
- 1950 to 1959: 4.4% (-0.3% change from 2019)
- 1940 to 1949: 5.1% (-0.8% change from 2019)
- 1939 or earlier: 5.5% (-0.1% change from 2019)
The older the building, the more likely it is to be closer to full occupancy. Newer apartment buildings can justify higher asking rents as they offer new amenities and upgraded spaces, and can be more difficult to find tenants to rent. Since 2010, builders have picked up the pace of construction on new multifamily apartment buildings, adding hundreds of thousands of rental units to the housing stock nationwide.
More expensive rentals have much higher vacancy rates
- Less than $300: 1.6% (-0.2% change from 2019)
- $300 to $349: 2.9% (-1.4% change from 2019)
- $350 to $399: 3.2% (-2.0% change from 2019)
- $400 to $449: 5.0% (-1.7% change from 2019)
- $450 to $499: 5.0% (-2.7% change from 2019)
- $500 to $599: 4.2% (-2.4% change from 2019)
- $600 to $699: 5.2% (-0.6% change from 2019)
- $700 to $799: 6.0% (-1.4% change from 2019)
- $800 to $899: 5.9% (-0.5% change from 2019)
- $900 to $999: 6.2% (0.2% change from 2019)
- $1,000 to $1,249: 5.5% (-1.0% change from 2019)
- $1,250 to $1,499: 6.0% (-1.2% change from 2019)
- $1,500 to $1,749: 6.0% (-1.3% change from 2019)
- $1,750 to $1,999: 6.6% (-0.9% change from 2019)
- $2,000 or more: 9.9% (1.2% change from 2019)
The sweet spot for pricing rentals in terms of achieving the lowest occupancies and maximizing income for owners is dependent on the property. Data from the Census Bureau, however, shows that it is generally much easier to fill rental units priced below $2,000.
Homes available to own are less likely to be vacant than rentals
- 3 rooms or less: 7.0% (-3.2% difference from rental)
- 4 rooms: 2.1% (-3.6% difference from 2019)
- 5 rooms: 1.0% (-3.7% difference from 2019)
- 6 rooms or more: 0.7% (-4.1% difference from 2019)
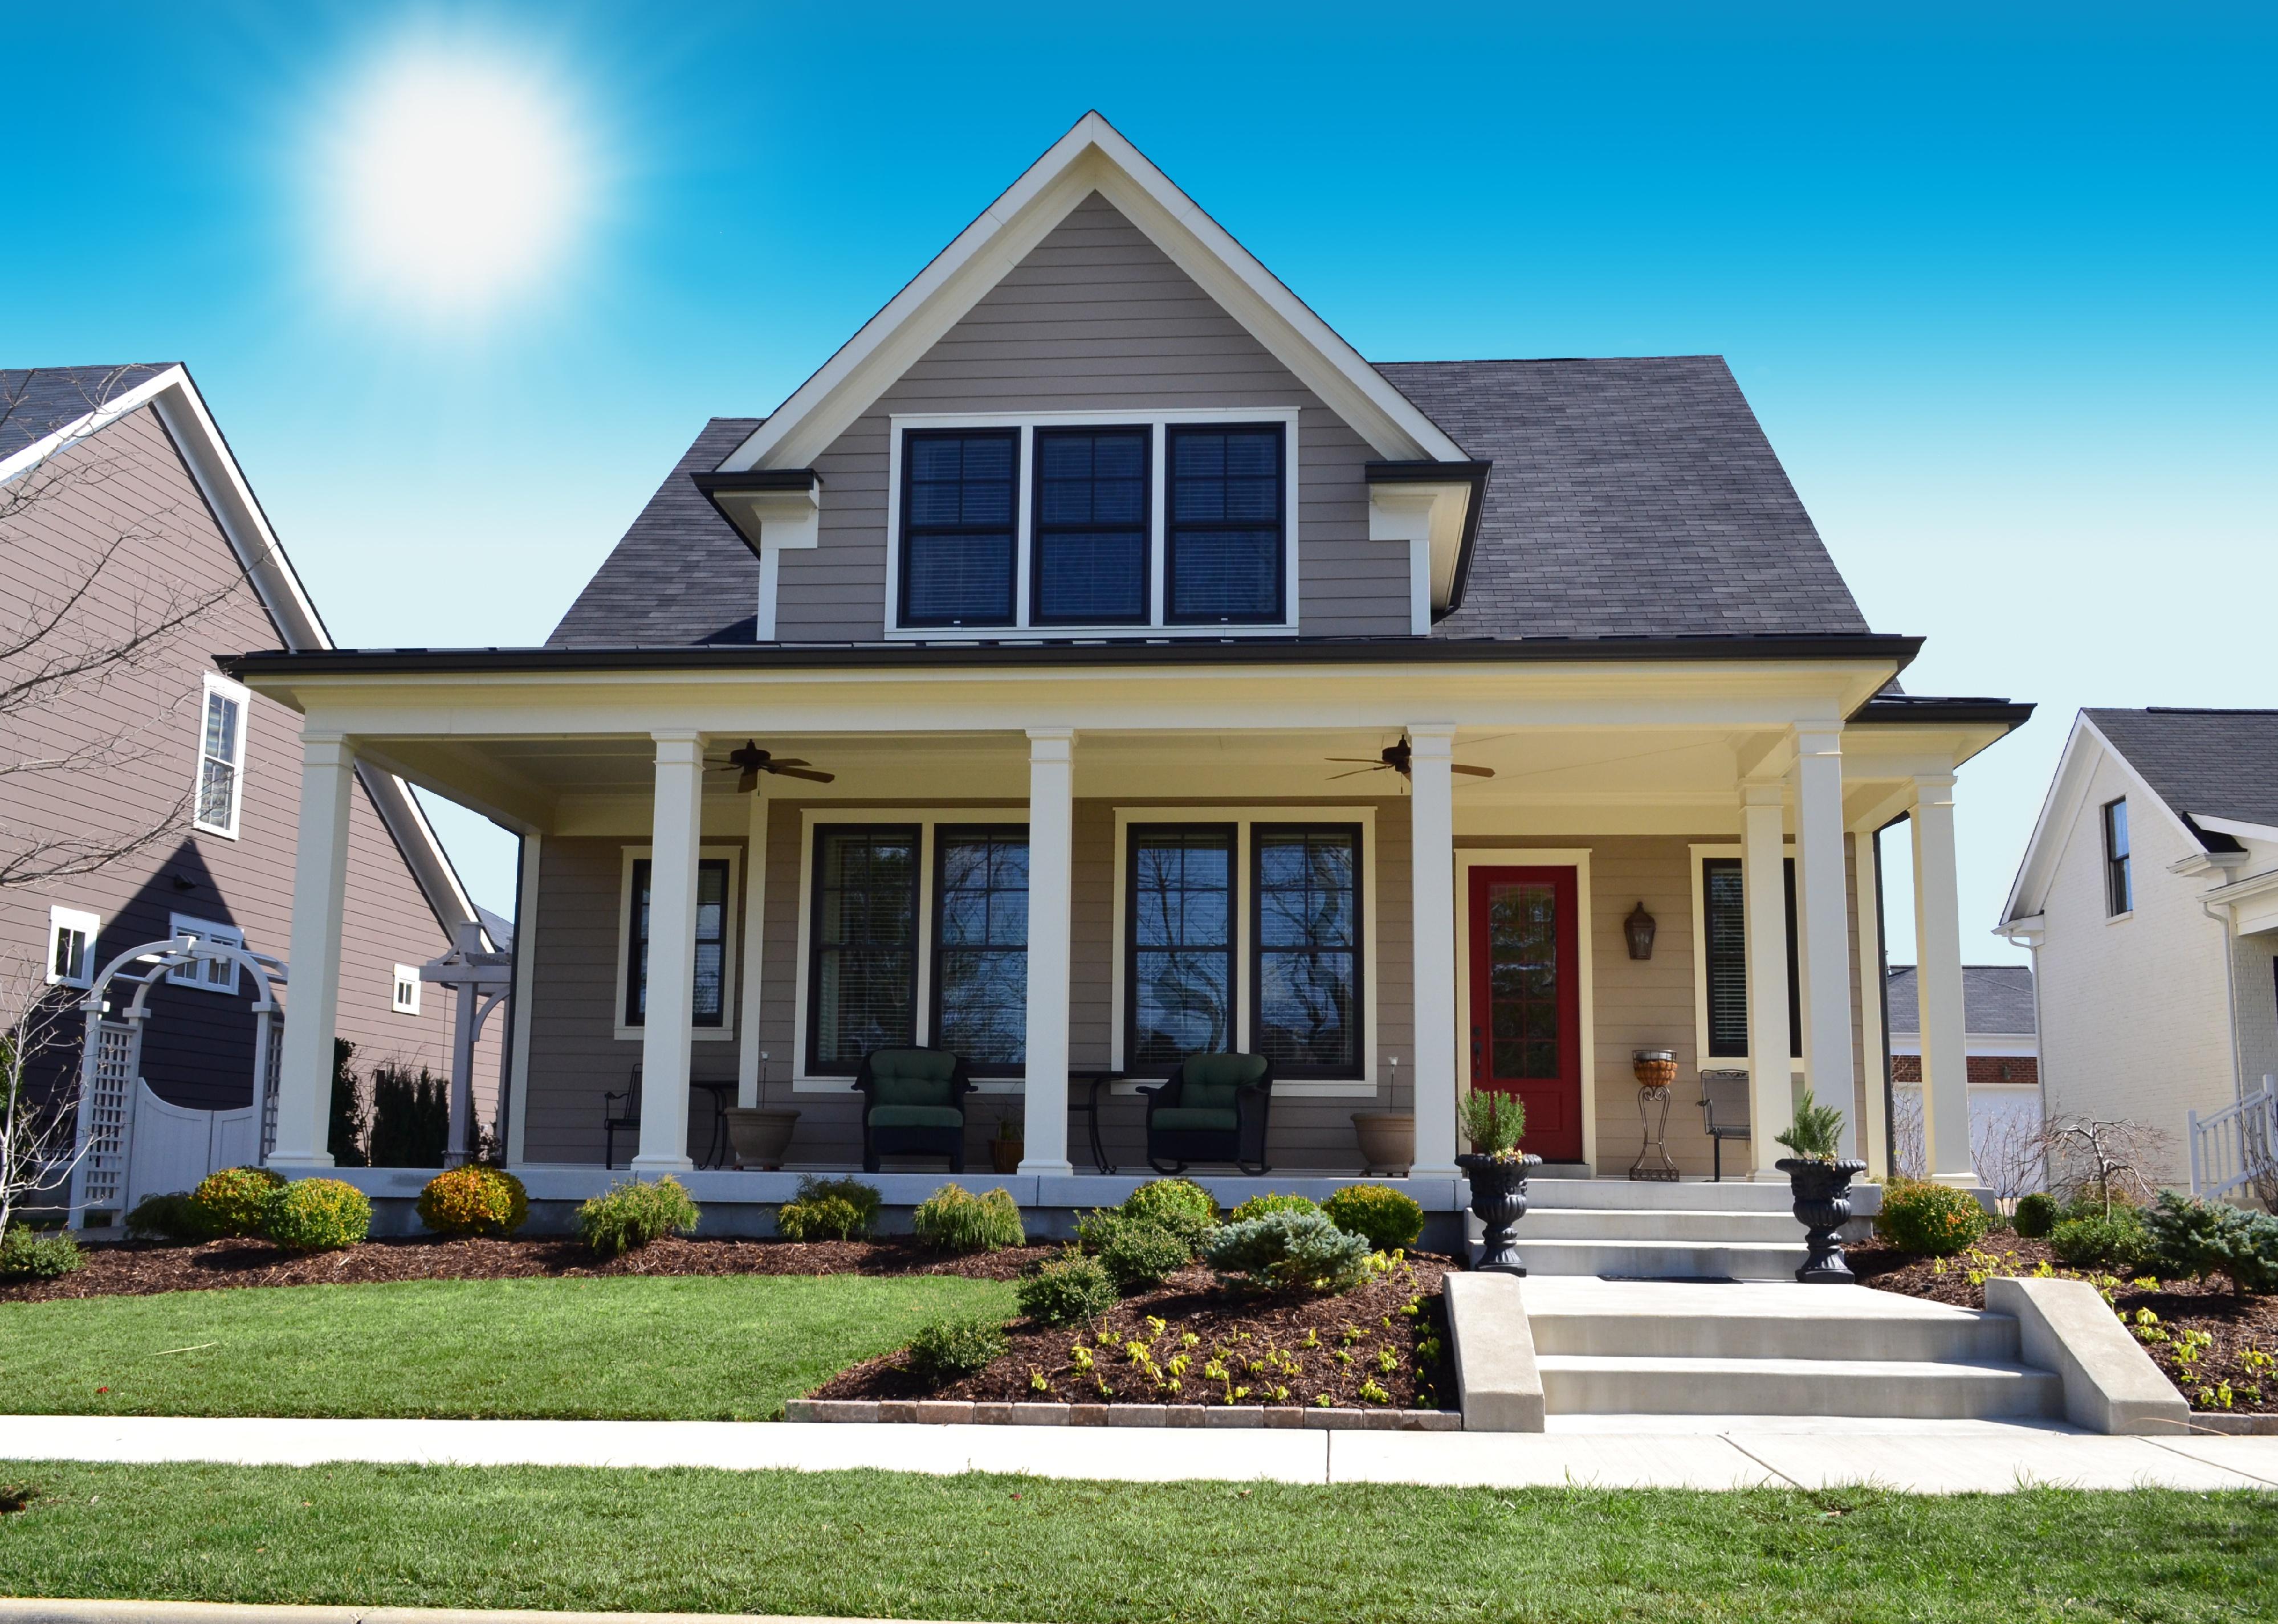
Overall, building to rent has proven popular amongst consumers. Though homeownership is often touted as a financial investment, renting does not carry the same financial liability of home upkeep and debt, not to mention the responsibility for funding a down payment or taking out a 30-year mortgage.
Builders and their investors have turned to building communities of single-family homes in large batches intended to be rented out since the housing crisis in the late 2000s. It's a trend they've leaned into even harder during the COVID-19 pandemic as demand for larger dwellings further away from urban centers has boomed.


