States with the most foreclosures
Foreclosure rates hit their lowest level in nearly 13 years, dropping to 0.13% in the third quarter of 2018. In that time there were 177,146 foreclosure filings nationally on just over 134 million units of housing inventory.
The last time rates were this low was the fourth quarter of 2005, when loose residential mortgage lending and derivative securities exacerbated global exposure to the U.S. housing market. That era, characterized by products such as "NINJA" (no income, job, or assets) mortgages, eventually culminated in the financial crisis of 2007–2008 when nearly 8 million homes fell into foreclosure.
Lending standards have changed considerably since the buildup to 2007. These adjustments were driven in part by new regulations and the 2010 passage of the Dodd-Frank Act, which instituted new financial regulations including increased loan underwriting standards and the elimination of risky loan products. As 2018 sees the continuation of a nearly decade-long bull market and elements of Dodd-Frank being rolled back, it remains to be seen how the housing market will fare.
To determine which states are seeing the highest levels of foreclosure activity, Stacker analyzed quarterly housing figures from ATTOM Data Solutions and ranked the data by the rate of foreclosure filings over total housing units in the third quarter of 2018. Data comes from more than 2,200 counties and represents more than 90% of the U.S. population.
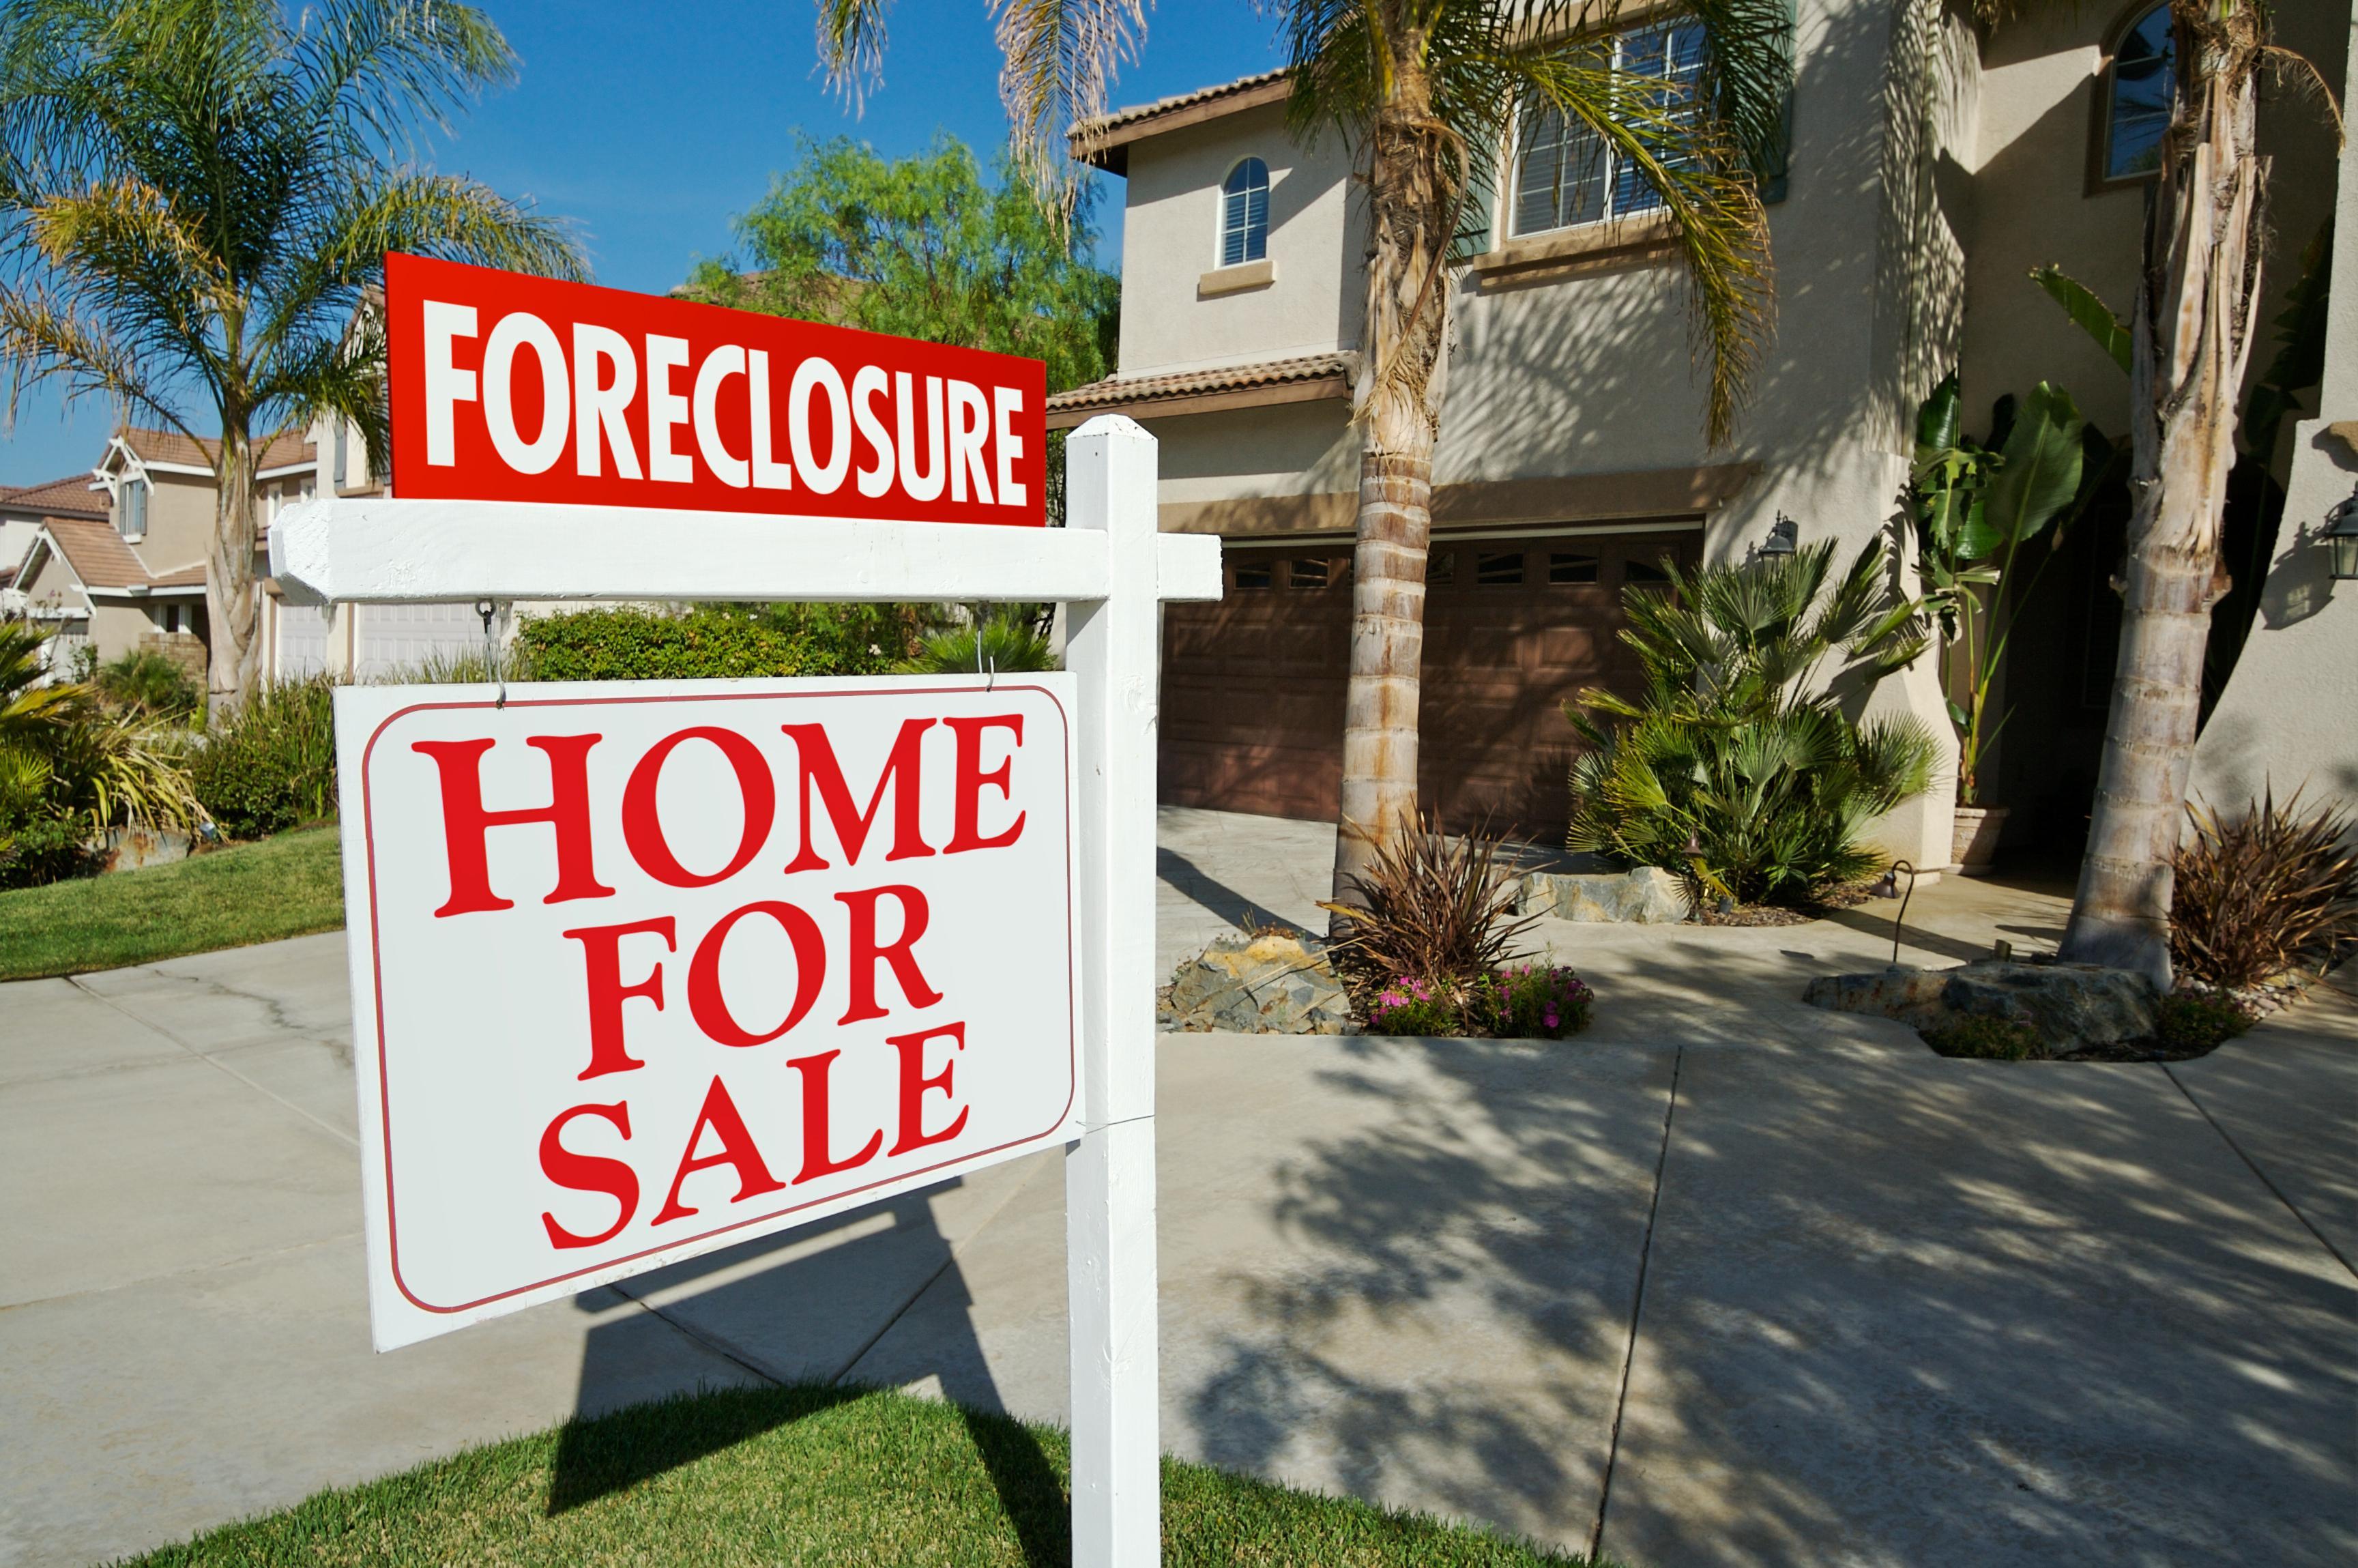
Read on to find out where your state ranks on the list.
RELATED: Top 100 cities for raising a family
#50. South Dakota
Foreclosure rate: 0.02% (1 in 6,262 houses), 87.9% below the national average
Total housing units: 372,281
Properties with foreclosure filings: 60
One-year change in foreclosure filings: -17.8%
#49. North Dakota
Foreclosure rate: 0.02% (1 in 6,134 houses), 87.7% below the national average
Total housing units: 350,134
Properties with foreclosure filings: 57
One-year change in foreclosure filings: -1.7%
#48. Montana
Foreclosure rate: 0.03% (1 in 3,322 houses), 77.2% below the national average
Total housing units: 491,439
Properties with foreclosure filings: 148
One-year change in foreclosure filings: -0.7%
#47. West Virginia
Foreclosure rate: 0.04% (1 in 2,782 houses), 72.8% below the national average
Total housing units: 884,728
Properties with foreclosure filings: 318
One-year change in foreclosure filings: 32.5%
#46. Vermont
Foreclosure rate: 0.04% (1 in 2,679 houses), 71.8% below the national average
Total housing units: 326,812
Properties with foreclosure filings: 122
One-year change in foreclosure filings: 2.5%
#45. Idaho
Foreclosure rate: 0.05% (1 in 1,942 houses), 61% below the national average
Total housing units: 686,013
Properties with foreclosure filings: 353
One-year change in foreclosure filings: 15%
#44. Washington
Foreclosure rate: 0.05% (1 in 1,845 houses), 59% below the national average
Total housing units: 2,966,814
Properties with foreclosure filings: 1,608
One-year change in foreclosure filings: -2.4%
#43. Nebraska
Foreclosure rate: 0.06% (1 in 1,780 houses), 57.5% below the national average
Total housing units: 815,006
Properties with foreclosure filings: 458
One-year change in foreclosure filings: -27.6%
#42. Mississippi
Foreclosure rate: 0.06% (1 in 1,678 houses), 54.9% below the national average
Total housing units: 1,295,242
Properties with foreclosure filings: 772
One-year change in foreclosure filings: -0.1%
#41. New Hampshire
Foreclosure rate: 0.06% (1 in 1,601 houses), 52.7% below the national average
Total housing units: 620,729
Properties with foreclosure filings: 388
One-year change in foreclosure filings: -23%
#40. Colorado
Foreclosure rate: 0.06% (1 in 1,585 houses), 52.2% below the national average
Total housing units: 2,284,863
Properties with foreclosure filings: 1,442
One-year change in foreclosure filings: -6%
#39. Kansas
Foreclosure rate: 0.07% (1 in 1,538 houses), 50.8% below the national average
Total housing units: 1,248,955
Properties with foreclosure filings: 812
One-year change in foreclosure filings: -11.1%
#38. Minnesota
Foreclosure rate: 0.07% (1 in 1,493 houses), 49.3% below the national average
Total housing units: 2,382,855
Properties with foreclosure filings: 1,596
One-year change in foreclosure filings: 6.1%
#37. Arkansas
Foreclosure rate: 0.07% (1 in 1,434 houses), 47.2% below the national average
Total housing units: 1,341,391
Properties with foreclosure filings: 935
One-year change in foreclosure filings: -4.4%
#36. Michigan
Foreclosure rate: 0.07% (1 in 1,373 houses), 44.9% below the national average
Total housing units: 4,544,920
Properties with foreclosure filings: 3,311
One-year change in foreclosure filings: -35.1%
#35. Oregon
Foreclosure rate: 0.07% (1 in 1,369 houses), 44.7% below the national average
Total housing units: 1,706,290
Properties with foreclosure filings: 1,246
One-year change in foreclosure filings: -7.4%
#34. Wyoming
Foreclosure rate: 0.08% (1 in 1,299 houses), 41.8% below the national average
Total housing units: 267,987
Properties with foreclosure filings: 207
One-year change in foreclosure filings: 7.8%
#33. Hawaii
Foreclosure rate: 0.08% (1 in 1,213 houses), 37.6% below the national average
Total housing units: 530,289
Properties with foreclosure filings: 437
One-year change in foreclosure filings: 40.5%
#32. Kentucky
Foreclosure rate: 0.08% (1 in 1,192 houses), 36.5% below the national average
Total housing units: 1,951,090
Properties with foreclosure filings: 1,639
One-year change in foreclosure filings: -3.2%
#31. Rhode Island
Foreclosure rate: 0.09% (1 in 1,174 houses), 35.6% below the national average
Total housing units: 462,657
Properties with foreclosure filings: 394
One-year change in foreclosure filings: -3.7%
#30. Tennessee
Foreclosure rate: 0.09% (1 in 1,111 houses), 31.9% below the national average
Total housing units: 2,873,478
Properties with foreclosure filings: 2,584
One-year change in foreclosure filings: -10.6%
#29. Virginia
Foreclosure rate: 0.09% (1 in 1,060 houses), 28.6% below the national average
Total housing units: 3,445,357
Properties with foreclosure filings: 3,249
One-year change in foreclosure filings: -13.3%
#28. Arizona
Foreclosure rate: 0.09% (1 in 1,058 houses), 28.5% below the national average
Total housing units: 2,913,541
Properties with foreclosure filings: 2,755
One-year change in foreclosure filings: -12.2%
#27. Iowa
Foreclosure rate: 0.10% (1 in 1,049 houses), 27.9% below the national average
Total housing units: 1,362,619
Properties with foreclosure filings: 1,299
One-year change in foreclosure filings: -4.8%
#26. Missouri
Foreclosure rate: 0.10% (1 in 1,040 houses), 27.2% below the national average
Total housing units: 2,738,774
Properties with foreclosure filings: 2,634
One-year change in foreclosure filings: 2.2%
#25. Texas
Foreclosure rate: 0.10% (1 in 1,020 houses), 25.8% below the national average
Total housing units: 10,441,643
Properties with foreclosure filings: 10,232
One-year change in foreclosure filings: -14%
#24. Louisiana
Foreclosure rate: 0.10% (1 in 1,001 houses), 24.4% below the national average
Total housing units: 2,011,700
Properties with foreclosure filings: 2,009
One-year change in foreclosure filings: -3.1%
#23. Maine
Foreclosure rate: 0.10% (1 in 1,000 houses), 24.3% below the national average
Total housing units: 727,127
Properties with foreclosure filings: 726
One-year change in foreclosure filings: -4.1%
#22. Utah
Foreclosure rate: 0.10% (1 in 966 houses), 21.7% below the national average
Total housing units: 1,024,047
Properties with foreclosure filings: 1,058
One-year change in foreclosure filings: 8.4%
#21. Wisconsin
Foreclosure rate: 0.11% (1 in 917 houses), 17.4% below the national average
Total housing units: 2,649,597
Properties with foreclosure filings: 2,891
One-year change in foreclosure filings: 46.1%
#20. California
Foreclosure rate: 0.11% (1 in 889 houses), 14.8% below the national average
Total housing units: 13,911,737
Properties with foreclosure filings: 15,654
One-year change in foreclosure filings: -12.4%
#19. Alabama
Foreclosure rate: 0.11% (1 in 883 houses), 14.3% below the national average
Total housing units: 2,209,335
Properties with foreclosure filings: 2,502
One-year change in foreclosure filings: -16.2%
#18. Georgia
Foreclosure rate: 0.12% (1 in 844 houses), 10.4% below the national average
Total housing units: 4,156,518
Properties with foreclosure filings: 4,922
One-year change in foreclosure filings: 0.1%
#17. Alaska
Foreclosure rate: 0.12% (1 in 836 houses), 9.5% below the national average
Total housing units: 306,921
Properties with foreclosure filings: 367
One-year change in foreclosure filings: 18%
#16. Massachusetts
Foreclosure rate: 0.12% (1 in 810 houses), 6.6% below the national average
Total housing units: 2,836,658
Properties with foreclosure filings: 3,500
One-year change in foreclosure filings: -24%
#15. Oklahoma
Foreclosure rate: 0.13% (1 in 795 houses), 4.9% below the national average
Total housing units: 1,699,462
Properties with foreclosure filings: 2,137
One-year change in foreclosure filings: -19.1%
#14. North Carolina
Foreclosure rate: 0.13% (1 in 770 houses), 1.7% below the national average
Total housing units: 4,453,767
Properties with foreclosure filings: 5,783
One-year change in foreclosure filings: 0.1%
#13. Indiana
Foreclosure rate: 0.14% (1 in 733 houses), 3.2% above the national average
Total housing units: 2,830,669
Properties with foreclosure filings: 3,862
One-year change in foreclosure filings: -10.1%
#12. Pennsylvania
Foreclosure rate: 0.14% (1 in 717 houses), 5.6% above the national average
Total housing units: 5,592,175
Properties with foreclosure filings: 7,804
One-year change in foreclosure filings: -6.2%
#11. New York
Foreclosure rate: 0.14% (1 in 700 houses), 8.2% above the national average
Total housing units: 8,191,568
Properties with foreclosure filings: 11,710
One-year change in foreclosure filings: -1.9%
#10. New Mexico
Foreclosure rate: 0.17% (1 in 597 houses), 26.8% above the national average
Total housing units: 912,445
Properties with foreclosure filings: 1,527
One-year change in foreclosure filings: -11.5%
#9. Ohio
Foreclosure rate: 0.17% (1 in 579 houses), 30.7% above the national average
Total housing units: 5,146,944
Properties with foreclosure filings: 8,889
One-year change in foreclosure filings: -6.3%
#8. South Carolina
Foreclosure rate: 0.18% (1 in 544 houses), 39.1% above the national average
Total housing units: 2,192,041
Properties with foreclosure filings: 4,028
One-year change in foreclosure filings: -8.1%
#7. Illinois
Foreclosure rate: 0.21% (1 in 475 houses), 59.2% above the national average
Total housing units: 5,310,327
Properties with foreclosure filings: 11,169
One-year change in foreclosure filings: -7%
#6. Connecticut
Foreclosure rate: 0.21% (1 in 475 houses), 59.3% above the national average
Total housing units: 1,493,798
Properties with foreclosure filings: 3,145
One-year change in foreclosure filings: -8.5%
#5. Nevada
Foreclosure rate: 0.21% (1 in 472 houses), 60.3% above the national average
Total housing units: 1,200,517
Properties with foreclosure filings: 2,543
One-year change in foreclosure filings: 10%
#4. Florida
Foreclosure rate: 0.22% (1 in 449 houses), 68.5% above the national average
Total housing units: 9,152,815
Properties with foreclosure filings: 20,382
One-year change in foreclosure filings: 7.3%
#3. Maryland
Foreclosure rate: 0.26% (1 in 379 houses), 99.7% above the national average
Total housing units: 2,421,909
Properties with foreclosure filings: 6,390
One-year change in foreclosure filings: -6%
#2. Delaware
Foreclosure rate: 0.32% (1 in 315 houses), 140.3% above the national average
Total housing units: 417,927
Properties with foreclosure filings: 1,327
One-year change in foreclosure filings: 11.8%
#1. New Jersey
Foreclosure rate: 0.37% (1 in 267 houses), 183.6% above the national average
Total housing units: 3,586,442
Properties with foreclosure filings: 13,443
One-year change in foreclosure filings: -7.9%


