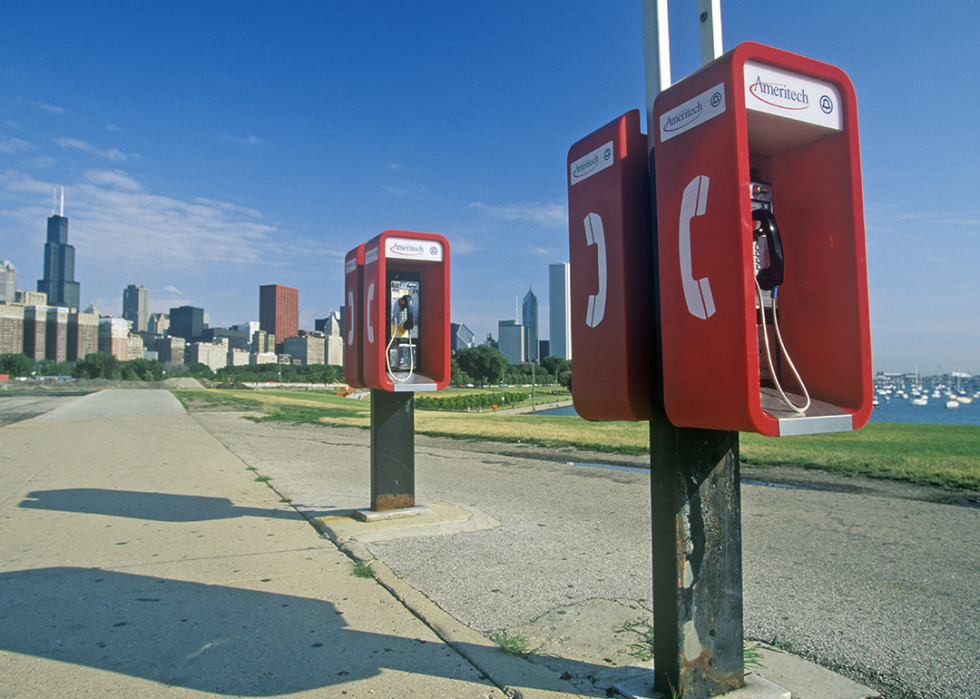
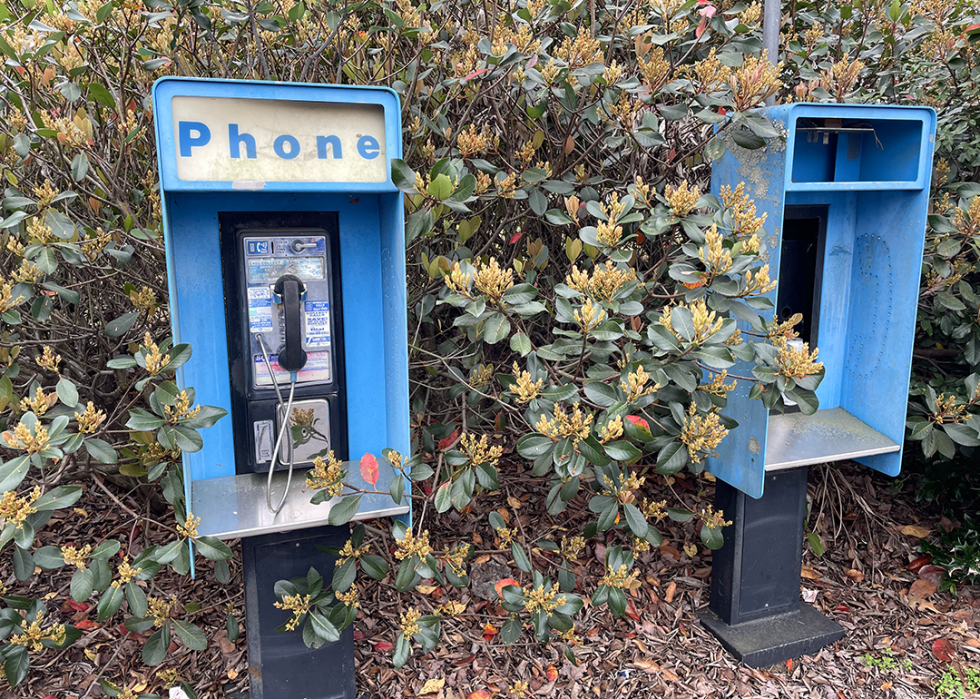
The decline of pay phones in every state
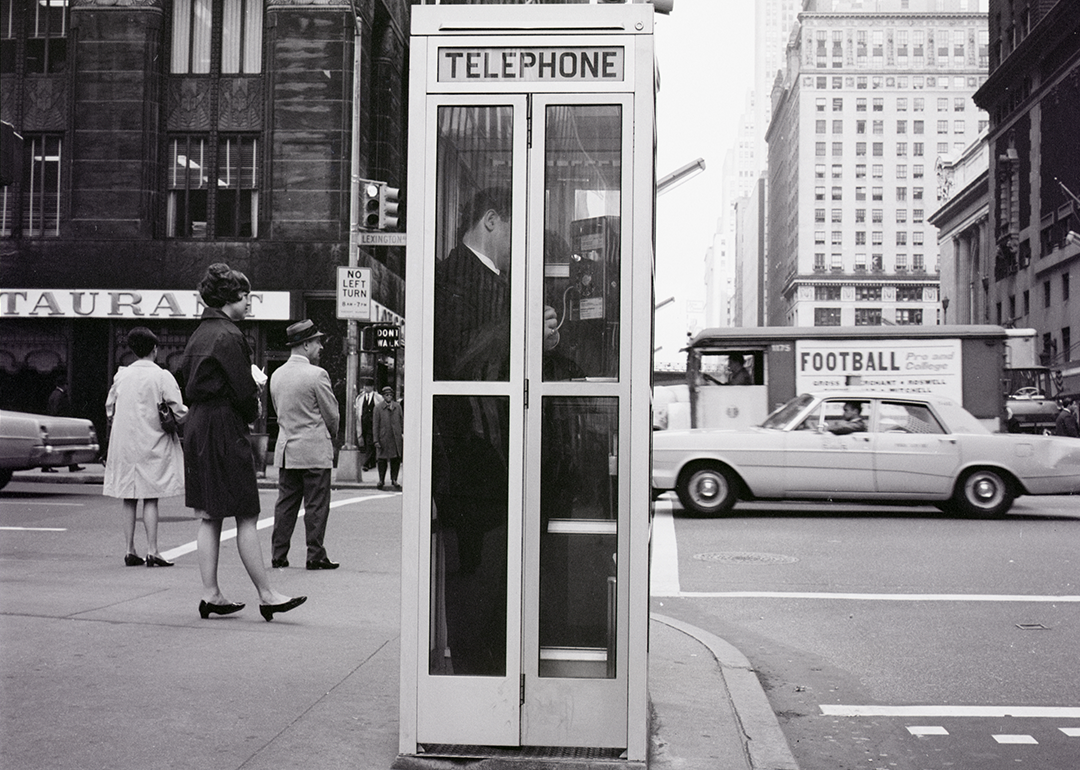
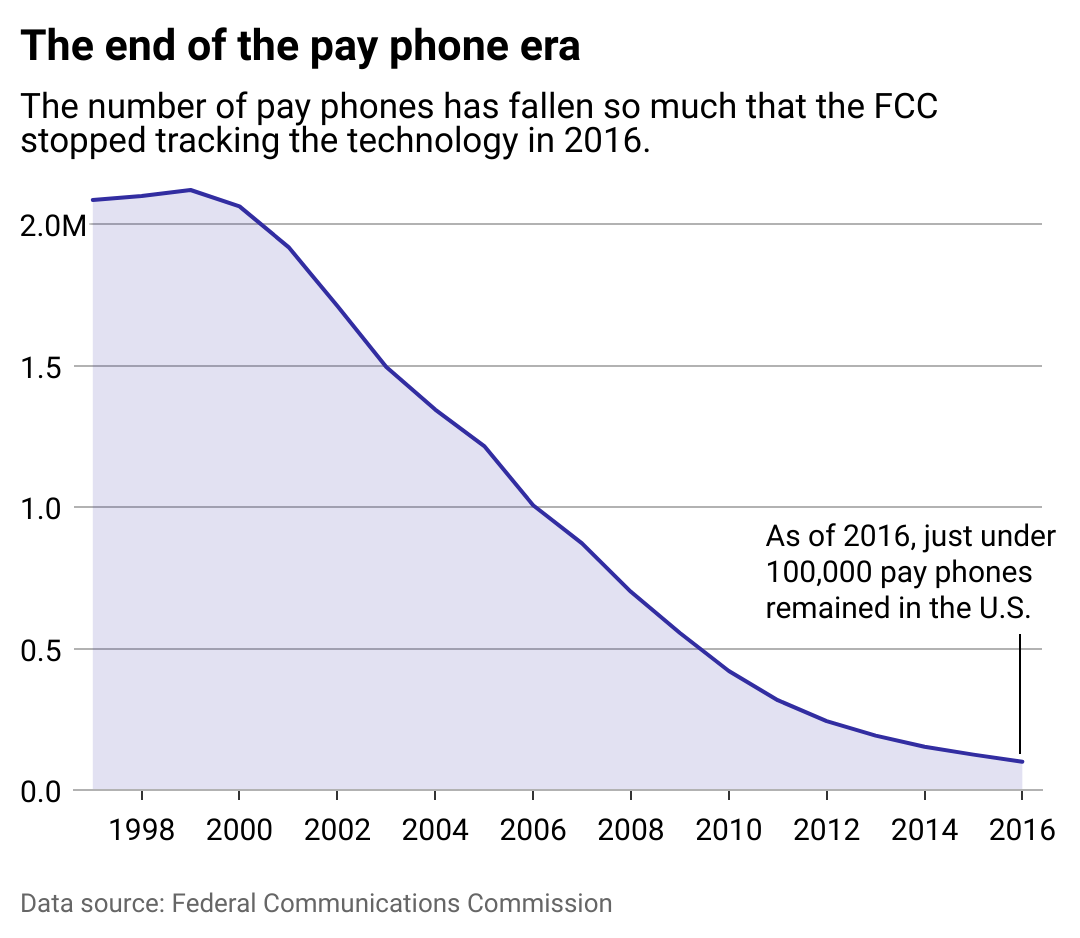
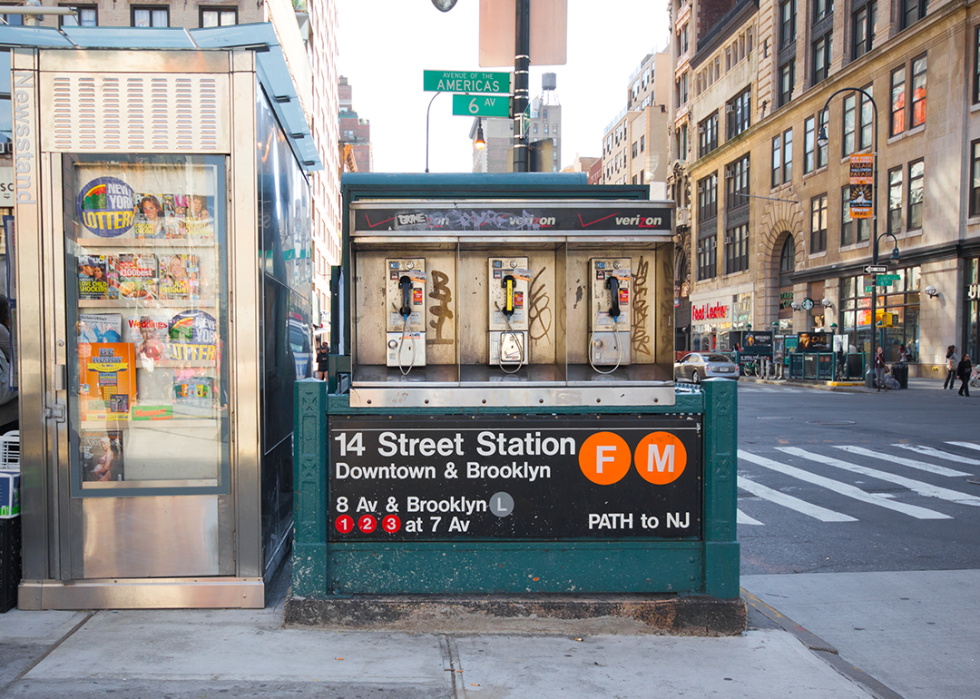
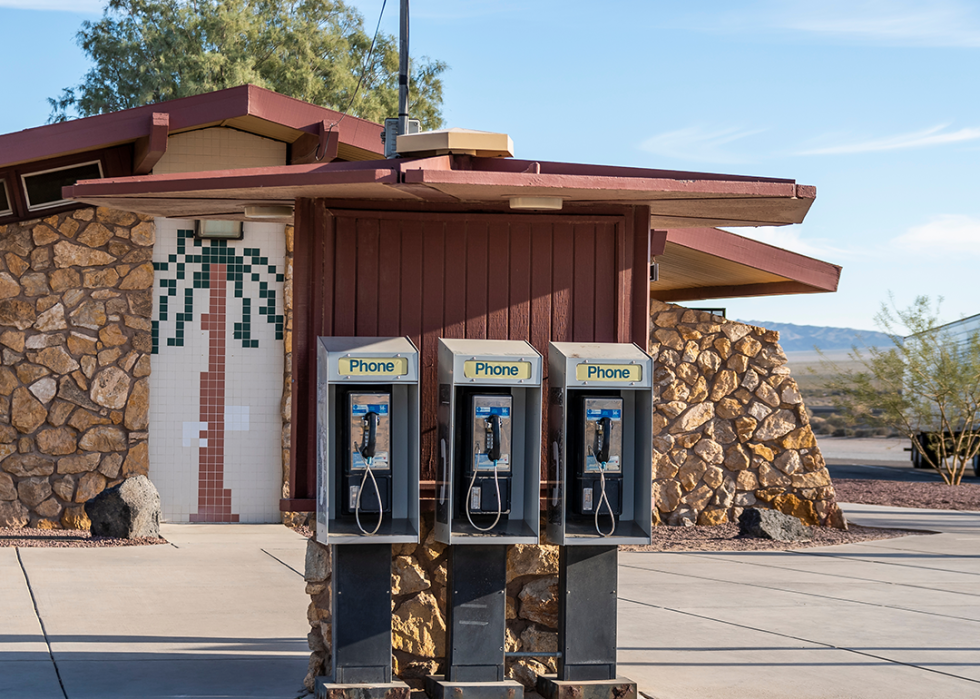
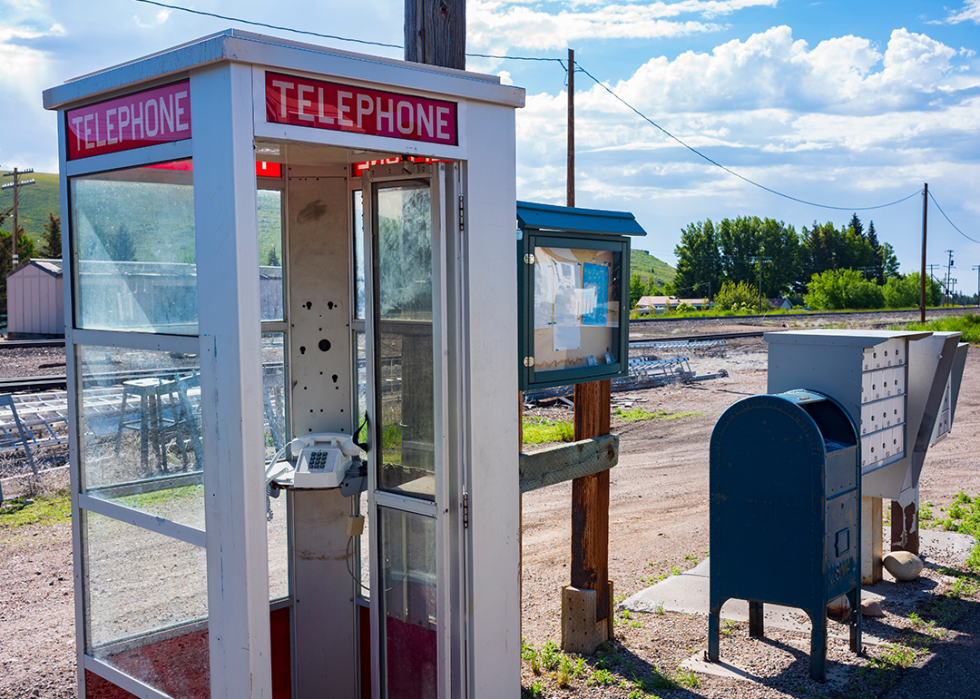
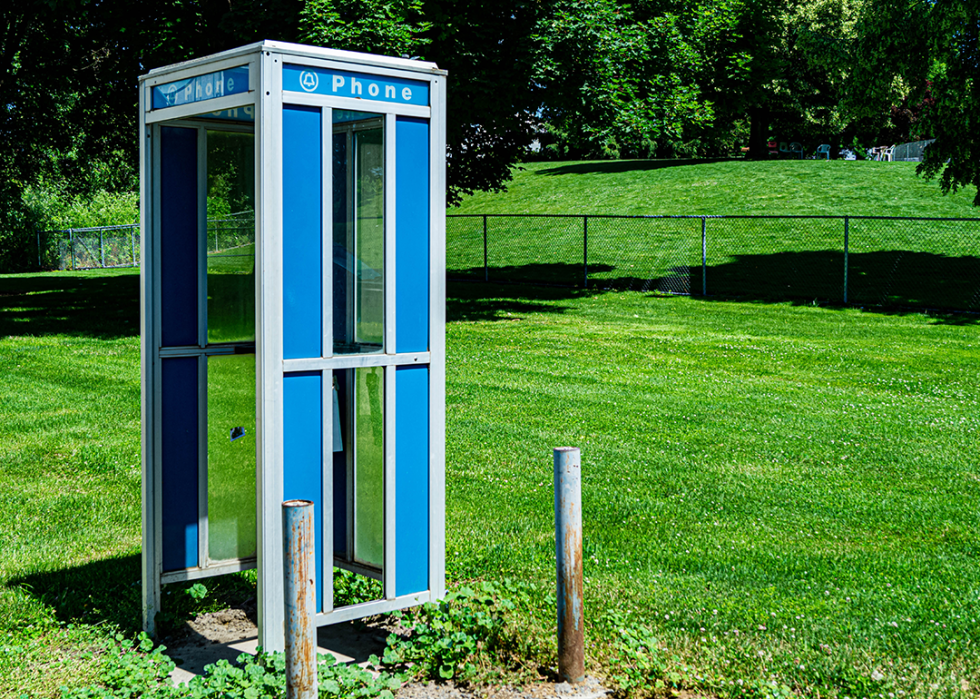
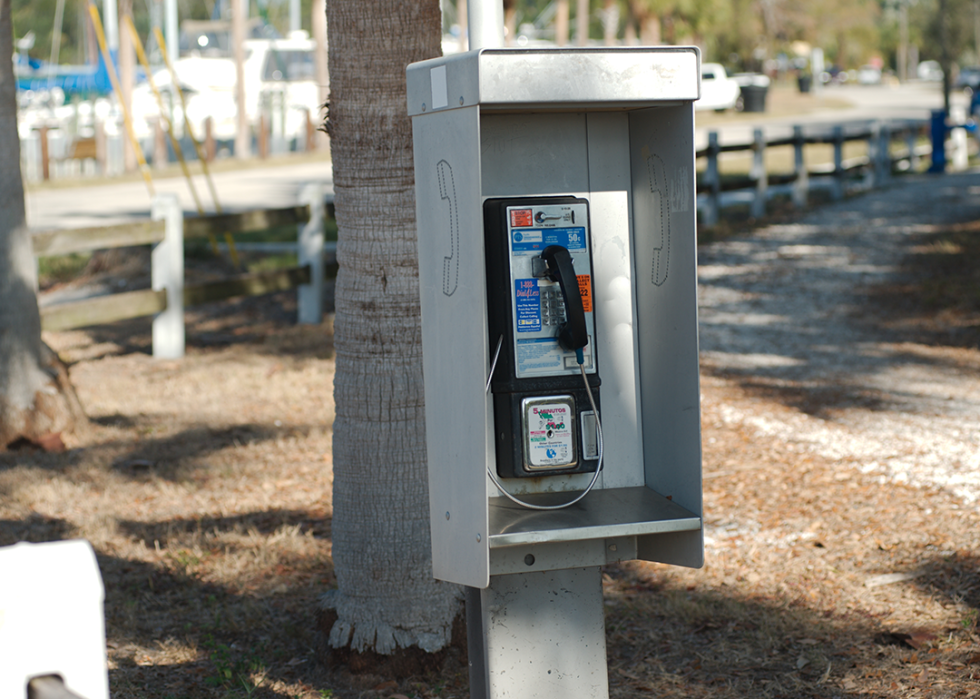
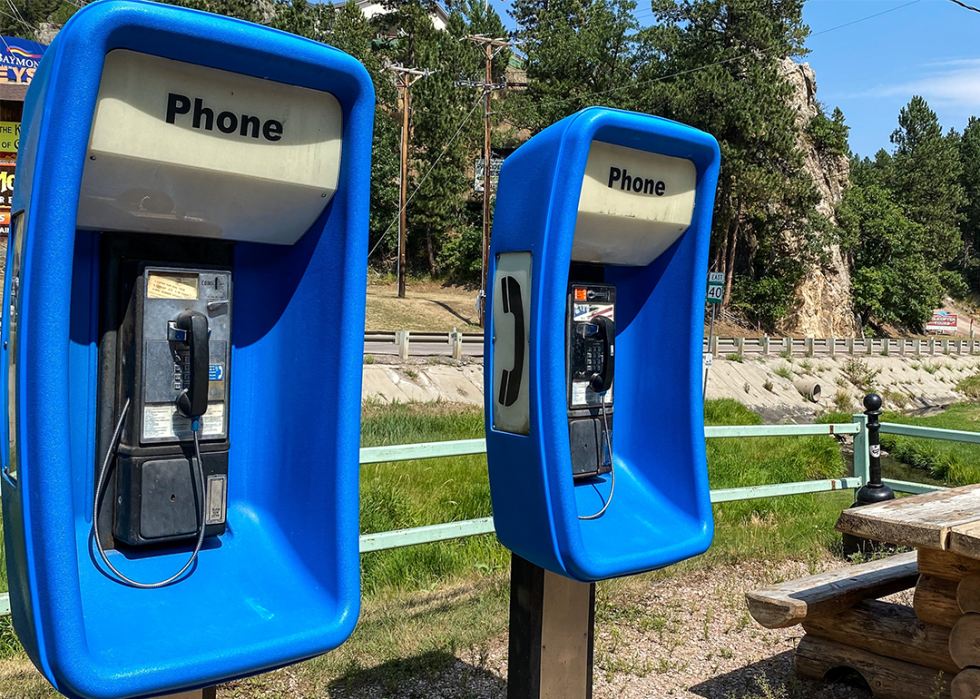
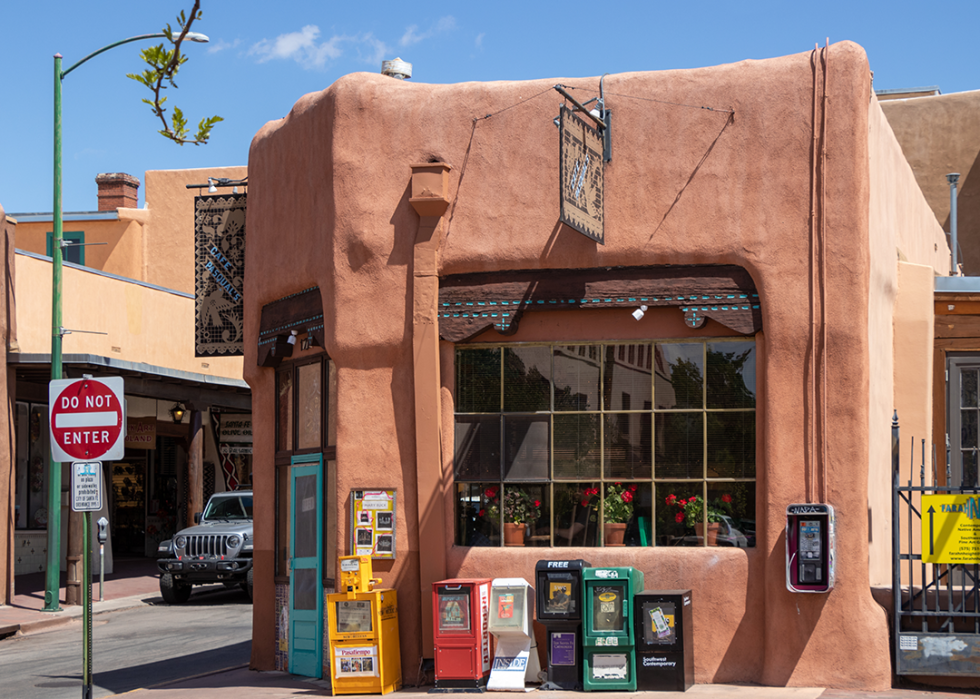
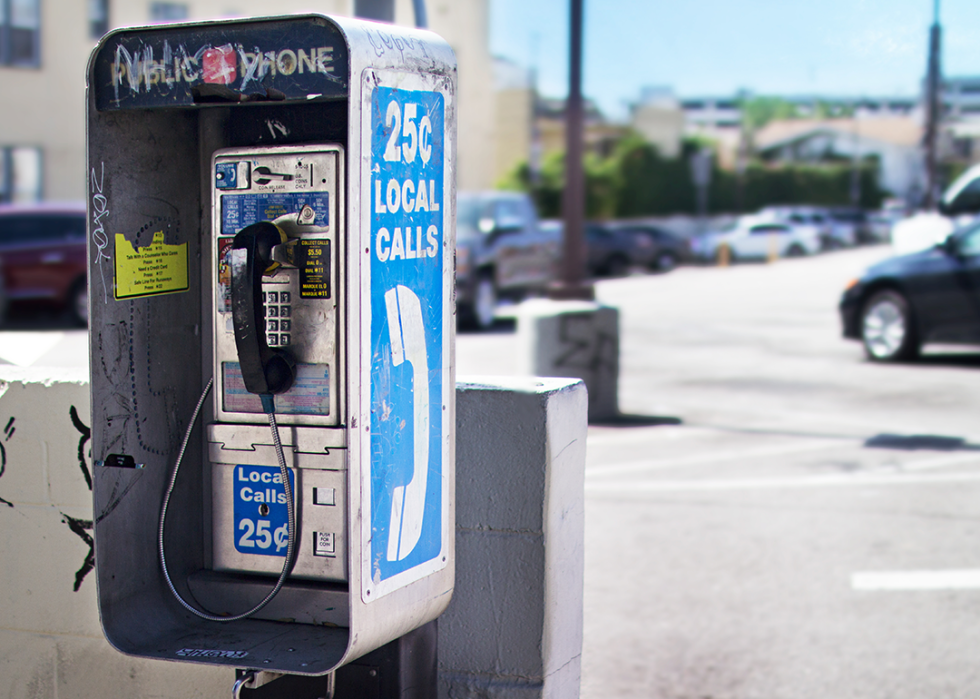
There were over 2.1 million pay phones in the U.S. at their peak in 1999, but now the technology is mostly relegated to nostalgia. Few wall-mounted pay phones linger in strip malls, and the silver and blue phone booths are mostly gone from the busy streets they once dotted in many parts of the U.S. Pay phones have become so rare that the FCC stopped requiring audits of them in 2018.
Spokeo used data from the Federal Communications Commission to explore the fall of pay phones across the United States. States are ranked by the percentage decline in the number of pay phones between 2000 and 2016. For ties, the number of pay phones remaining in the state was next used to rank.
Though no longer updated, the available data paints a picture of the pay phone's sharp decline.
The disappearance of this once-ubiquitous technology makes sense. According to the Pew Research Center, about 98% of U.S. adults own a cellphone today, most of whom specifically own smartphones.
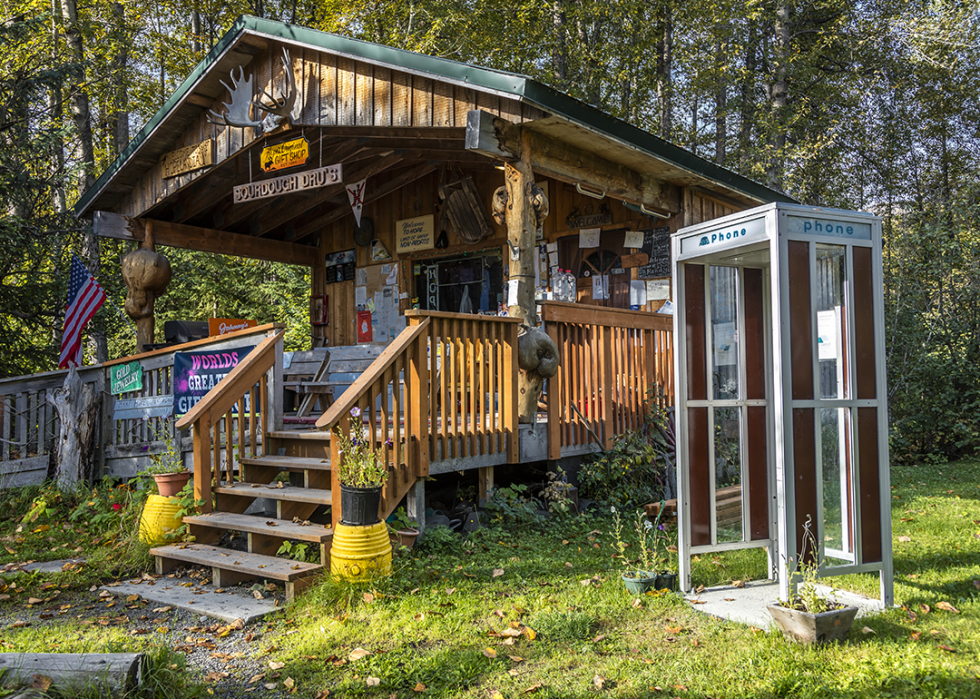
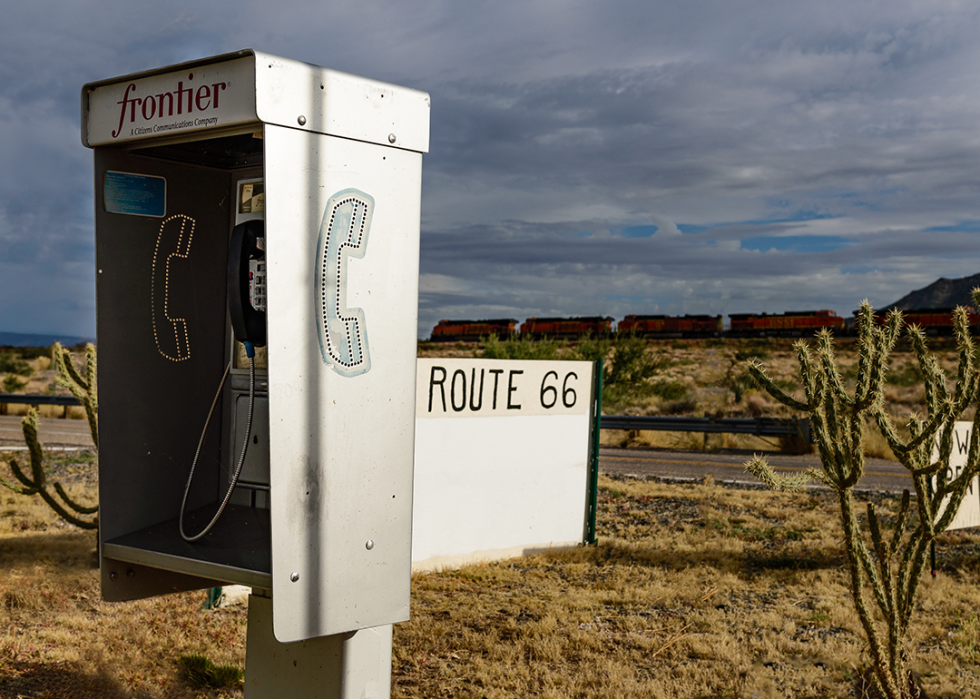
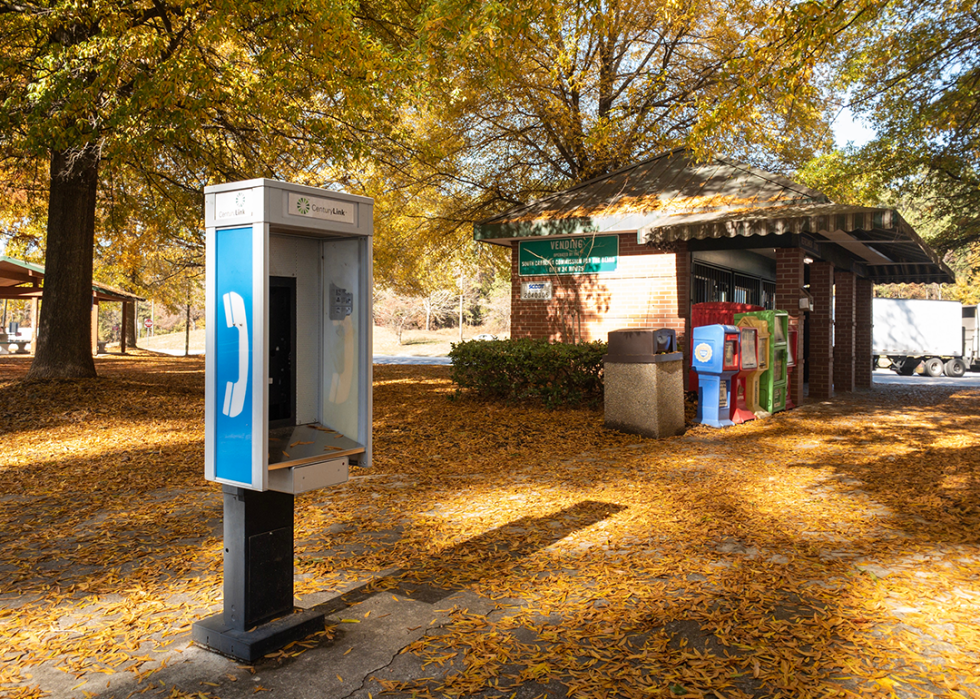
Pay phones can be especially useful in areas where cell service falls short. These include national parks, certain hospitals, and around the U.S. border. Pay phone connections can also hold steady when natural disasters disrupt cell service, and operators report increased usage during disasters.
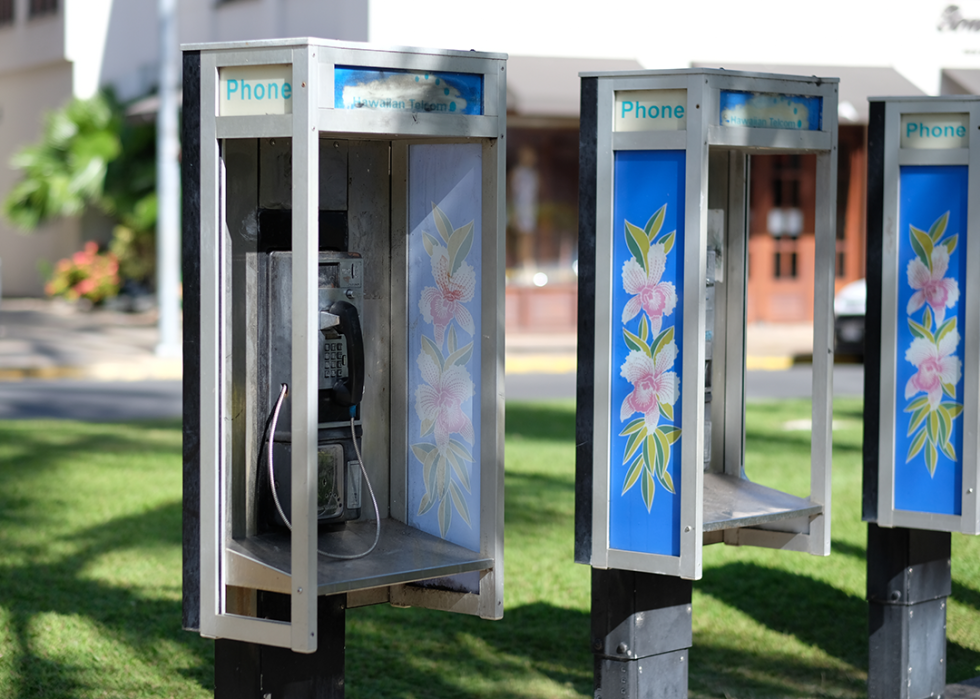
Most states saw the number of pay phones decline by over 90% between 2000 and 2016, but one outlier stood out: Hawai'i. The island state saw the number of pay phones drop by about 60%. A spokesperson for Hawaiian Telcom, the leading pay phone operator in the state, told the Honolulu Civil Beat that national trends may simply be taking longer to play out.
Other telecommunications experts think tourism plays a role as international travelers visiting the state may find it cheaper to make a pay phone call than pay mobile fees for calling from the U.S. Based on International Trade Association data, and relative to its residential population, Hawai'i has the highest number of international travelers, receiving about 67 global visitors for every 100 residents in 2022.