How US renewable energy adoption compares to other major emitters
This story originally appeared on OhmConnect and was produced and distributed in partnership with Stacker Studio.
How US renewable energy adoption compares to other major emitters
The Intergovernmental Panel on Climate Change issued a critical report in 2018 that outlined the immediate mitigation efforts needed to limit the rise of global temperatures to 1.5 degrees Celsius or less—the temperature after which climate disruptions are likely to become much more severe. The report highlighted the need for global human-caused carbon dioxide emissions to fall by 45% by 2030 and to reach net zero by 2050 to stay beneath this threshold.
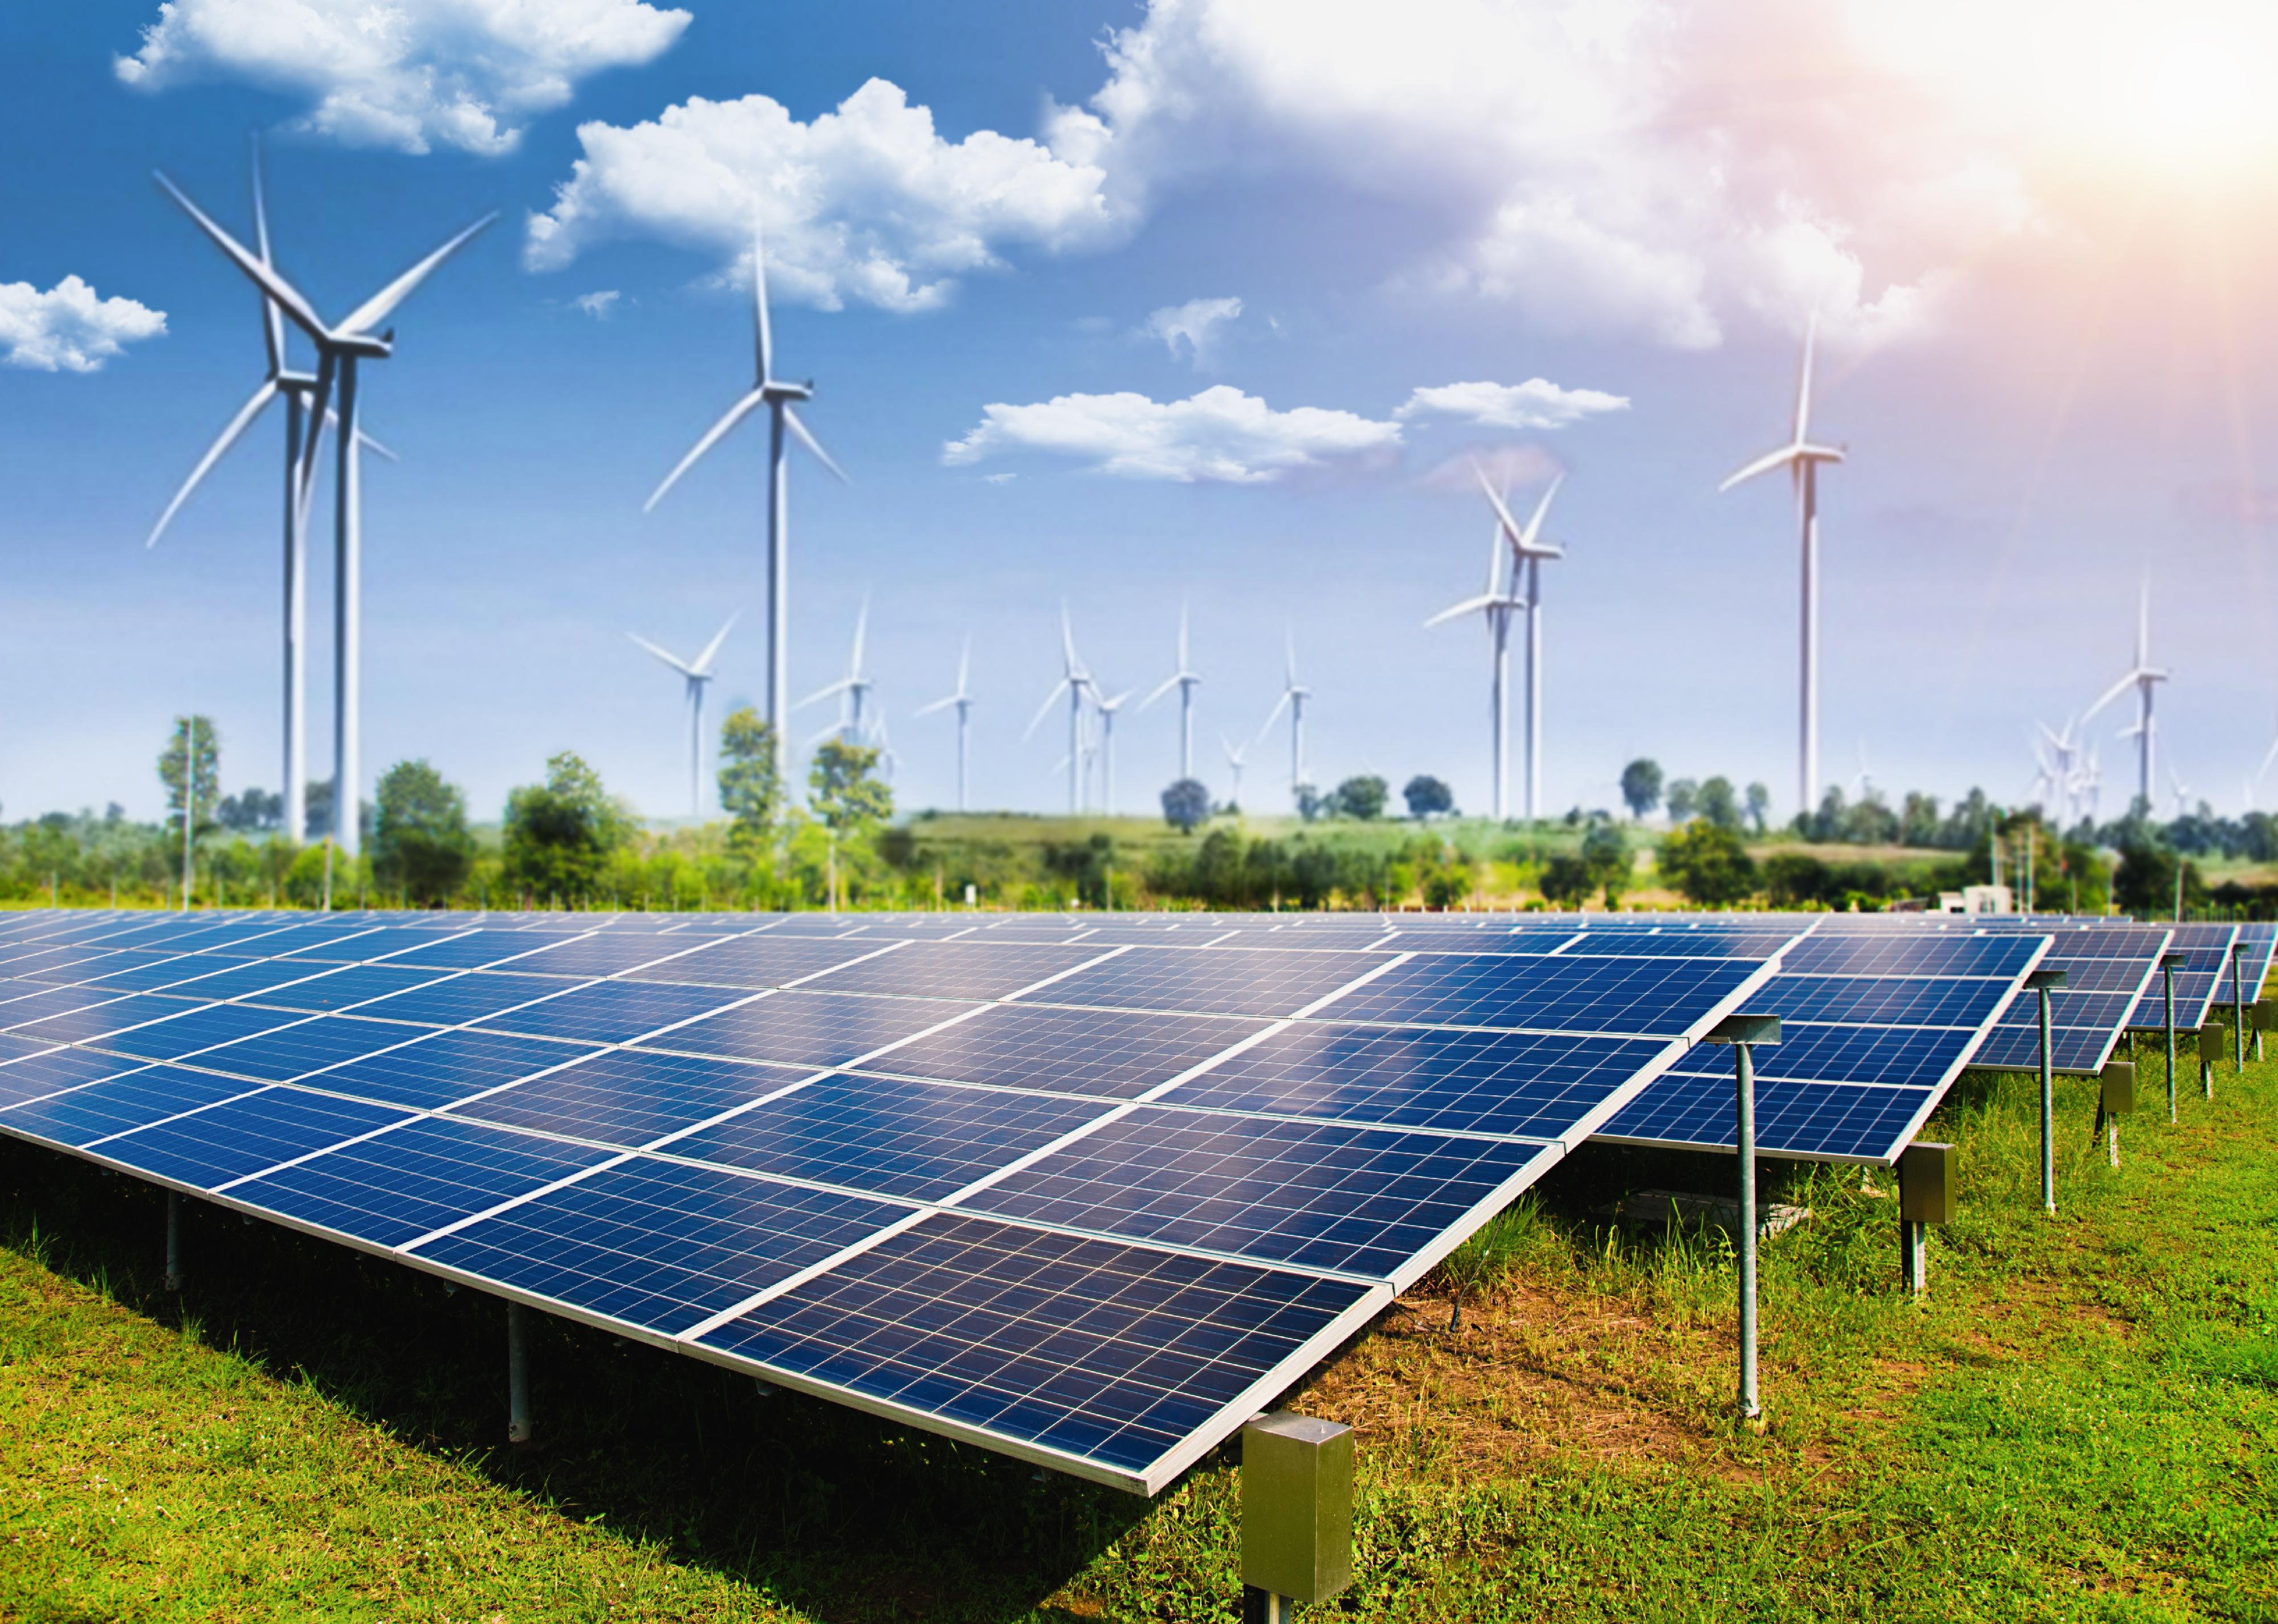
Between 2015 and 2018, the U.S. saw a rise in the consumption of renewable forms of energy, such as hydroelectric power, solar, wind, wood biomass, and biofuels. Overall, renewable energy source usage rose by nearly 1.7 quadrillion heat units (known as Btu). To put this in perspective, the average 2,000-square-foot home in the Miami metropolitan area—which sits in one of the warmest climate zones in the country—requires approximately 70,000 Btu to run its central heating system; colder climate areas like Minnesota and Maine require far more. (When it comes to air conditioning, the U.S. Department of Energy generally estimates it takes 20 Btu for every square foot that needs to be cooled).
On Aug. 16, President Joe Biden signed The Inflation Reduction Act. In addition to targeting areas such as deficit reduction, prescription drug pricing, and access to health care, lawmakers designed the act to help reshape the U.S. energy industry by providing more access to fossil fuel alternatives. The act aims to place the U.S. on a path to a 40% reduction in greenhouse gas emissions by 2030. Reaching this goal would bring the country closer to the 50-52% reduction threshold outlined in the Paris Agreement, which the U.S. rejoined in 2021 after a brief absence during the Trump administration.
While such strides are undoubtedly commendable, how does the U.S. stack up against other nations investing in renewable energy? Citing data from the Energy Information Administration and International Energy Agency, OhmConnect broke down how renewable energy adoption in the U.S. compares to other major emitters.
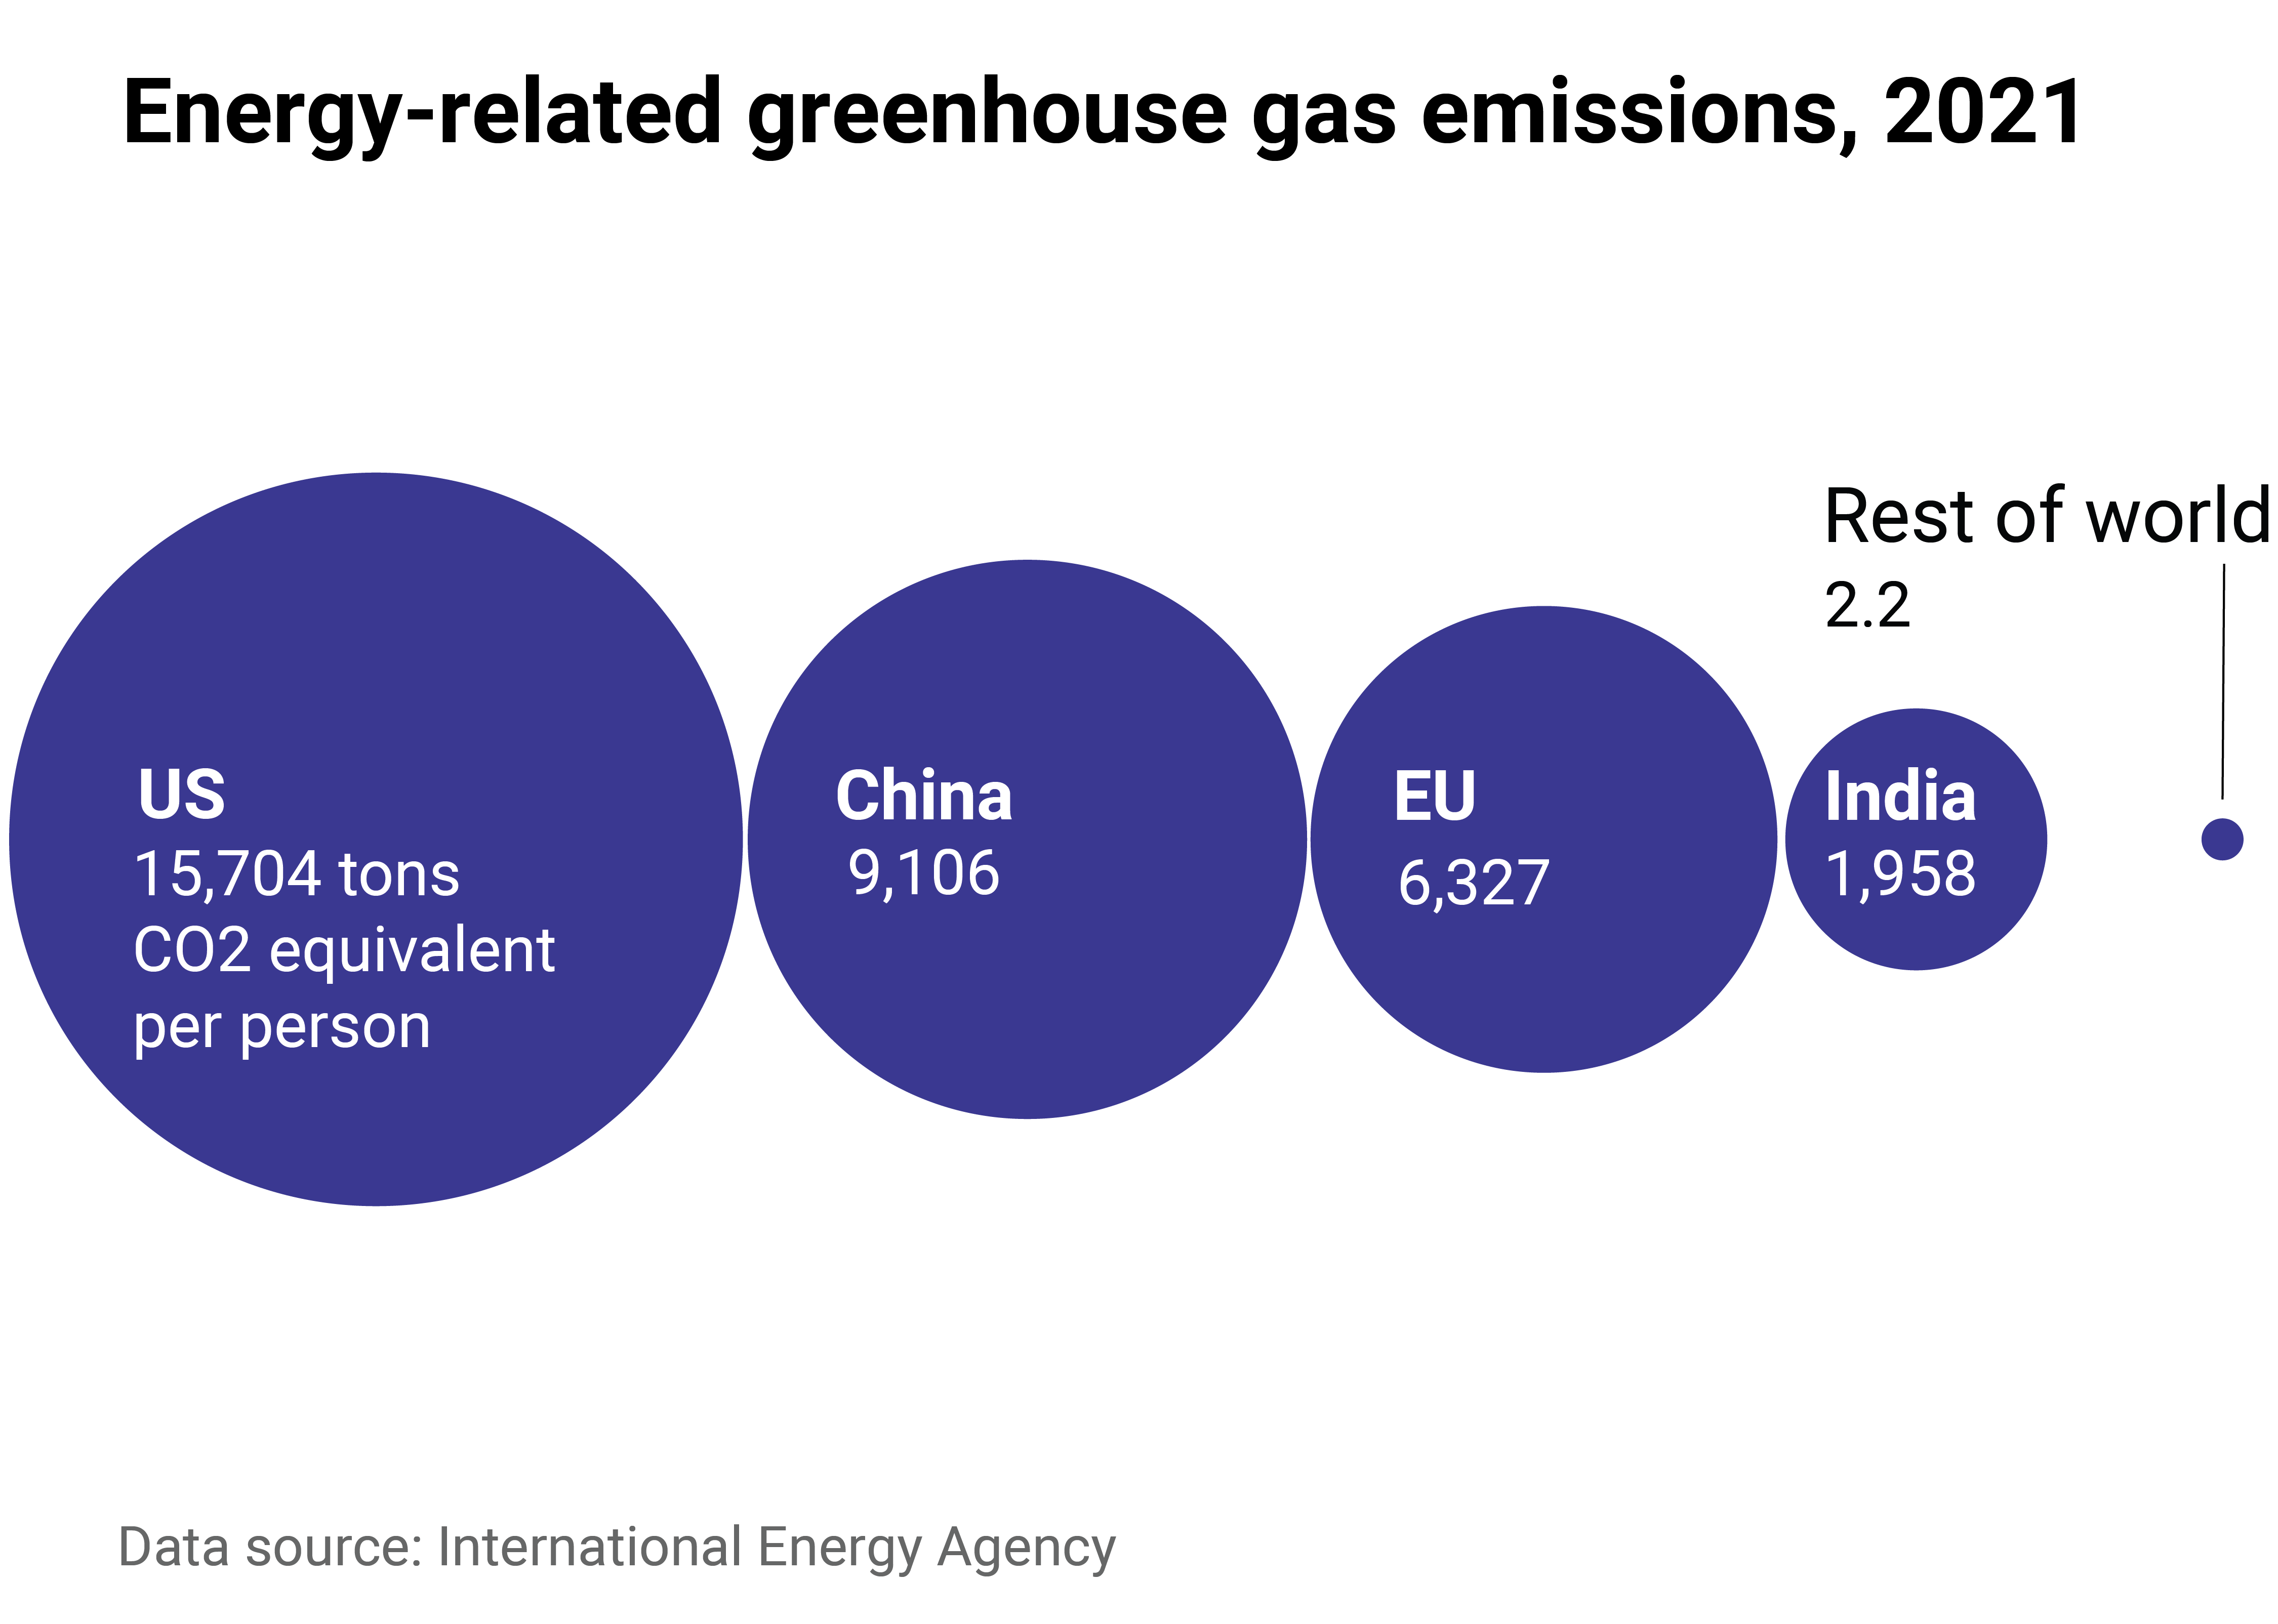
The US, China, EU, and India accounted for 58% of global greenhouse gas emissions from energy in 2021
In the U.S., most greenhouse gas emissions come from burning fossil fuels for energy use. In 2021, the sources of total annual energy-related carbon dioxide emissions for the U.S. included petroleum (46%), natural gas (34%), and coal (21%).
In China, the primary CO2 emissions source is coal. The majority of energy (55%) that China generated in 2021 came from coal—and given that coal is carbon-rich, burning it in boilers, industrial plants, and power plants in China releases large amounts of CO2. However, the country has made strides toward reducing its reliance on coal in recent years— 70% of energy came from coal in 2001—though fossil fuels still make up the lion's share of energy consumption overall. Most recently, the country's overall CO2 emissions have begun to trend downward. In the three fiscal quarters leading up to Q1 2022, emissions have gone down after steady rises in the previous five quarters.
In the European Union, greenhouse gas emissions have dropped 31% since 1990, though this figure does not put the EU on track to meet its 2030 target. Power stations, industrial and large-scale heating plants, and aviation remain the top CO2 culprits.
And in India, the significant sources of carbon emissions include coal power plants, the cattle industry, and rice processing plants. After China, India is the second largest consumer of coal in the world and the third largest single-nation emitter of CO2. Renewable energy sources such as wind and solar have yet to catch on in India; however, the country has set benchmarks to increase natural gas use to improve its reliance on cleaner-burning fuels.
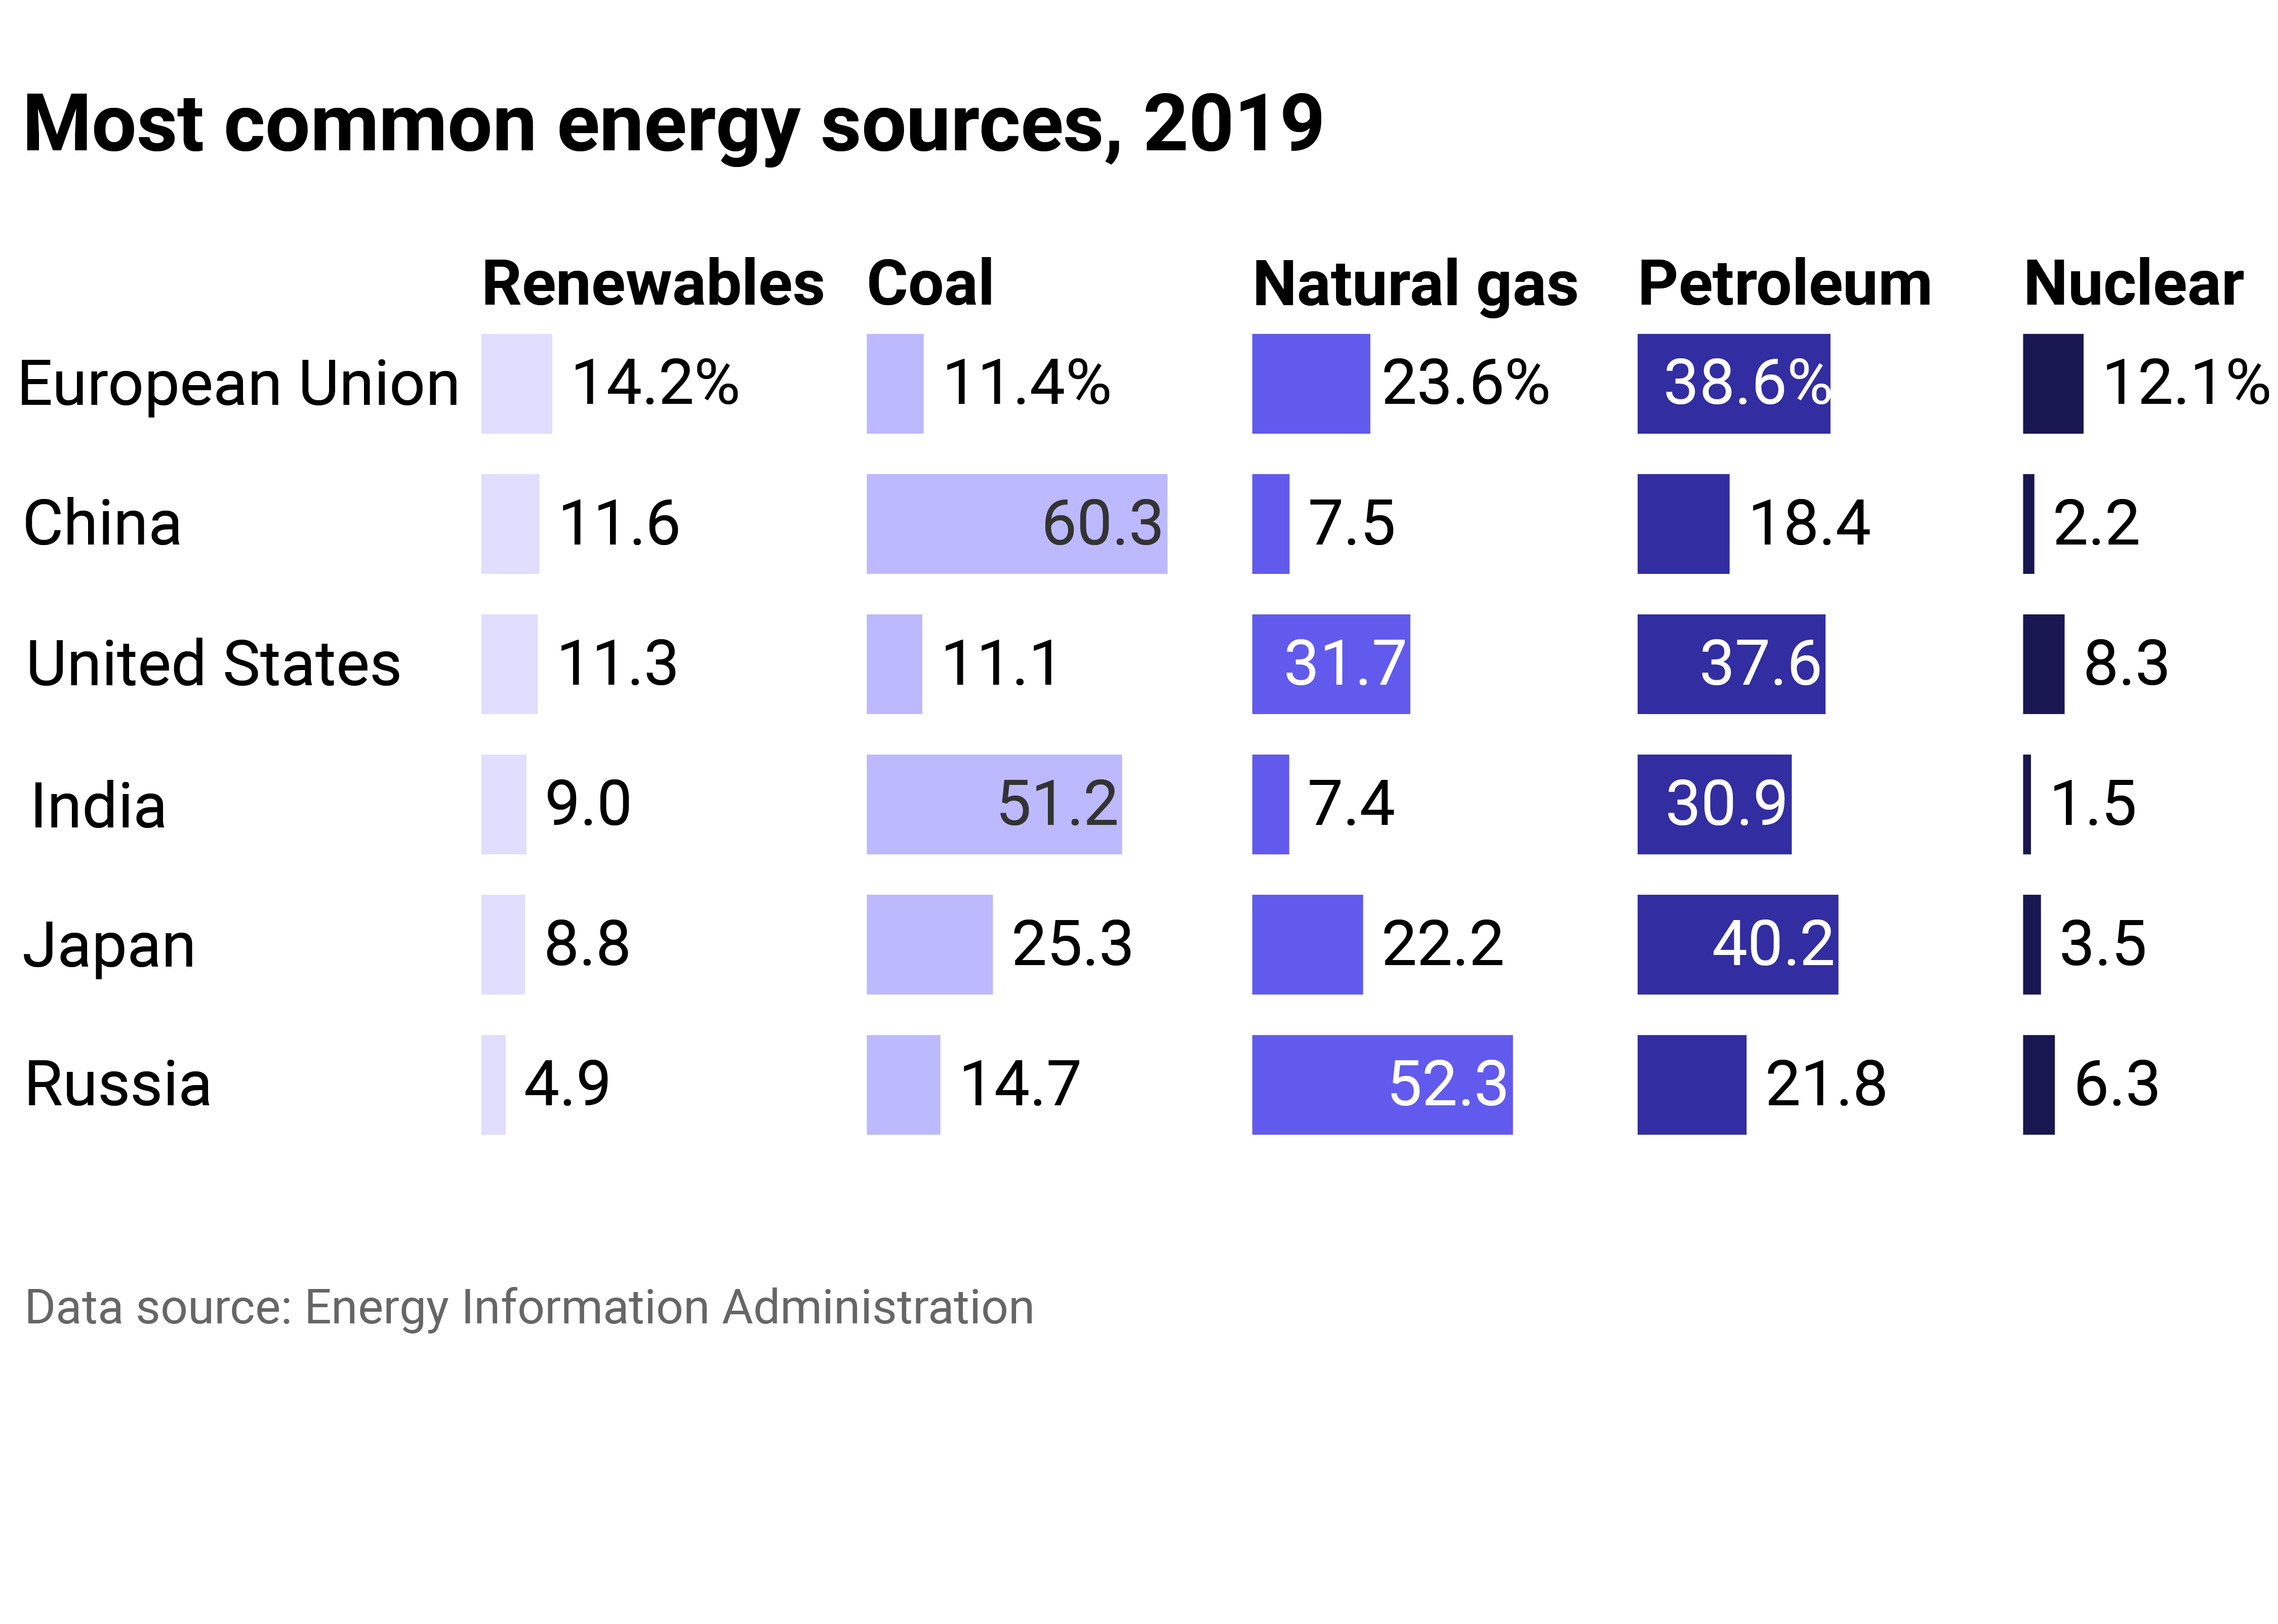
In 2019, US renewable energy consumption was on par with China
In the U.S., the fastest-growing energy source is renewable energy—and, in 2020, 20% of utility-scale electricity generation came from renewables, with the majority of these renewables being hydropower and wind power.
As for China, despite its heavy reliance on coal, the nation of 1.4 billion is the world's largest producer of solar and wind energy. China aims to source one-third of its electricity from renewable energy by 2025.
In the EU, hydropower and wind power have gained significant ground, accounting for more than two-thirds of electricity generated from renewable sources; for the remaining one-third, solar power and solid biofuels are the main contributors.
India remains heavily dependent on coal and petroleum. Still, as mentioned earlier, the country has set a benchmark of 15% for natural gas sourcing by 2030 as part of a national plan to reduce air pollution. According to business action group Invest India, the country already ranks in the top five globally for installed wind and solar power capacity, respectively.
Japan is primarily an import nation when it comes to CO2-generating energy sources. While it produces practically no coal or petroleum, it ranks high in consumption against most other countries. Domestically, nuclear and other energy sources are the most significant energy industry.
However, since the incident at the Fukushima nuclear plant in 2011, caused by the conflation of an earthquake and a resulting tsunami that wiped out the plant's emergency generators and released enormous amounts of radiation, the country has begun to shift its focus on energy fuel sourcing. Intending to have between 36% and 38% of its energy coming from renewables by 2030, Japan aims to use solar, hydropower, wind, biomass, and geothermal energy sources.
In Russia, renewable use as an energy source is low despite the country's many renewables-related resources, such as hydroelectric power, which makes up the majority of the country's capacity for clean energy generation. The country is one of the world's largest petroleum providers and thus one of its most significant users, which will likely not change soon.
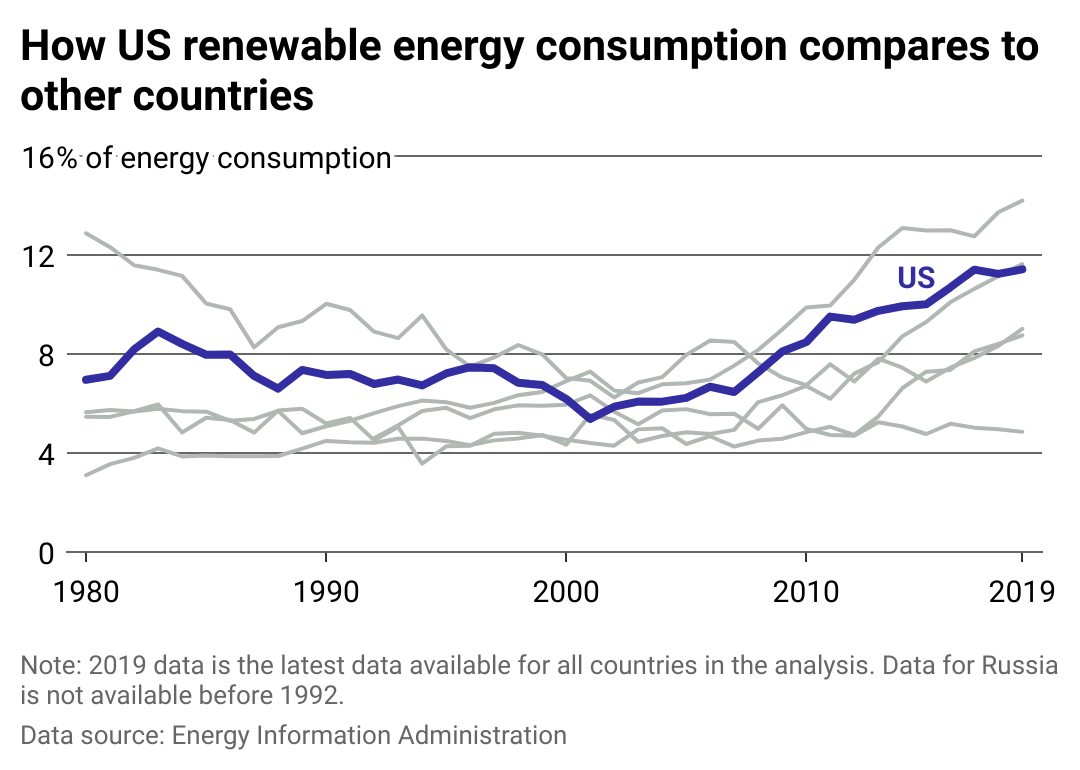
Renewable energy as a share of energy sourcing has grown 64% since 1980
Over the last decade, wind and solar power have rapidly grown in the U.S.—though, as of 2019, these renewable sources made up less than 4% of the energy sources the country used. That said, since 2000, coal production has gone down in the U.S., while there has been a spike in solar energy production—though it still accounted for just 1% of national energy production in 2018. Solar energy growth occurs on both the large scale (in electronic power plants) and the small scale (in rooftop solar panels).
China has the world's highest share of solar energy consumption—this consumption is significantly higher than in other leading countries like Germany, Japan, and the U.S. The second-most important renewable energy source in China is windpower; the cumulative installed capacity tripled between 2014 and 2021.
Overall, China generates just over 28% of electricity from renewable sources. The Chinese government is committed to reaching 33% by 2025. Projections suggest nonfossil fuels for energy use across all industrial sectors will hit 20% by that same marker.


