
The state of American divorce in 2024
This story was produced by LegalZoom and reviewed and distributed by Stacker Media.
The state of American divorce in 2024
Divorce rates say a lot about who we are as a society. Trends in how unions dissolve reflect the social, economic, and cultural characteristics that define our time. Divorce rates have shifted over time, introducing new insights into why modern couples decide to end their marriage.
LegalZoom reports that there are two ways to measure divorce rates:
- Crude divorce rates measure the number of divorces per 1,000 people
- Refined divorce rates measure the number of divorces per 1,000 married women.
While the crude divorce rate is more common, many believe refined divorce rates are more accurate. Not only do they reflect the population actually at risk of divorce, but also, women's reports tend to be more exact.
Revealing divorce trends
Surprising divorce statistics offer insight into the myths, realities, and core influences on the dissolution of marriages in the United States. These statistics all reflect the crude divorce rate.
Divorce rates over time
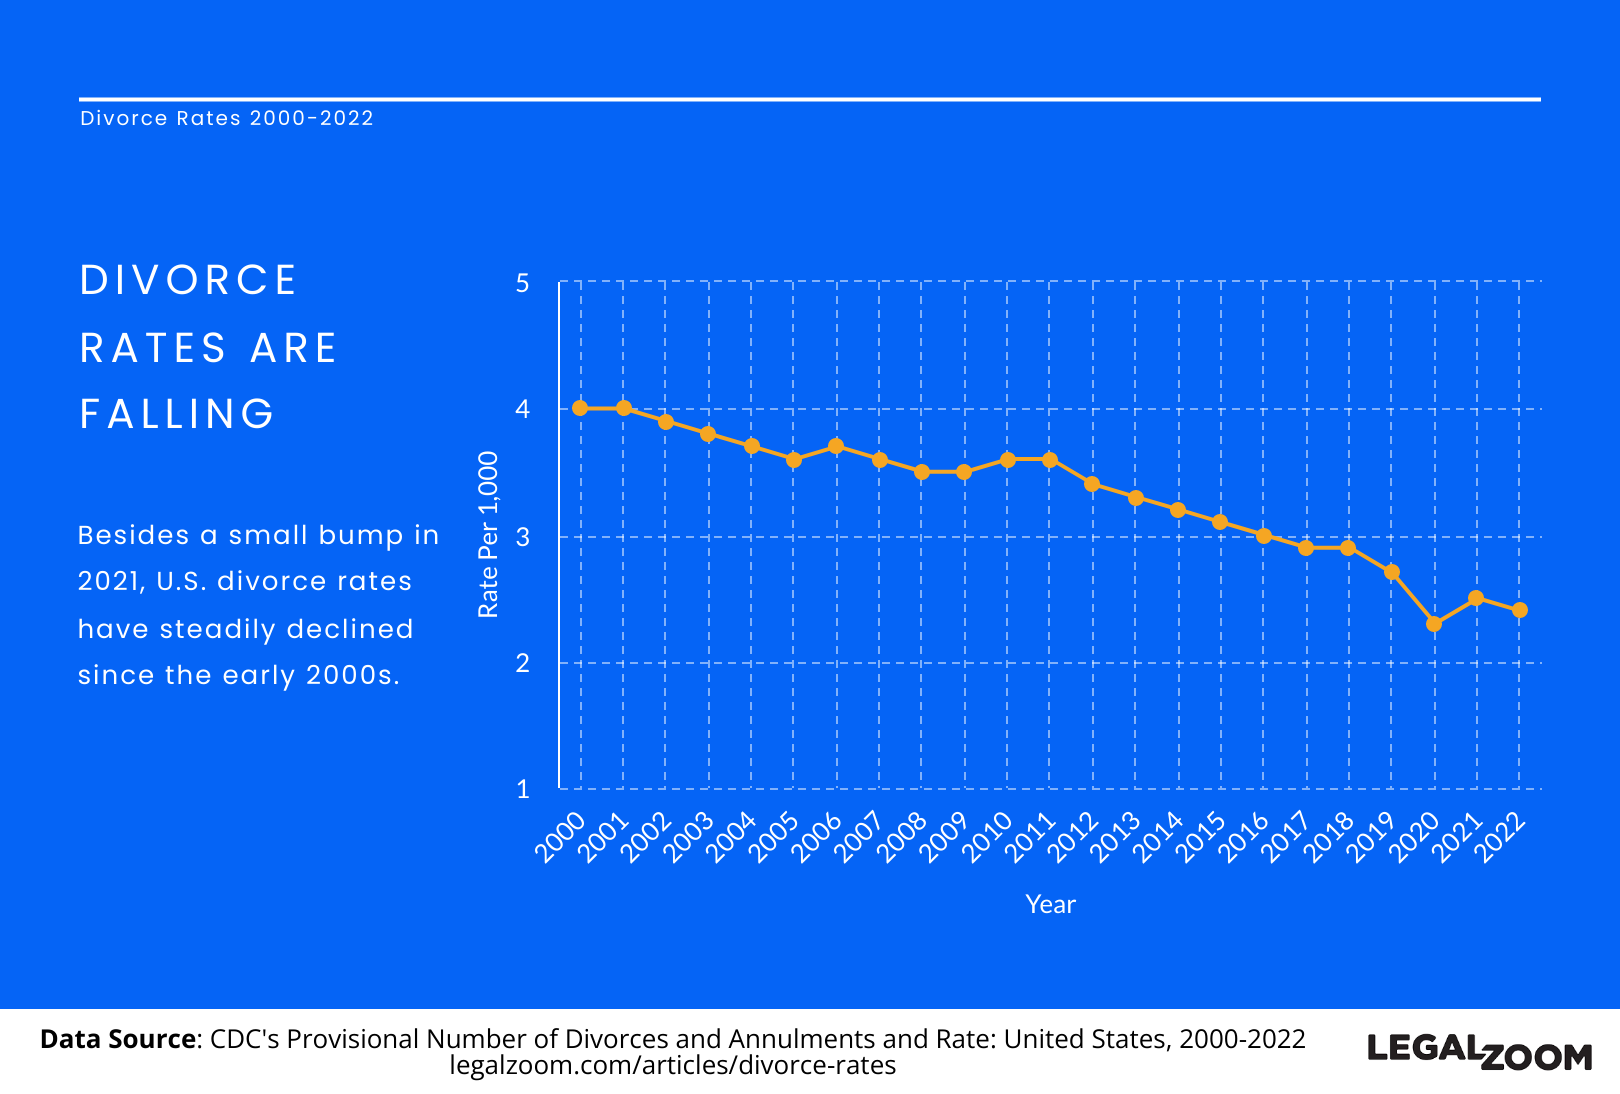
Discussions around divorce often suggest that divorce rates have drastically grown in the past few decades. Marriage and divorce statistics show a different reality.
Here's a look at how crude divorce rates have changed over time:
- 10 years ago (2014): 3.20
- 20 years ago (2004): 3.70
- 30 years ago (1994): 4.60
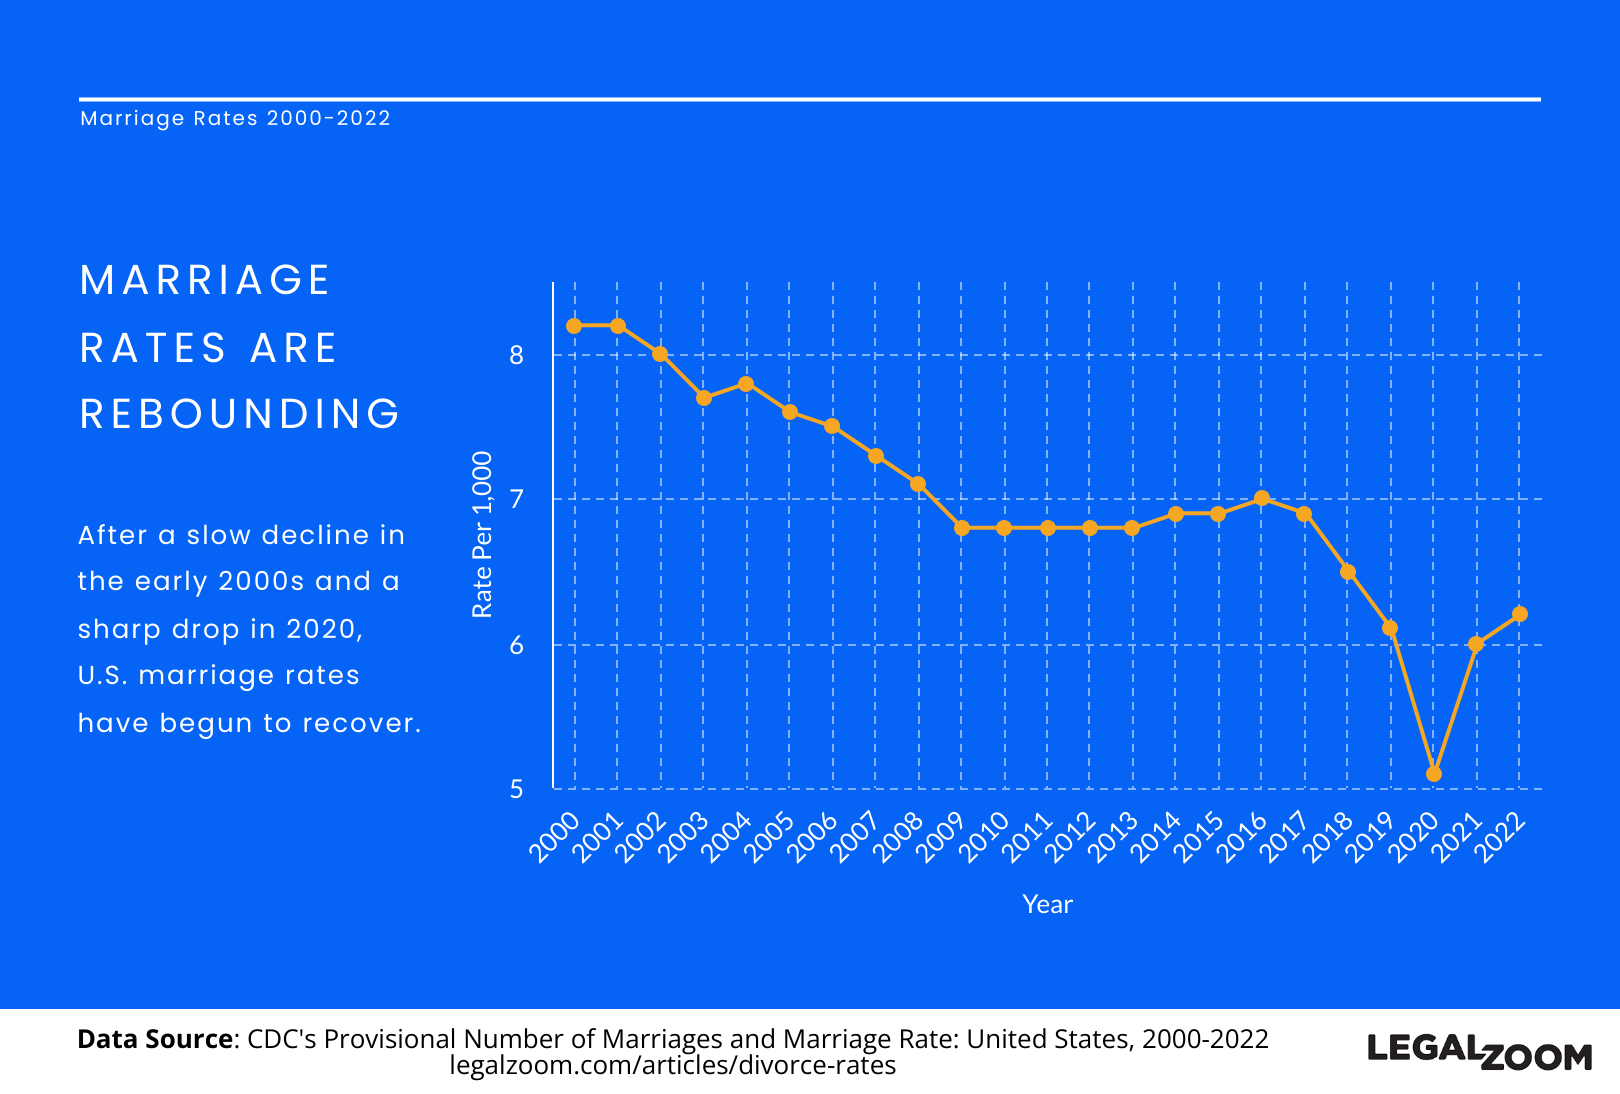
Similarly, marriage rates dropped significantly recently, from 8.6 in 2000 to 6.2 in 2022.
Rates from 2020–2021 during COVID-19
In a reversal from the steady downward trend, divorce rates rose slightly from 2020–2021 and then dropped again from 2021–2022:
- 2020: 2.3
- 2021: 2.5
- 2022: 2.4
The impact of COVID-19 on physical, social, and financial health likely contributed to this small uptick in divorces, further underlining the effect of socioeconomic influence on marriages ending.
Here's a breakdown of divorce rates among various demographic groups.
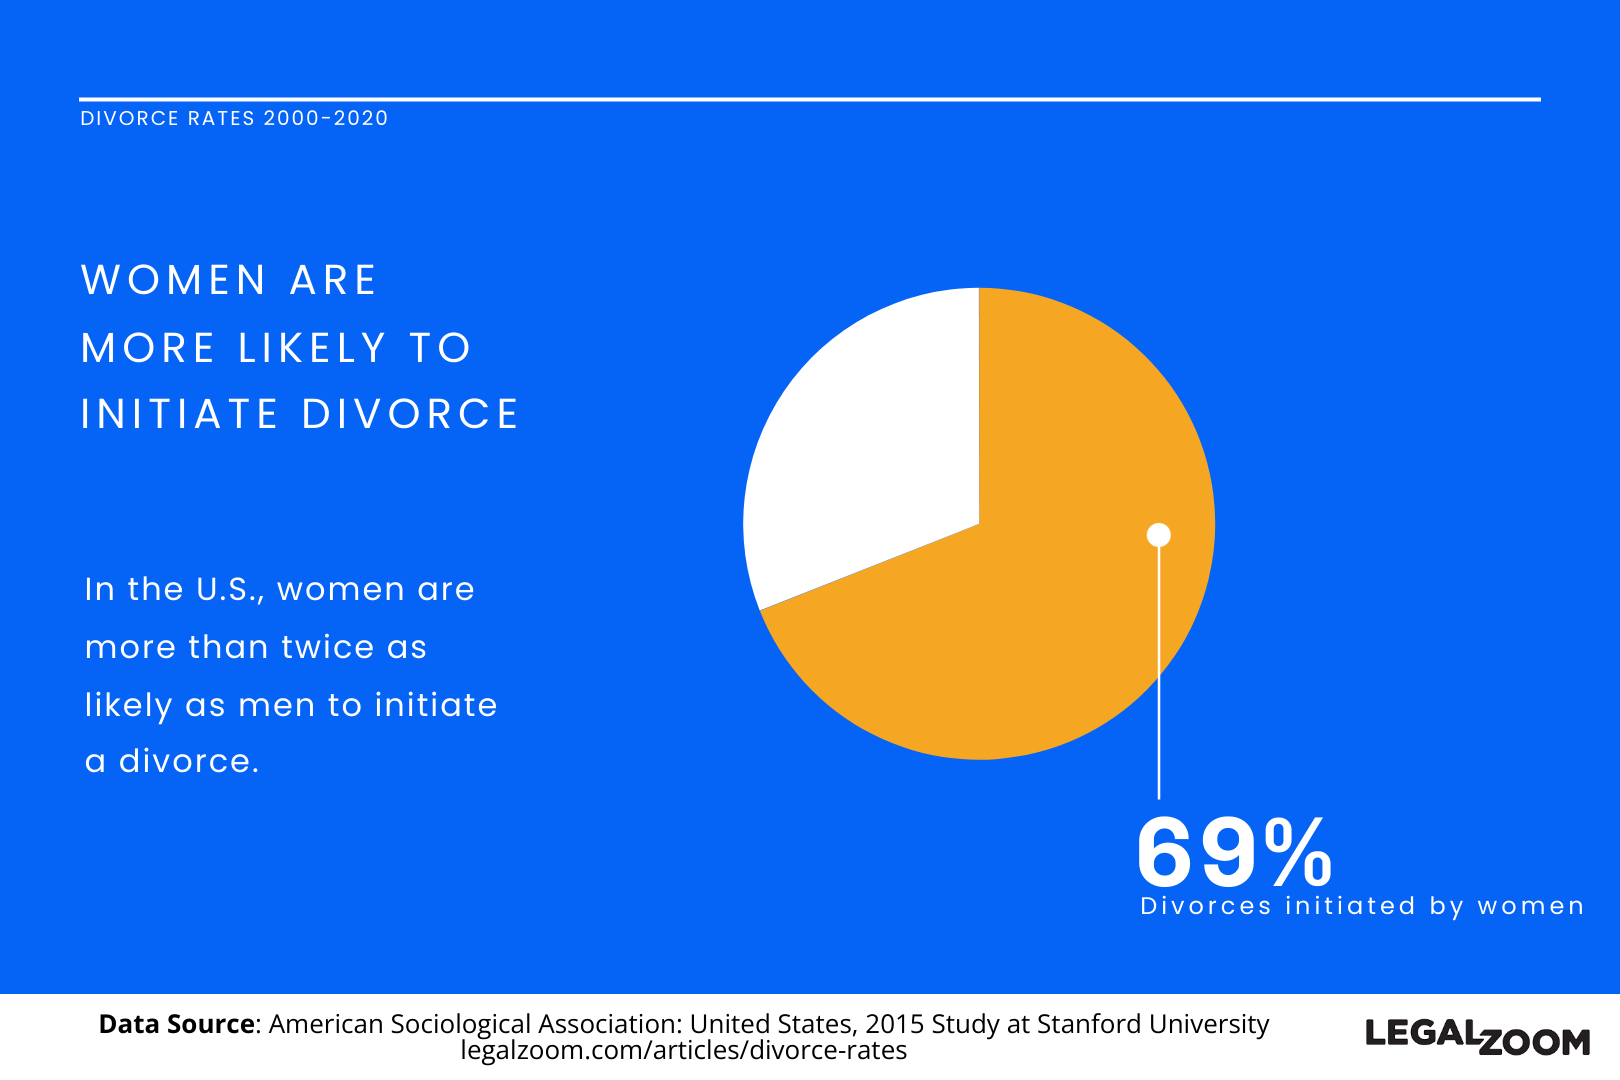
Gender divorce rates
Women are much more likely to initiate divorce in an opposite-sex marriage.
- 69% of women initiate divorce
- 31% of men move to dissolve the union
While men receive financial and health benefits from marriage, such as a longer lifespan and higher income, women tend to take on more stress from household and child-rearing labor. This may contribute to imbalances in marriage satisfaction between genders in heterosexual marriages.
Gray divorce rates
While the U.S. has maintained a steady decline in divorce rates, the situation is different for divorce among middle-aged and older adults, also known as gray divorce:
- 36% of U.S. adults getting divorced are aged 50 or older
- The only age group with an increasing divorce rate is adults aged 65 and older
- The divorce rate in those aged 65 and older tripled from 1990 (1.8) to 2021 (5.5)
Same-sex divorce statistics
As same-sex marriage is still relatively new, there's less data on the divorce trends among same-sex couples. So far, trends show many similarities with opposite-sex divorce rates.
- About 2% of same-sex couples divorce annually, a similar rate as opposite-sex marriages
- Female same-sex marriages also have a higher divorce rate than male same-sex marriages
Divorce rates in America
While the divorce rate in America is higher than the world average (1.6 per 1,000 people), national marriage and divorce dates in the U.S. both mirror the global decline. State and regional differences in the number of marriages that end in divorce provide potential insight as to why many Americans still choose to dissolve their unions.
Marriage and divorce rates
A common criticism of no-fault divorce law is the sharp increase in divorces in the United States since its legalization in 1969. However, after a ten-year spike, divorce rates declined and continued a steady downward trend, prompting us to reevaluate whether or not there truly is a correlation.
Recent divorce rates mirror the years before the legalization of no-fault divorce. In 2022, 673,989 couples dissolved their marriage—2.4 per 1,000 people—less than the 2.9 per 1,000 people recorded in 1968.
Similar to trends in divorce, marriage rates have also dropped steadily from 10.6 per 1,000 people in 1969. In 2022, 2,065,905 couples married—a rate of 6.2 marriages per 1,000 people. These numbers indicate that state and federal regulations impact marriage and divorce less than socioeconomic factors, which we'll explore later.
States with the highest divorce rates
While there is a national downward trend, divorce rates by state vary considerably. According to refined divorce rate data by the United States Census Bureau, these five states had the highest divorce rates in 2022:
- Arkansas: 11.9
- Wyoming: 11
- Kentucky: 9.9
- West Virginia: 9.7
- Oklahoma: 9.3
These numbers show a higher divorce rate in South and Central states. Interestingly, many of these states prioritize equal asset distribution after divorce.
That said, other states—such as Alaska, New Hampshire, and Washington—offer streamlined divorce processes and equitable division of assets but have significantly lower divorce rates.
States with the lowest divorce rates
Statistics show that coastal states have markedly lower divorce rates than those in the center of the country. The Northeast, West, and Midwest states have especially low divorce rates.
- Vermont: 4.6
- New Jersey: 5.2
- Alaska: 5.5
- New York: 5.7
- Minnesota: 5.7
It's worth noting that while divorce rates are higher in the South, marriage rates are also higher. This could point to a link between divorce and marriage pressure in religious communities. Conversely, first marriages tend to be later in the Northeast, and the marriage rates are lower, which would result in fewer divorces.
Divorce rate by country
Global divorce rates offer deeper insights into how cultural, legal, and economic factors impact marriage length.
For example, many developed countries—such as the U.K., U.S., Germany, Australia, New Zealand, and Singapore—show lower divorce rates and an increase in the duration of time couples are married before they divorce.
Although developed countries see fewer divorces, developing countries have lower divorce rates.
Countries with the highest divorce rate
The Maldives remains the country with the highest divorce rate. Increased domestic violence since COVID-19, paired with women's rights initiatives, could contribute to this trend. Their growing economy is another potential influence.
- The Maldives: 5.52
- Kazakhstan: 4.6
- Russia: 4.4
- Belarus: 3.7
- China: 3.2
All of these countries have no-fault divorce laws and a relatively easy and affordable divorce process.
Countries with the lowest divorce rate
Sri Lanka has the lowest crude divorce rate globally, 0.15 per 1,000 people. Legal obstacles to divorce could impact the low number of marriages that end in Sri Lanka.
- Sri Lanka: 0.15
- Vietnam: 0.2
- Guatemala: 0.2
- Saint Vincent and the Grenadines: 0.4
- Peru: 0.5
Except for Peru, all of these countries require grounds for a divorce.
Divorce rates by age
Age appears to play a key role in how long a marriage lasts in the United States. Divorce statistics show that younger and older marriages are less likely to succeed.
The average age of divorce
While divorce rates are declining, the median age of divorce is going up. Since 1970, the median age of a first-time divorce has increased from 30.5 to 42.6 for men and 22.7 to 40.1 for women.
Divorce rates by generation
Since 1990, the divorce rate has decreased for those aged 15 to 44, whereas it increased for those aged 45 and older. However, the divorce rate for couples aged 15–34 is higher than that for those aged 35 and above.
The divorce rates for older women have shown the most significant average increase. Dissolved marriages increased nearly four-fold for women aged 65 and older. From 1990 to 2021, the divorce rate rose from 1.4 per 1,000 people to 5.6 per 1,000 people.
One reason for this trend could be the rise in financial independence in older women. Divorce has a higher economic impact on older couples, but more older women today have more of a financial safety net than in the past.
Divorce rates by race
Divorce rates by race and ethnicity propose essential clues to the cultural and economic impacts of divorce in America. For example, systematic bias impacting economic status, religious beliefs, and cultural norms can all contribute to differences in divorce rates.
These are the statistics for divorce from first-time marriages by race in 2021:
- Black men and women had the highest divorce rates: 22.6 and 24.5, respectively
- Hispanic men and women had the second highest divorce rates: 11.4 and 14.9, respectively
- White men and women had the third highest divorce rates: 10.8 and 11.4, respectively
- Asian men and women had the least amount of divorces: 7.7 and 8.3, respectively
- Native-born couples were more likely to divorce than foreign-born spouses
Compared to divorce rates by income and education, these statistics give a deeper look at the layers of influence on marital longevity.
Divorce rates by income
While it's a cliche that money can't buy happiness, it might help maintain the stability of your marriage. That said, too much income can increase your risk of divorce.
Divorce rates for high incomes
The 2019 American Community Survey estimates suggest that divorce rates decrease steadily from 45% to 30% as household income rises to $200,000. Household incomes between $200,000 and $400,000 remain steady at around 30%, dropping to 25% from $400,000 to $600,000.
Conversely, divorce rates for household incomes exceeding $600,000 rise to nearly 30% until they reach $800,000, after which they drop back down to around 25%.
This suggests that a higher income can reduce the risk of divorce, but only to a certain point. Divorce rates for earners between $200,000 and $100,000,000 only fluctuate by 5%.
Divorce rates for low incomes
It's important to note that while the divorce rate only marginally fluctuates by 5% once a household income reaches $200,000, it rises as much as 10%–15% as the household income drops toward the poverty line.
This statistic demonstrates that while possessing a lot of money may not impact the quality of a marriage, not having money will.
Divorce rates by unemployment
Unemployment similarly impacts divorce rates for both unemployed men and women. In 2022, 21%–22% of divorces involved a man or woman who was not working.
Divorce rates by education level
Similar to income, education level has a notable influence on divorce trends. Based on an American Community Survey from 2021, both male and female college graduates are less likely to divorce than those with only a high school diploma or some college education.
Masters degrees further reduced the divorce rate for both men and women, but the decline was higher in men than in women. The number of divorces for male college graduates vs. men with a master's degree dropped from 10 to 7.8 divorces per 1,000 first marriages. For women, the dip was only 10.6 to 10.2 divorces.
Divorce rates by profession
Income, stress levels, and hours can all impact a marriage's success, so it isn't surprising that the divorce rate also varies by industry.
The industries with the highest divorce rate are office and administrative support, transportation, protective services, and personal care and service industries, each with a 40%–41% divorce rate. Many of these industries involve long or odd hours and high stress.
The industries with the lowest divorce rates include architecture and engineering, computer and mathematics, the military, sciences, and education, ranging from around 28%–30%. These industries offer a higher income and greater flexibility.
Factors influencing divorce statistics
Many of these statistics show that divorce trends don't arise from just one source but from a complex mix of factors, such as financial stability, adherence to traditional gender roles, and legal accessibility to divorce.
Economic factors
Beyond household income, which can be more situational, employment rates and economic downturns can set the pace for national marriage and divorce trends. For example, inflation following a major war correlates with sharp spikes in divorce rates in 1946, 1977, and 2011, demonstrating a possible link between inflation and divorce rates.
Similarly, high unemployment rates can lead to financial problems that put stress on couples, straining the marriage. We saw this with the slight rise in divorce rates post-COVID-19 lockdown.
Social factors
The social factors in divorce rates are impossible to ignore. Arguably, the most consistent influencer on divorce trends across every category is gender. Regardless of age, education, or income, women always display a higher divorce rate than men. This could imply that the most crucial factor in divorce is how much it impacts the woman's quality of life, followed by whether or not she can legally obtain one.
Legal factors
Global divorce rates show a clear correlation between legal obstacles and lower divorce rates by country. National statistics show similar trends, as Nevada, the state with the highest divorce rate, has one of the most accessible divorce laws. Conversely, Vermont has one of the most complex divorce laws and the lowest divorce rate. However, the steady return to pre-no-fault-divorce-law rates implies that legal factors are only the first tier of influence.
Implications of divorce rates
Divorce is time-consuming and costly, but there's a reason it exists. Research shows numerous positive and negative effects of divorce.
Impact on children and families
Divorce impacts family members differently. Studies show that children are unlikely to experience psychological effects from divorce itself. Rather, individual, family, ethnic, and cultural factors direct the risks associated with changes in children's family life.
Men and women also generally face different challenges post-divorce. For example, women tend to face more damage to their financial stability, quality of life, and homeownership and bear more child-rearing responsibilities. However, men show more damage to their health, life expectancy, family-life satisfaction, and emotional well-being.
Economic implications
Women are more likely to bear the economic brunt of divorce. This is often due to higher economic need as the primary caregiver, insufficient childcare support, disproportionate loss of income, and lower employability from having taken on a higher load of household labor.
Impact on quality of life
Although women also experience a much higher decrease in their standard of living compared to their male spouses, these adverse effects can be short-term. In a 2000 review of the consequences of divorce, many women reported higher financial and emotional satisfaction post-divorce.
Impact on life expectancy
Divorce is more likely to lower life expectancy. A study by the National Center for Health Statistics showed that the age-adjusted death rate for both divorced men and women aged 25 and older was higher than that of married men and women 25 and older. Although the rate had declined 7% in the last seven years, divorced couples still showed a glaringly higher mortality rate of 1,363 per 100,000 people compared to 779 per 100,000 for married couples.
This risk is higher for divorced males, whose mortality rates are 1,772 per 100,000, compared to divorced women, with mortality rates of 1,095 per 100,000 people.
Policy considerations
The need for supportive measures such as counseling services, legal aid, and economic support for affected families is critical. Changes in the implications of divorce over time show that support significantly impacts the health and well-being of men, women, and children after divorce.
The rise of the prenup
The landscape of divorce is constantly changing. More equality in education and income levels among younger generations has led to higher marriage ages and more prenuptial agreements. Although divorce rates have steadily declined, many millennials and older Gen Z couples grew up with divorced parents and recognize the realities of marriage.
It's both an emotional and financial commitment, and proper preparation sets up a better, lasting foundation. Soon-to-be newlyweds who want to clarify expectations before marriage should seek the guidance of a prenup attorney.
Frequently asked questions
What percentage of marriages end in divorce?
43% of first marriages, 60% of second marriages, and 73% of third marriages end in divorce.
What are the top reasons for divorce?
According to a survey of 191 Certified Divorce Financial Analysts from across North America, the leading cause of divorce is basic incompatibility (43%), infidelity (28%), money issues (22%), emotional or physical abuse (5.8%), parenting issues (5%), addiction (5%).
Why are divorce rates so high?
Divorce rates aren't as high as we think. In recent years, they've returned to relatively the same crude rate as in the 1960's. However, addressing social and economic factors that increase the risk of divorce could lower them even further.
What is the median age for divorce?
The median age of a first-time divorce is 42.6 for men and 40.1 for women.


