Stacker Studio

Cities with the most supercommuters

Written by:
March 25, 2021
Canva

This story originally appeared on Stacker and was produced and distributed in partnership with Stacker Studio.

Cities with the most supercommuters

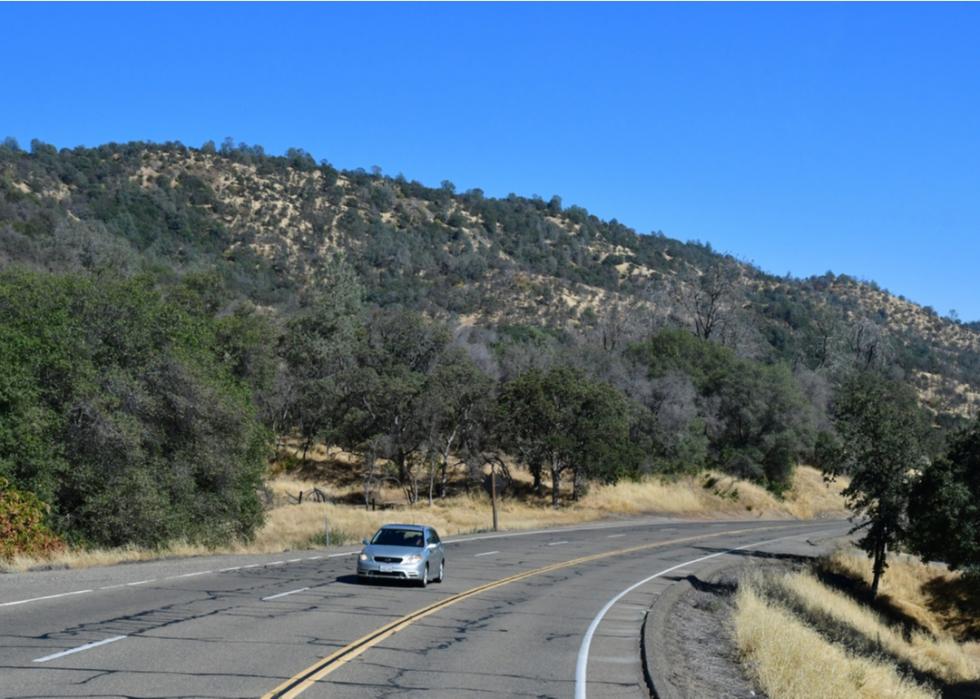
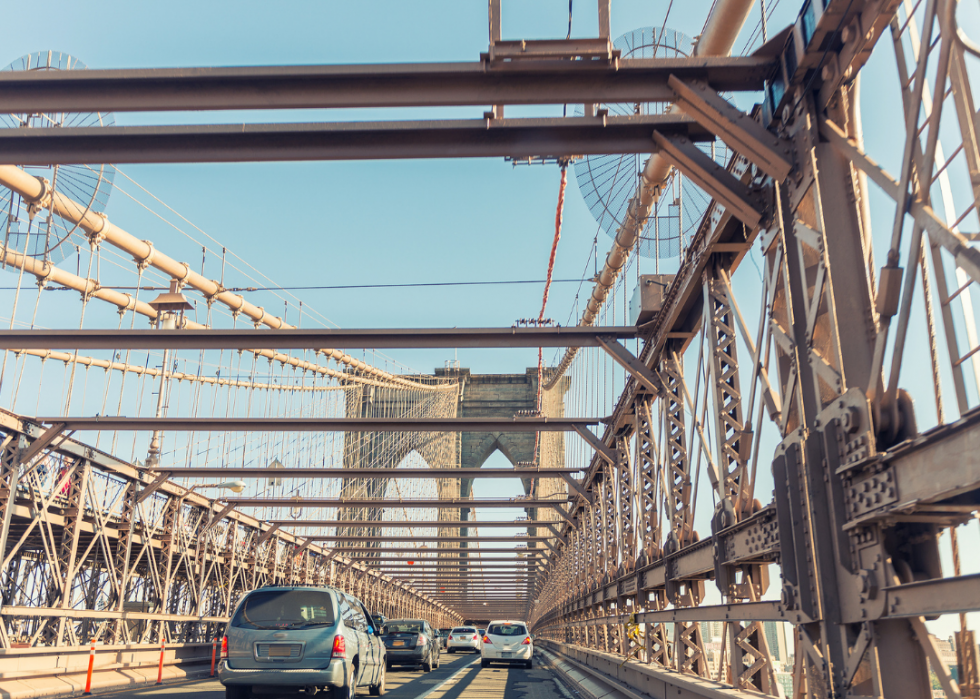
Commuting to work isn’t fun for anyone, but when it comes to U.S. commutes, some have it worse than others. In recent years, you may have seen the term “supercommuter,” which is defined as a person who commutes 90 minutes or more to work each way.

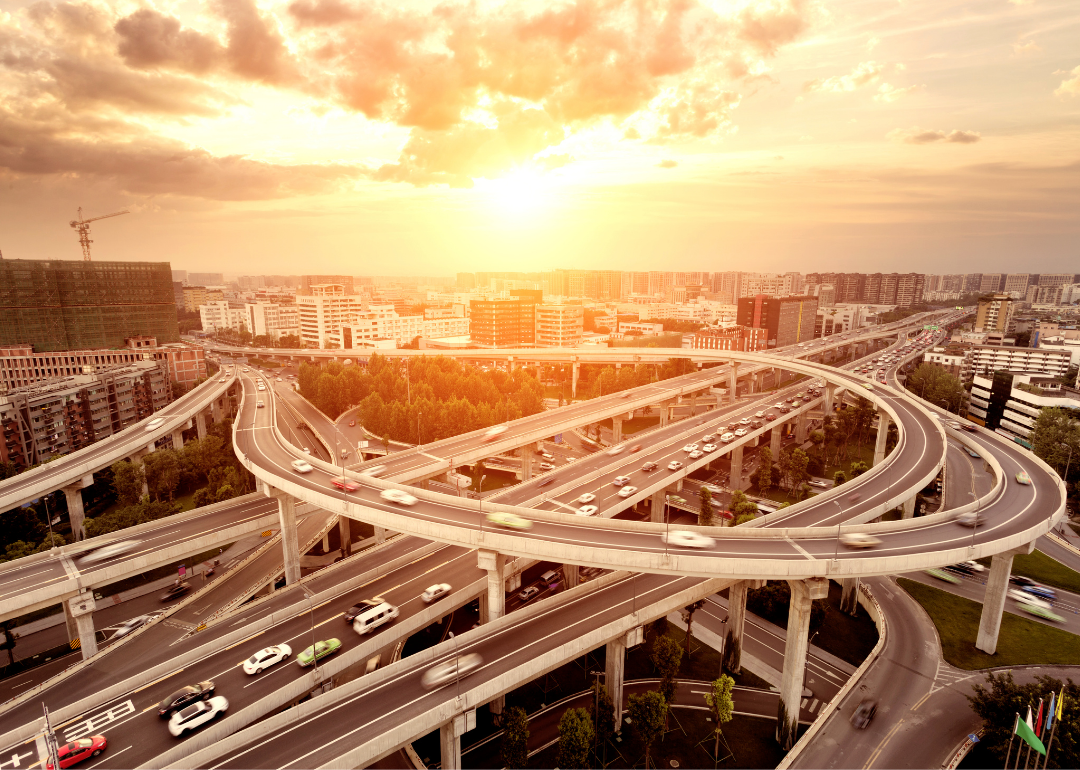
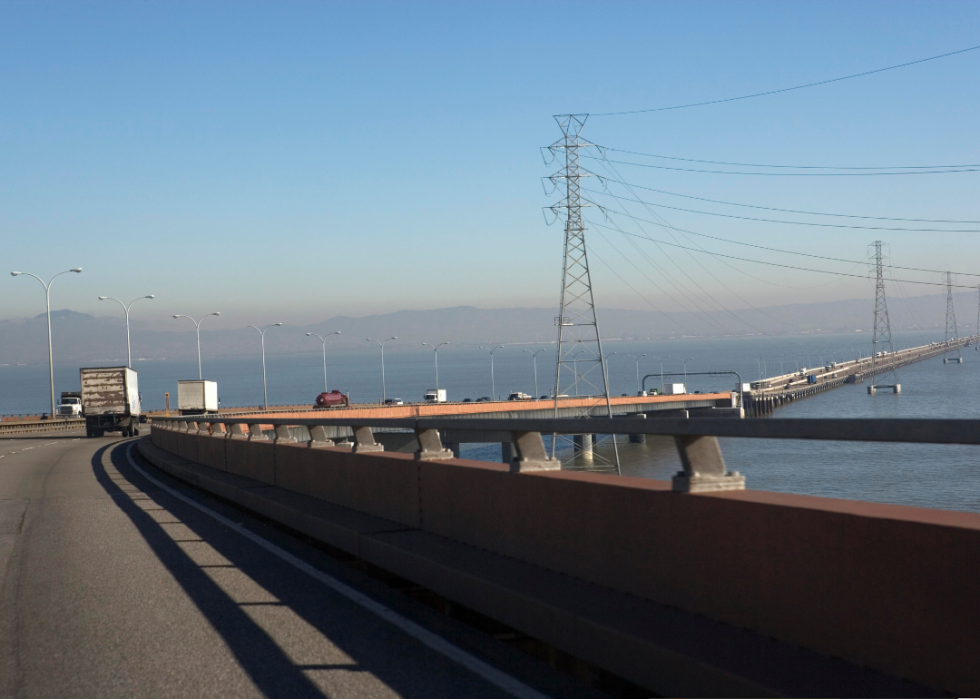
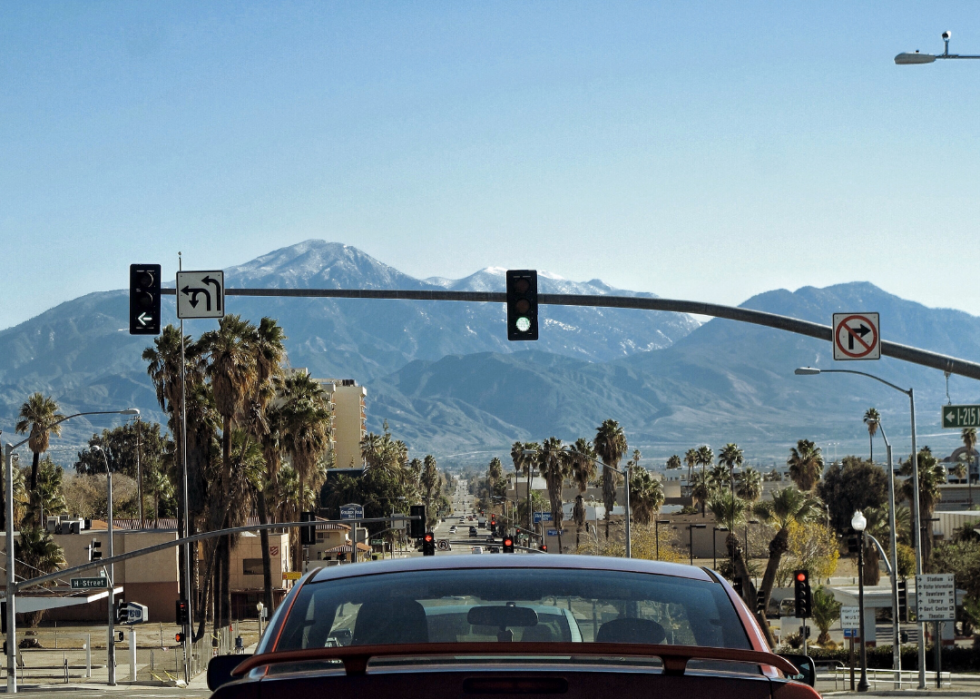
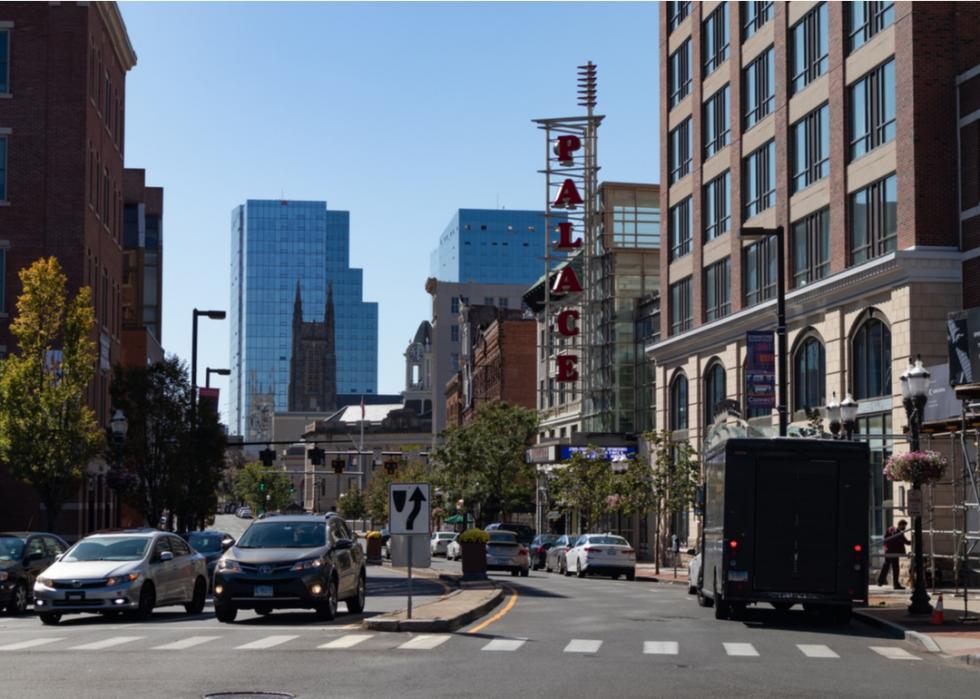
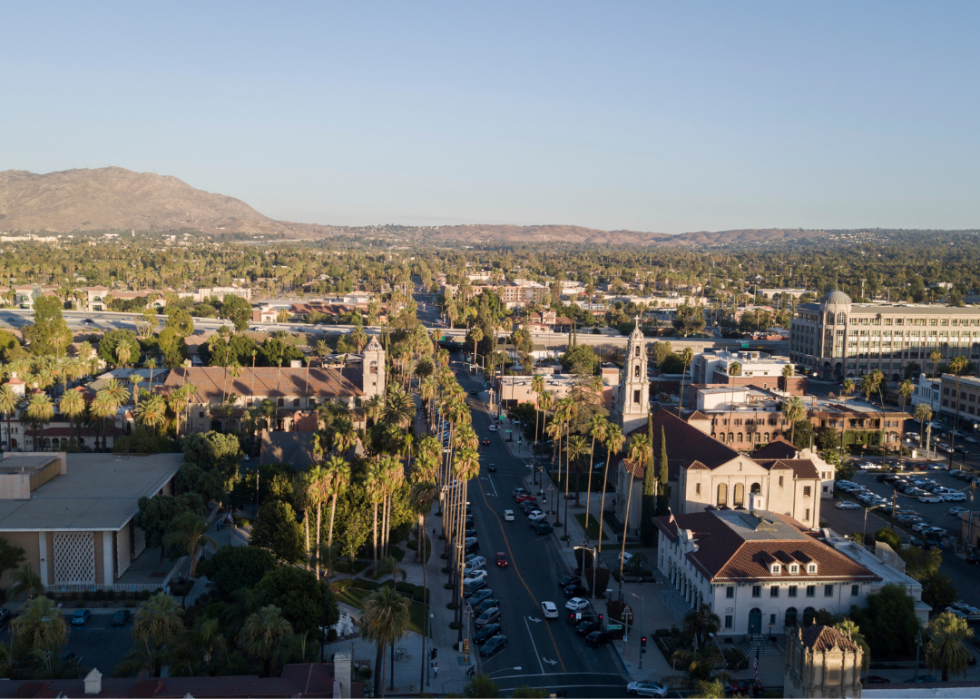
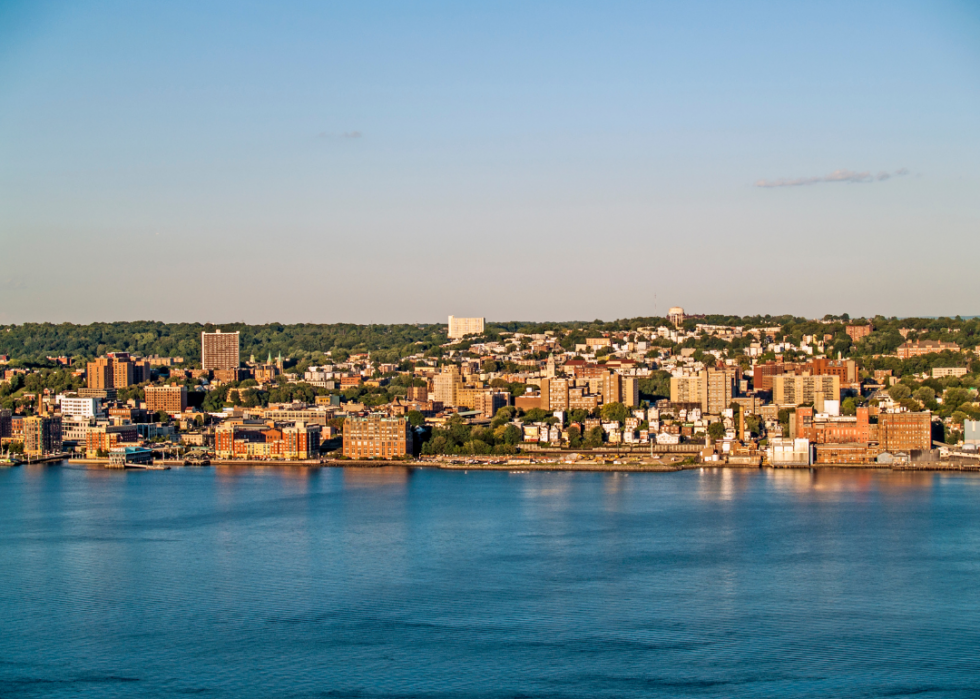
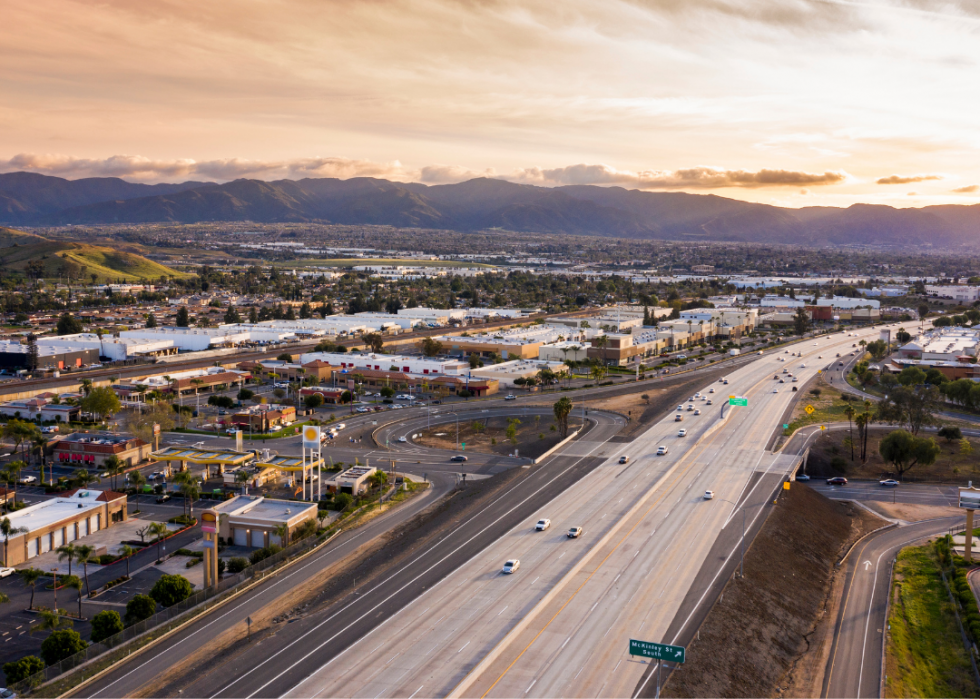
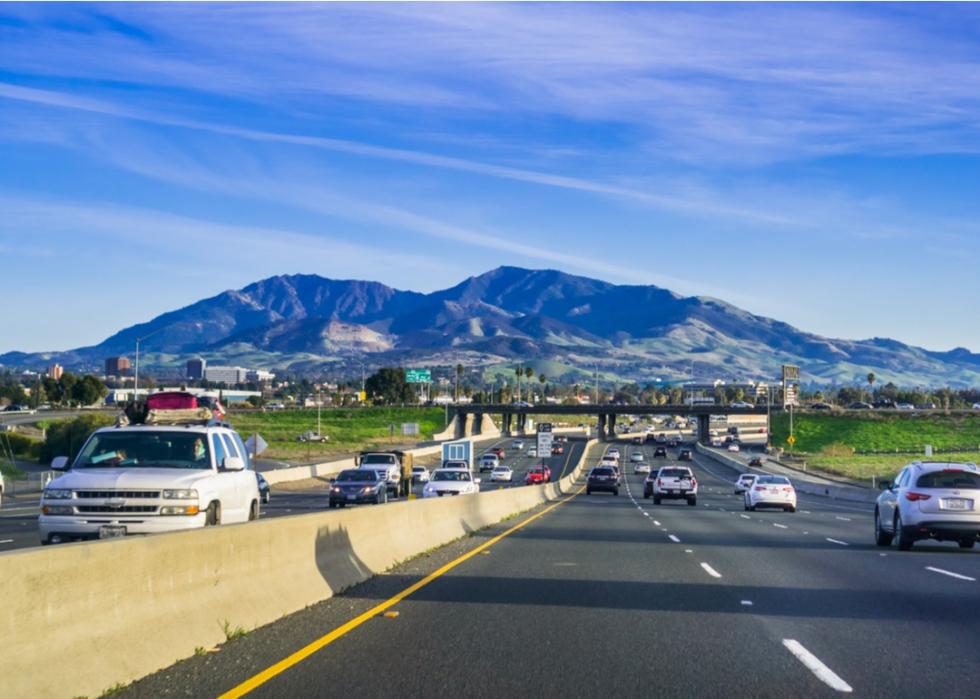
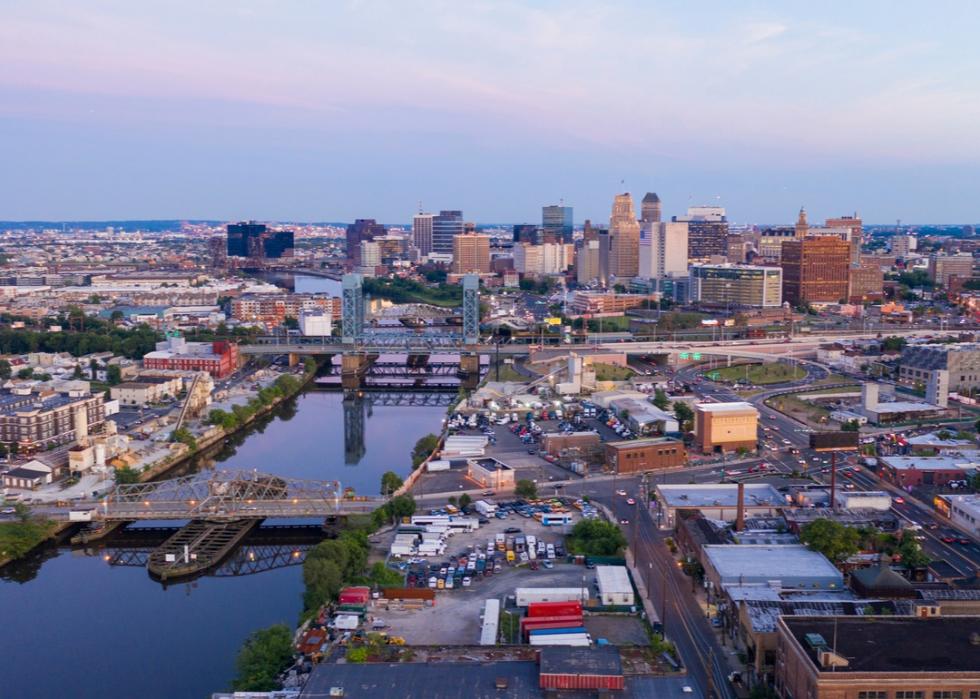
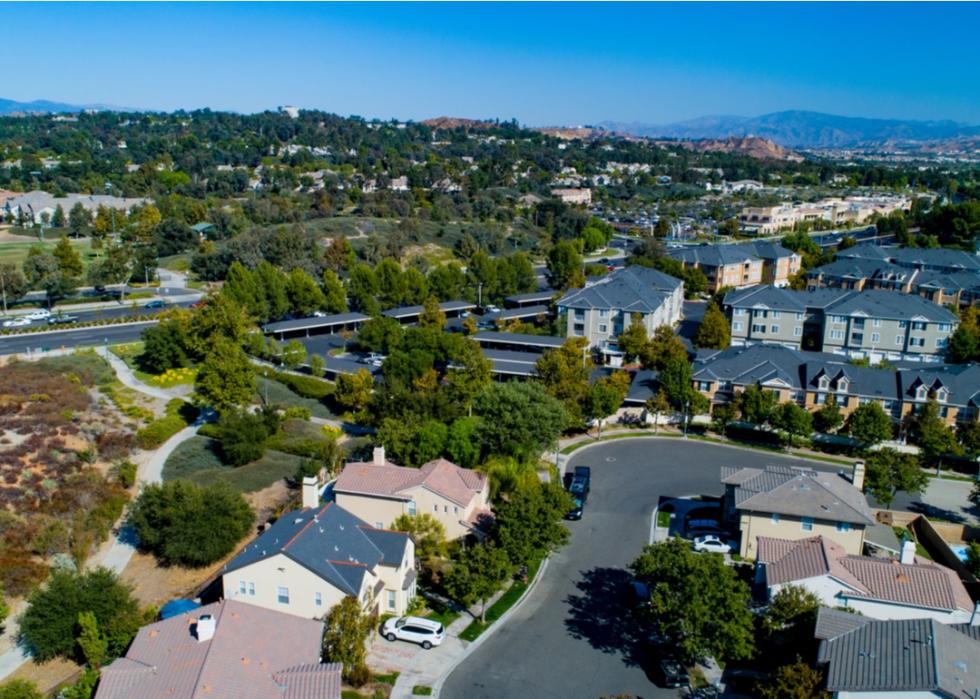
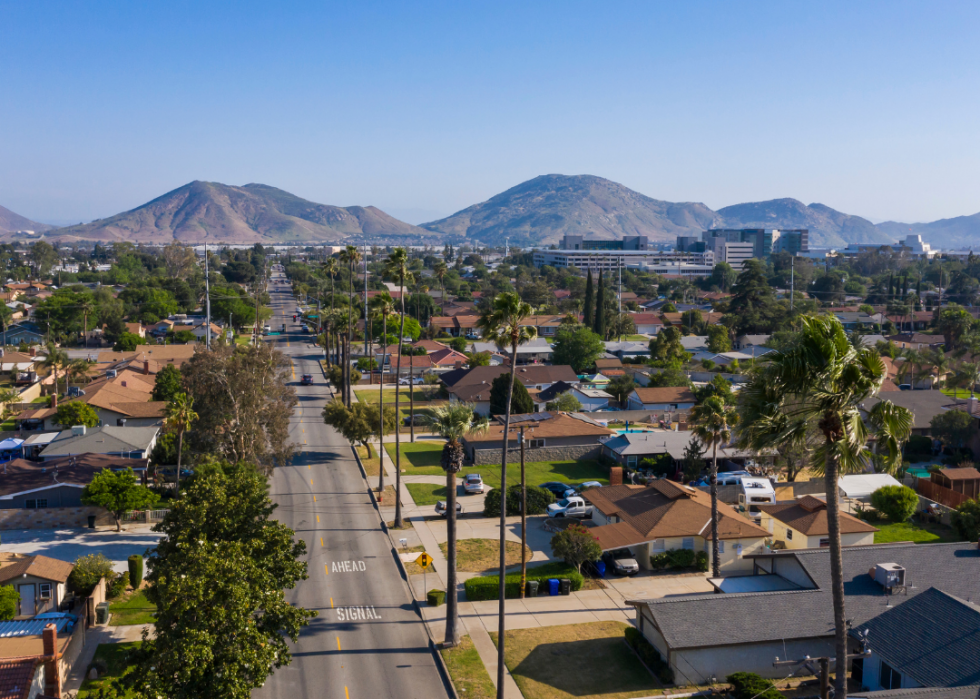
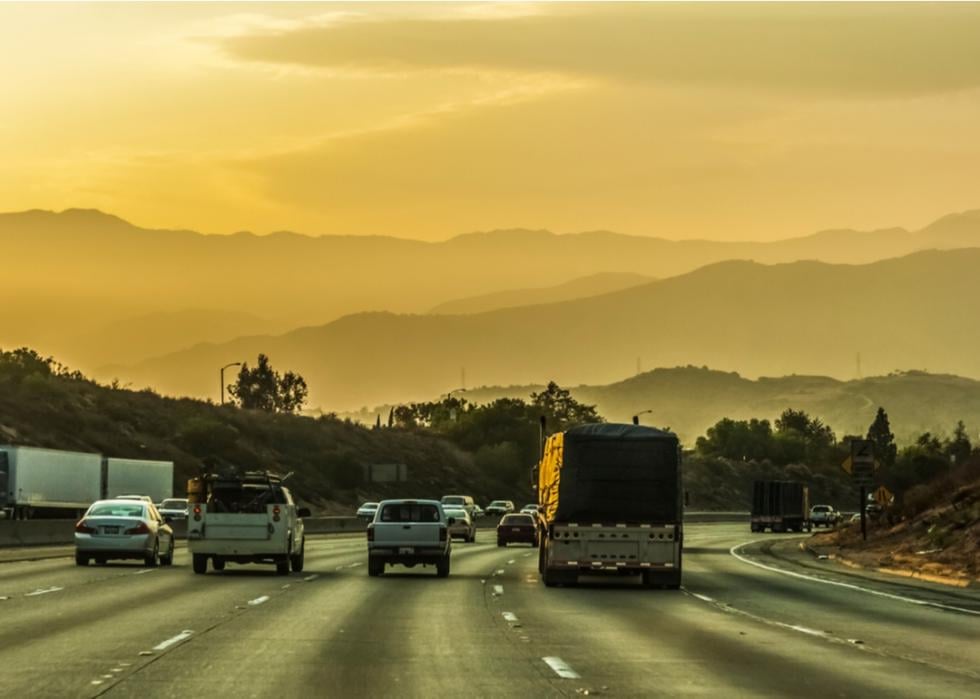
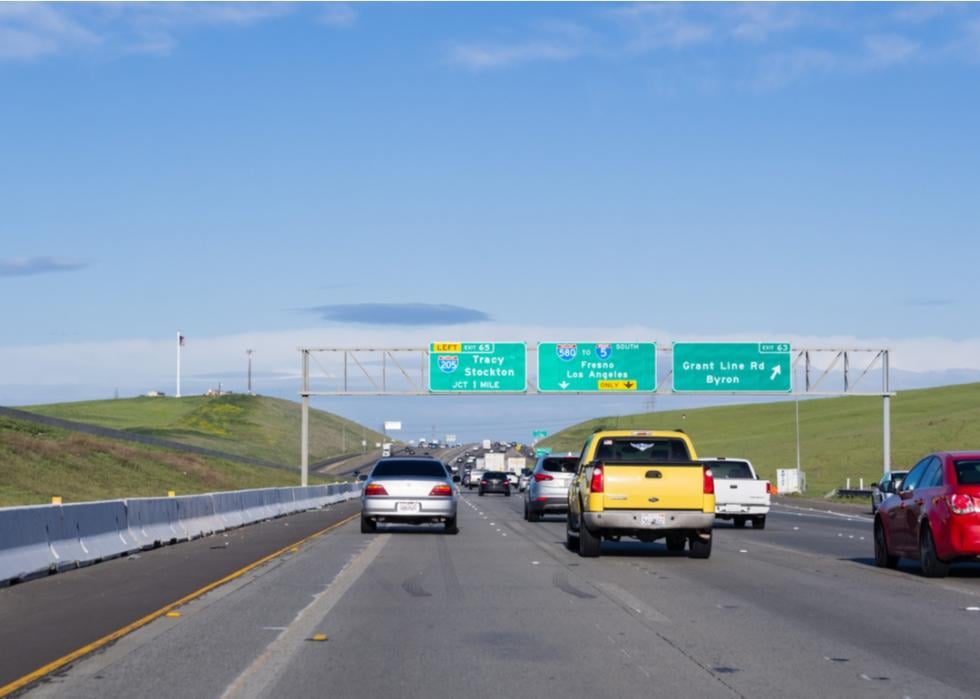
Many supercommuters live in coastal metro areas (such as New York City, the Bay area, and the Los Angeles area), which have high population density and where the cost of housing is expensive, pushing workers to live in the outlying areas. Many of these regions have a large number of residents who commute via car, leading to clogged highways and long commute times. With so many major job markets within the country, which areas have the most supercommuters?

CoPilot compiled a comprehensive list of the 20 cities with the most supercommuters, using 2019 data from the U.S. Census Bureau’s American Community Survey, released in December 2020. To qualify as a supercommuter, someone must commute more than 90 minutes to work one way. Cities with at least 65,000 workers age 16 and over are ranked by the percentage of workers who commute more than 90 minutes to work, while ties are broken by the sheer number of supercommuters in the city.

Read on to see whether or not your city made the list.

1 / 20
Canva

#20. Hayward, California

- Workers with commutes over 90 minutes: 4.9% (2.0% greater than national average)
- Workers with commutes over 60 minutes: 19.4% (10.1% greater than national average)
- Average one-way commute time to work: 34.9 minutes (29.7% greater than national average)
- Means of travel to work: 83.1% car, 9.4% public transportation, 4.1% other
- Workers who commute outside their county of residence: 34.1%
- Workers who commute outside their state of residence: 0.2%

Super-commuting has grown dramatically in the Bay Area in recent years, increasing by 126% from 2009 to 2017. Particularly when commuting from Hayward to nearby cities, the area is full of bottlenecks at bridge crossings, which can lead to additional traffic congestion.

2 / 20
Canva

#19. San Bernardino, California

- Workers with commutes over 90 minutes: 5.1% (2.2% greater than national average)
- Workers with commutes over 60 minutes: 11.2% (1.9% greater than national average)
- Average one-way commute time to work: data not available
- Means of travel to work: 91.0% car, 2.0% public transportation, 3.6% other
- Workers who commute outside their county of residence: 21.3%
- Workers who commute outside their state of residence: 0.2%

The greater Los Angeles area is notorious for serious congestion and slow public transit. Between 2009 and 2017, the number of supercommuters grew by almost 30,000. San Bernardino often deals with clogged roadways, which public transportation also uses. A Fontana Herald News study found that 16% of L.A. area commuters are heading to San Bernardino county for work, with the paper calling long commutes “a way of life.”

3 / 20
Wendell Guy // Shutterstock

#18. Bridgeport, Connecticut

- Workers with commutes over 90 minutes: 5.2% (2.3% greater than national average)
- Workers with commutes over 60 minutes: 13.2% (3.9% greater than national average)
- Average one-way commute time to work: 28.3 minutes (5.2% greater than national average)
- Means of travel to work: 81.9% car, 10.5% public transportation, 4.8% other
- Workers who commute outside their county of residence: 11.2%
- Workers who commute outside their state of residence: 6.5%

Typical Bridgeport commuters spend an extra 49 hours a year stuck in traffic between Bridgeport and Stamford, Connecticut, according to a study from Texas A&M Transportation Institute and INRIX Inc. This is largely due to traffic congestion on Interstate 95, leading commuters to pay an additional $1,174 in fuel costs.

4 / 20
Canva

#17. Tacoma, Washington

- Workers with commutes over 90 minutes: 5.3% (2.4% greater than national average)
- Workers with commutes over 60 minutes: 13.9% (4.6% greater than national average)
- Average one-way commute time to work: 30.1 minutes (11.9% greater than national average)
- Means of travel to work: 84.2% car, 6.7% public transportation, 4.2% other
- Workers who commute outside their county of residence: 29.8%
- Workers who commute outside their state of residence: 0.5%

Tacoma is Seattle’s largest satellite city, and since nearly half of workers living in Pierce County (where Tacoma is located) commute elsewhere for work, poor traffic conditions reflect that reality. Many commit to these long commutes because Pierce County generally has much more affordable housing, but Seattle has more jobs and higher wages, and is home to major companies like Amazon and Microsoft.

5 / 20
Canva

#16. Baltimore, Maryland

- Workers with commutes over 90 minutes: 5.3% (2.4% greater than national average)
- Workers with commutes over 60 minutes: 13.1% (3.8% greater than national average)
- Average one-way commute time to work: 31.4 minutes (16.7% greater than national average)
- Means of travel to work: 69.0% car, 17.5% public transportation, 9.4% other
- Workers who commute outside their county of residence: 35.6%
- Workers who commute outside their state of residence: 3.1%

For years, Baltimore has boasted some of the longest commutes in the country, and that’s only worsened in the past decade. A lack of substantial public transportation in the suburbs contributes to this traffic congestion.

6 / 20
Canva

#15. Naperville, Illinois

- Workers with commutes over 90 minutes: 5.6% (2.7% greater than national average)
- Workers with commutes over 60 minutes: 20.1% (10.8% greater than national average)
- Average one-way commute time to work: 34.2 minutes (27.1% greater than national average)
- Means of travel to work: 77.0% car, 11.0% public transportation, 2.7% other
- Workers who commute outside their county of residence: 45.7%
- Workers who commute outside their state of residence: 1.5%

Located 28 miles away from Chicago, Naperville commuters often drive or take the train into the city to work. In Naperville, commuters deal with lack of parking spaces at the Naperville train station and the additional time it takes to get to their jobs once in Chicago if their offices aren’t close to Union Station, where the train drops them off.

7 / 20
Canva

#14. Ontario, California

- Workers with commutes over 90 minutes: 5.9% (2.9% greater than national average)
- Workers with commutes over 60 minutes: 15.9% (6.6% greater than national average)
- Average one-way commute time to work: 31.6 minutes (17.5% greater than national average)
- Means of travel to work: 92.0% car, 1.9% public transportation, 2.4% other
- Workers who commute outside their county of residence: 38.9%
- Workers who commute outside their state of residence: 0.4%

Ontario, California, is a popular destination for employees working in the Los Angeles metropolitan area to live, as 16% of commuters in the larger L.A. area travel from Ontario for work. One helpful change to traffic congestion could be the recent opening of the 91 Express Lanes.

8 / 20
JamesAndrews1 // Shutterstock

#13. Stamford, Connecticut

- Workers with commutes over 90 minutes: 6.2% (3.3% greater than national average)
- Workers with commutes over 60 minutes: 13.5% (4.2% greater than national average)
- Average one-way commute time to work: 28.2 minutes (4.8% greater than national average)
- Means of travel to work: 75.2% car, 13.6% public transportation, 7.0% other
- Workers who commute outside their county of residence: 2.0%
- Workers who commute outside their state of residence: 21.5%

One factor leading to increased commute times in Stamford, Connecticut, is the sheer number of commuters. People commute to both New York City and New Haven, Connecticut, from the city. These trips could be improved by replacing the 100-year-old, outdated bridges (such as those going over the Norwalk and Mianus rivers) that Metro-North trains go over.

9 / 20
Canva

#12. Riverside, California

- Workers with commutes over 90 minutes: 6.4% (3.5% greater than national average)
- Workers with commutes over 60 minutes: 15.8% (6.5% greater than national average)
- Average one-way commute time to work: 31.4 minutes (16.7% greater than national average)
- Means of travel to work: 89.0% car, 2.4% public transportation, 4.6% other
- Workers who commute outside their county of residence: 30.7%
- Workers who commute outside their state of residence: 0.2%

In recent years, the number of supercommuters from Riverside County rose a whopping 31%. The average commute time for a Riverside resident increased by 13.38% from 2014 to 2019.

10 / 20
Canva

#11. Yonkers, New York

- Workers with commutes over 90 minutes: 6.4% (3.5% greater than national average)
- Workers with commutes over 60 minutes: 20.7% (11.4% greater than national average)
- Average one-way commute time to work: 35.0 minutes (30.1% greater than national average)
- Means of travel to work: 63.8% car, 26.9% public transportation, 6.6% other
- Workers who commute outside their county of residence: 39.4%
- Workers who commute outside their state of residence: 3.2%

In addition to the general metropolitan congestion during the commute to New York City, Yonkers is particularly hindered by having a large percentage of commuters. It has the country’s 11th highest percentage of public transit users, which is expected to grow more crowded as new downtown residential developments continue to open.

11 / 20
Canva

#10. Rancho Cucamonga, California

- Workers with commutes over 90 minutes: 6.4% (3.5% greater than national average)
- Workers with commutes over 60 minutes: 16.7% (7.4% greater than national average)
- Average one-way commute time to work: 32.1 minutes (19.3% greater than national average)
- Means of travel to work: 90.9% car, 1.7% public transportation, 1.9% other
- Workers who commute outside their county of residence: 36.1%
- Workers who commute outside their state of residence: 0.5%

Rancho Cucamonga is located just over an hour from Los Angeles without traffic, but that becomes much worse during the area’s famously congested rush hour. Of the 280,000 daily L.A. commuters on California’s 91 Freeway, many drivers spend an average of 90 hours a year in traffic.

12 / 20
Canva

#9. Corona, California

- Workers with commutes over 90 minutes: 6.6% (3.7% greater than national average)
- Workers with commutes over 60 minutes: 23.9% (14.6% greater than national average)
- Average one-way commute time to work: 37.1 minutes (37.9% greater than national average)
- Means of travel to work: 90.3% car, 1.6% public transportation, 3.4% other
- Workers who commute outside their county of residence: 47.0%
- Workers who commute outside their state of residence: 0.4%

Corona residents’ commute time to Los Angeles is about six minutes longer than the average L.A. commute. A certain stretch of the 91 Freeway is nicknamed the “Corona Crawl,” with reliable bumper-to-bumper traffic. A $1.4 billion project that ended in 2017 only slightly eased the traffic.

13 / 20
Sundry Photography // Shutterstock

#8. Concord, California

- Workers with commutes over 90 minutes: 6.7% (3.8% greater than national average)
- Workers with commutes over 60 minutes: 22.2% (12.9% greater than national average)
- Average one-way commute time to work: 35.6 minutes (32.3% greater than national average)
- Means of travel to work: 78.5% car, 11.1% public transportation, 5.5% other
- Workers who commute outside their county of residence: 32.2%
- Workers who commute outside their state of residence: 0.3%

Concord is a Bay Area city where residents have been impacted by worsening Bay Area traffic. Traffic is bad for Concord residents even before they get onto the highway, leading Concord officials to reduce the length of time traffic lights remain green throughout the city in 2017.

14 / 20
Real Window Creative // Shutterstock

#7. Newark, New Jersey

- Workers with commutes over 90 minutes: 7.0% (4.1% greater than national average)
- Workers with commutes over 60 minutes: 19.2% (9.9% greater than national average)
- Average one-way commute time to work: 35.2 minutes (30.9% greater than national average)
- Means of travel to work: 62.0% car, 25.7% public transportation, 10.8% other
- Workers who commute outside their county of residence: 32.9%
- Workers who commute outside their state of residence: 11.8%

Newark is already congested as New Jersey’s largest city, but it’s made worse by the many residents who commute to nearby New York City and Jersey City. To make things more congested, Newark sits at the crossroads of busy roads like the New Jersey Turnpike, Route 21, I-78, and 280.

15 / 20
Blinking Dog Productions // Shutterstock

#6. Santa Clarita, California

- Workers with commutes over 90 minutes: 7.3% (4.4% greater than national average)
- Workers with commutes over 60 minutes: 22.2% (12.9% greater than national average)
- Average one-way commute time to work: 36.8 minutes (36.8% greater than national average)
- Means of travel to work: 88.1% car, 2.7% public transportation, 2.7% other
- Workers who commute outside their county of residence: 3.8%
- Workers who commute outside their state of residence: 0.6%

Santa Clarita is another Los Angeles-adjacent city where citizens suffer from long commute times, with Santa Clarita city planning manager Jason Crawford in 2019 guessing that around half of the population leaves the Santa Clarita Valley for their jobs. The city is focusing on adding job centers, like a Newhall business park and the Needham Ranch project, to the city so residents won’t have to travel far for employment.

16 / 20
Pack-Shot // Shutterstock

#5. Modesto, California

- Workers with commutes over 90 minutes: 7.6% (4.6% greater than national average)
- Workers with commutes over 60 minutes: 12.7% (3.4% greater than national average)
- Average one-way commute time to work: 28.3 minutes (5.2% greater than national average)
- Means of travel to work: 92.2% car, 1.2% public transportation, 2.0% other
- Workers who commute outside their county of residence: 23.9%
- Workers who commute outside their state of residence: 0.4%

The Modesto area produces some of the most supercommuters in the Bay Area as many choose to commute to the Bay Area’s much busier employment market while enjoying Modesto’s competitive housing market. However, commute times have been steadily getting worse, with the number of supercommuters increasing by 3.3% from 2005 to 2017.

17 / 20
Canva

#4. New York, New York

- Workers with commutes over 90 minutes: 7.7% (4.7% greater than national average)
- Workers with commutes over 60 minutes: 27.2% (17.9% greater than national average)
- Average one-way commute time to work: 41.5 minutes (54.3% greater than national average)
- Means of travel to work: 26.7% car, 56.0% public transportation, 13.6% other
- Workers who commute outside their county of residence: 43.0%
- Workers who commute outside their state of residence: 2.7%

The high percentage of supercommuters is partially to blame on unreliable public transit, as well as the fact that people from many different nearby areas (such as Long Island, New Jersey, and Connecticut) commute to and from New York City each day. Workers living in Manhattan generally have some of the shortest commutes in the city, with Williamsburg residents spending the least amount of time traveling to and from work on average.

18 / 20
Canva

#3. Fontana, California

- Workers with commutes over 90 minutes: 7.9% (5.0% greater than national average)
- Workers with commutes over 60 minutes: 18.1% (8.8% greater than national average)
- Average one-way commute time to work: 33.8 minutes (25.7% greater than national average)
- Means of travel to work: 89.9% car, 1.8% public transportation, 2.1% other
- Workers who commute outside their county of residence: 30.7%
- Workers who commute outside their state of residence: 0.3%

The city of Fontana has steadily grown in recent years, largely because it has some of the most affordable real estate in the Inland Empire. However, that also means that more people are commuting to Los Angeles from the area (around 54%), with highways becoming further congested because Fontana is a hub of the trucking industry.

19 / 20
MattLphotography // Shutterstock

#2. Moreno Valley, California

- Workers with commutes over 90 minutes: 8.3% (5.4% greater than national average)
- Workers with commutes over 60 minutes: 18.6% (9.3% greater than national average)
- Average one-way commute time to work: data not available
- Means of travel to work: 93.8% car, 1.2% public transportation, 2.4% other
- Workers who commute outside their county of residence: 31.5%
- Workers who commute outside their state of residence: 0.2%

With such a high percentage of residents traveling to work in the car, congestion only exacerbates long commute times for Moreno Valley residents. That traffic is compounded by the fact that around 80% of workers drive to work alone.

20 / 20
Sundry Photography // Shutterstock

#1. Stockton, California

- Workers with commutes over 90 minutes: 8.4% (5.5% greater than national average)
- Workers with commutes over 60 minutes: 17.1% (7.8% greater than national average)
- Average one-way commute time to work: 31.1 minutes (15.6% greater than national average)
- Means of travel to work: 95.6% car, 1.9% public transportation, 2.5% other
- Workers who commute outside their county of residence: 18.1%
- Workers who commute outside their state of residence: 0.4%

Like Modesta, Stockton also has a massive number of supercommuters because it’s on the precipice of the much larger Bay Area job market. A 2019 study found that 11% of the city’s full-time workforce travels almost three hours for work per day.

Trending Now