Counties with the worst commutes in Kentucky
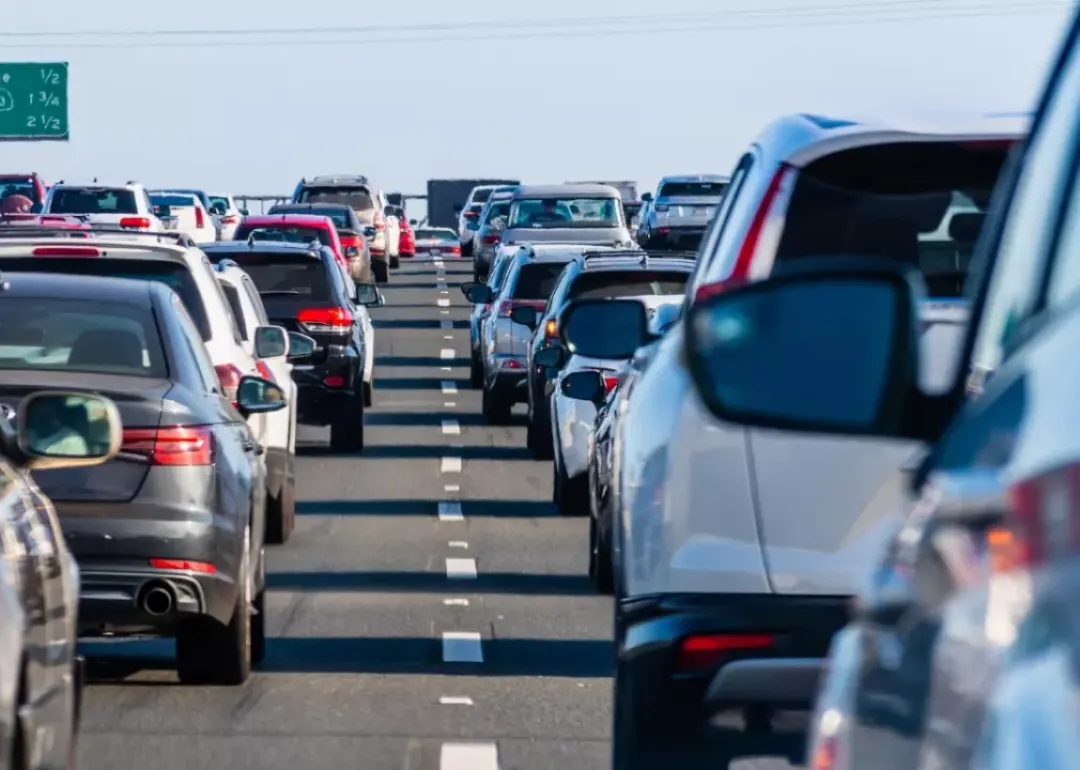
Commuting easily ranks as one of the least enjoyable parts of a person's day. Commuters encounter more physical health problems, and low-income commuters are less likely to gain financial stability—among a host of other negative impacts. And yet, America's commutes keep getting longer as people move farther away from the office, according to Census Bureau data.
Stacker compiled a list of counties with the worst commutes in Kentucky, using 2021 data from the Census Bureau. Counties are ranked by longest average commute time in 2021 among workers over the age of 16, excluding those who work from home. Think you have a long trip to work? Read on to compare it against the worst commutes statewide.
#50. Crittenden County
- Average commute to work: 27 minutes
- Share with commutes over an hour: 9.7%
- Share that worked outside their county of residence: 41.3%
- Means of transportation to work:
--- Drove alone: 73.7%
--- Carpooled: 16.4%
--- Public transportation: 0%
--- Walked: 5%
--- Bicycle: 0%
--- Taxicab, motorcycle, or other means: 0%
--- Worked from home: 4.9%
#48. Knott County (tie)
- Average commute to work: 27.1 minutes
- Share with commutes over an hour: 8.3%
- Share that worked outside their county of residence: 47.4%
- Means of transportation to work:
--- Drove alone: 76.2%
--- Carpooled: 9.3%
--- Public transportation: 0.5%
--- Walked: 5.5%
--- Bicycle: 0%
--- Taxicab, motorcycle, or other means: 1.3%
--- Worked from home: 7.2%
#48. Larue County (tie)
- Average commute to work: 27.1 minutes
- Share with commutes over an hour: 6.6%
- Share that worked outside their county of residence: 70.5%
- Means of transportation to work:
--- Drove alone: 83%
--- Carpooled: 12.1%
--- Public transportation: 0%
--- Walked: 0.2%
--- Bicycle: 0%
--- Taxicab, motorcycle, or other means: 0.1%
--- Worked from home: 4.6%
#46. Bath County (tie)
- Average commute to work: 27.2 minutes
- Share with commutes over an hour: 10.8%
- Share that worked outside their county of residence: 67%
- Means of transportation to work:
--- Drove alone: 82.7%
--- Carpooled: 11.3%
--- Public transportation: 0%
--- Walked: 2.4%
--- Bicycle: 0%
--- Taxicab, motorcycle, or other means: 0%
--- Worked from home: 3.5%
#46. Webster County (tie)
- Average commute to work: 27.2 minutes
- Share with commutes over an hour: 10.3%
- Share that worked outside their county of residence: 52%
- Means of transportation to work:
--- Drove alone: 84.5%
--- Carpooled: 11.6%
--- Public transportation: 0%
--- Walked: 1.7%
--- Bicycle: 0.2%
--- Taxicab, motorcycle, or other means: 0.3%
--- Worked from home: 1.7%
#44. Anderson County (tie)
- Average commute to work: 27.4 minutes
- Share with commutes over an hour: 6.3%
- Share that worked outside their county of residence: 63.7%
- Means of transportation to work:
--- Drove alone: 81.9%
--- Carpooled: 8.5%
--- Public transportation: 0.1%
--- Walked: 0.8%
--- Bicycle: 0%
--- Taxicab, motorcycle, or other means: 1%
--- Worked from home: 7.7%
#44. Grayson County (tie)
- Average commute to work: 27.4 minutes
- Share with commutes over an hour: 12.1%
- Share that worked outside their county of residence: 30.6%
- Means of transportation to work:
--- Drove alone: 81.5%
--- Carpooled: 11%
--- Public transportation: 0.3%
--- Walked: 2.1%
--- Bicycle: 0%
--- Taxicab, motorcycle, or other means: 1.8%
--- Worked from home: 3.3%
#43. Trimble County
- Average commute to work: 27.7 minutes
- Share with commutes over an hour: 4.3%
- Share that worked outside their county of residence: 54.3%
- Means of transportation to work:
--- Drove alone: 79.8%
--- Carpooled: 13%
--- Public transportation: 0%
--- Walked: 1.4%
--- Bicycle: 0%
--- Taxicab, motorcycle, or other means: 1.7%
--- Worked from home: 4%
#42. Mercer County
- Average commute to work: 28 minutes
- Share with commutes over an hour: 9.1%
- Share that worked outside their county of residence: 46.1%
- Means of transportation to work:
--- Drove alone: 80.5%
--- Carpooled: 12.3%
--- Public transportation: 0.3%
--- Walked: 0.2%
--- Bicycle: 0%
--- Taxicab, motorcycle, or other means: 0.3%
--- Worked from home: 6.4%
#39. Bullitt County (tie)
- Average commute to work: 28.3 minutes
- Share with commutes over an hour: 3.6%
- Share that worked outside their county of residence: 64.8%
- Means of transportation to work:
--- Drove alone: 84.5%
--- Carpooled: 8.1%
--- Public transportation: 0.1%
--- Walked: 0.8%
--- Bicycle: 0.1%
--- Taxicab, motorcycle, or other means: 1%
--- Worked from home: 5.5%
#39. Hart County (tie)
- Average commute to work: 28.3 minutes
- Share with commutes over an hour: 11.4%
- Share that worked outside their county of residence: 39.6%
- Means of transportation to work:
--- Drove alone: 78.5%
--- Carpooled: 14.6%
--- Public transportation: 0.2%
--- Walked: 0.6%
--- Bicycle: 0%
--- Taxicab, motorcycle, or other means: 2.8%
--- Worked from home: 3.2%
#39. Letcher County (tie)
- Average commute to work: 28.3 minutes
- Share with commutes over an hour: 11.4%
- Share that worked outside their county of residence: 26%
- Means of transportation to work:
--- Drove alone: 76.4%
--- Carpooled: 10.7%
--- Public transportation: 1%
--- Walked: 3.6%
--- Bicycle: 0%
--- Taxicab, motorcycle, or other means: 1.4%
--- Worked from home: 6.9%
#36. Johnson County (tie)
- Average commute to work: 28.5 minutes
- Share with commutes over an hour: 12%
- Share that worked outside their county of residence: 36.4%
- Means of transportation to work:
--- Drove alone: 82.9%
--- Carpooled: 10.2%
--- Public transportation: 0.2%
--- Walked: 0.1%
--- Bicycle: 0%
--- Taxicab, motorcycle, or other means: 0.1%
--- Worked from home: 6.5%
#36. Martin County (tie)
- Average commute to work: 28.5 minutes
- Share with commutes over an hour: 12.7%
- Share that worked outside their county of residence: 15%
- Means of transportation to work:
--- Drove alone: 89%
--- Carpooled: 8.3%
--- Public transportation: 0%
--- Walked: 0.1%
--- Bicycle: 0%
--- Taxicab, motorcycle, or other means: 0%
--- Worked from home: 2.6%
#36. McLean County (tie)
- Average commute to work: 28.5 minutes
- Share with commutes over an hour: 10.1%
- Share that worked outside their county of residence: 57%
- Means of transportation to work:
--- Drove alone: 86.7%
--- Carpooled: 5%
--- Public transportation: 0.1%
--- Walked: 3.3%
--- Bicycle: 0%
--- Taxicab, motorcycle, or other means: 1.7%
--- Worked from home: 3.2%
#35. Monroe County
- Average commute to work: 28.6 minutes
- Share with commutes over an hour: 11.5%
- Share that worked outside their county of residence: 26.1%
- Means of transportation to work:
--- Drove alone: 79.7%
--- Carpooled: 12%
--- Public transportation: 0.5%
--- Walked: 2%
--- Bicycle: 0%
--- Taxicab, motorcycle, or other means: 1.1%
--- Worked from home: 4.9%
#34. Grant County
- Average commute to work: 28.7 minutes
- Share with commutes over an hour: 8.4%
- Share that worked outside their county of residence: 54.6%
- Means of transportation to work:
--- Drove alone: 82.6%
--- Carpooled: 10.7%
--- Public transportation: 0%
--- Walked: 2.3%
--- Bicycle: 0%
--- Taxicab, motorcycle, or other means: 0.9%
--- Worked from home: 3.5%
#31. Butler County (tie)
- Average commute to work: 29 minutes
- Share with commutes over an hour: 8.6%
- Share that worked outside their county of residence: 48.1%
- Means of transportation to work:
--- Drove alone: 82.8%
--- Carpooled: 12.8%
--- Public transportation: 0.4%
--- Walked: 0.9%
--- Bicycle: 0%
--- Taxicab, motorcycle, or other means: 0.4%
--- Worked from home: 2.7%
#31. Henry County (tie)
- Average commute to work: 29 minutes
- Share with commutes over an hour: 6.5%
- Share that worked outside their county of residence: 61.9%
- Means of transportation to work:
--- Drove alone: 79.9%
--- Carpooled: 10.5%
--- Public transportation: 0%
--- Walked: 1.5%
--- Bicycle: 0%
--- Taxicab, motorcycle, or other means: 0.5%
--- Worked from home: 7.6%
#31. Powell County (tie)
- Average commute to work: 29 minutes
- Share with commutes over an hour: 14.6%
- Share that worked outside their county of residence: 49%
- Means of transportation to work:
--- Drove alone: 87.7%
--- Carpooled: 8.1%
--- Public transportation: 0.2%
--- Walked: 0.7%
--- Bicycle: 0%
--- Taxicab, motorcycle, or other means: 0.3%
--- Worked from home: 3.1%
#29. Harrison County (tie)
- Average commute to work: 29.1 minutes
- Share with commutes over an hour: 12.1%
- Share that worked outside their county of residence: 47.1%
- Means of transportation to work:
--- Drove alone: 82%
--- Carpooled: 9.9%
--- Public transportation: 0%
--- Walked: 2.4%
--- Bicycle: 0%
--- Taxicab, motorcycle, or other means: 1.3%
--- Worked from home: 4.4%
#29. Lawrence County (tie)
- Average commute to work: 29.1 minutes
- Share with commutes over an hour: 9.5%
- Share that worked outside their county of residence: 36.5%
- Means of transportation to work:
--- Drove alone: 84.6%
--- Carpooled: 10.4%
--- Public transportation: 0.7%
--- Walked: 0.5%
--- Bicycle: 0%
--- Taxicab, motorcycle, or other means: 0.7%
--- Worked from home: 3.2%
#28. Clay County
- Average commute to work: 29.3 minutes
- Share with commutes over an hour: 14.9%
- Share that worked outside their county of residence: 30.1%
- Means of transportation to work:
--- Drove alone: 75.7%
--- Carpooled: 14.7%
--- Public transportation: 0%
--- Walked: 0.9%
--- Bicycle: 0%
--- Taxicab, motorcycle, or other means: 1.6%
--- Worked from home: 7.1%
#27. McCreary County
- Average commute to work: 29.4 minutes
- Share with commutes over an hour: 10.4%
- Share that worked outside their county of residence: 32.8%
- Means of transportation to work:
--- Drove alone: 79.6%
--- Carpooled: 11.4%
--- Public transportation: 0%
--- Walked: 2.5%
--- Bicycle: 0.8%
--- Taxicab, motorcycle, or other means: 0.9%
--- Worked from home: 4.8%
#26. Green County
- Average commute to work: 29.9 minutes
- Share with commutes over an hour: 12.3%
- Share that worked outside their county of residence: 60.1%
- Means of transportation to work:
--- Drove alone: 78.3%
--- Carpooled: 12.7%
--- Public transportation: 1.8%
--- Walked: 1.1%
--- Bicycle: 0%
--- Taxicab, motorcycle, or other means: 1.1%
--- Worked from home: 5.2%
#23. Breathitt County (tie)
- Average commute to work: 30.7 minutes
- Share with commutes over an hour: 16.1%
- Share that worked outside their county of residence: 44.4%
- Means of transportation to work:
--- Drove alone: 80.5%
--- Carpooled: 12.2%
--- Public transportation: 0%
--- Walked: 4%
--- Bicycle: 0.4%
--- Taxicab, motorcycle, or other means: 0.7%
--- Worked from home: 2.3%
#23. Carter County (tie)
- Average commute to work: 30.7 minutes
- Share with commutes over an hour: 9.2%
- Share that worked outside their county of residence: 38.9%
- Means of transportation to work:
--- Drove alone: 79.5%
--- Carpooled: 13.5%
--- Public transportation: 0%
--- Walked: 3.2%
--- Bicycle: 0%
--- Taxicab, motorcycle, or other means: 0.8%
--- Worked from home: 3%
#23. Lincoln County (tie)
- Average commute to work: 30.7 minutes
- Share with commutes over an hour: 12.9%
- Share that worked outside their county of residence: 60.3%
- Means of transportation to work:
--- Drove alone: 80.7%
--- Carpooled: 9.8%
--- Public transportation: 0.6%
--- Walked: 1.8%
--- Bicycle: 0%
--- Taxicab, motorcycle, or other means: 0.6%
--- Worked from home: 6.6%
#21. Casey County (tie)
- Average commute to work: 31.5 minutes
- Share with commutes over an hour: 13.4%
- Share that worked outside their county of residence: 43.1%
- Means of transportation to work:
--- Drove alone: 77.1%
--- Carpooled: 12.8%
--- Public transportation: 0.8%
--- Walked: 1.6%
--- Bicycle: 0.5%
--- Taxicab, motorcycle, or other means: 0.6%
--- Worked from home: 6.6%
#21. Fleming County (tie)
- Average commute to work: 31.5 minutes
- Share with commutes over an hour: 16.5%
- Share that worked outside their county of residence: 45.8%
- Means of transportation to work:
--- Drove alone: 79%
--- Carpooled: 12.8%
--- Public transportation: 0.1%
--- Walked: 1.5%
--- Bicycle: 0.1%
--- Taxicab, motorcycle, or other means: 0.5%
--- Worked from home: 6%
#20. Magoffin County
- Average commute to work: 32.4 minutes
- Share with commutes over an hour: 15.4%
- Share that worked outside their county of residence: 47.6%
- Means of transportation to work:
--- Drove alone: 83.3%
--- Carpooled: 11%
--- Public transportation: 0.6%
--- Walked: 2.7%
--- Bicycle: 0%
--- Taxicab, motorcycle, or other means: 0.7%
--- Worked from home: 1.7%
#18. Meade County (tie)
- Average commute to work: 32.6 minutes
- Share with commutes over an hour: 14.3%
- Share that worked outside their county of residence: 60.1%
- Means of transportation to work:
--- Drove alone: 83.2%
--- Carpooled: 9.1%
--- Public transportation: 0.6%
--- Walked: 1%
--- Bicycle: 0%
--- Taxicab, motorcycle, or other means: 0.8%
--- Worked from home: 5.4%
#18. Spencer County (tie)
- Average commute to work: 32.6 minutes
- Share with commutes over an hour: 8.8%
- Share that worked outside their county of residence: 74.5%
- Means of transportation to work:
--- Drove alone: 84.2%
--- Carpooled: 7.1%
--- Public transportation: 0.1%
--- Walked: 0.5%
--- Bicycle: 0%
--- Taxicab, motorcycle, or other means: 0.6%
--- Worked from home: 7.5%
#17. Morgan County
- Average commute to work: 33.4 minutes
- Share with commutes over an hour: 18.5%
- Share that worked outside their county of residence: 33.1%
- Means of transportation to work:
--- Drove alone: 83.1%
--- Carpooled: 9.5%
--- Public transportation: 0.4%
--- Walked: 0.3%
--- Bicycle: 0%
--- Taxicab, motorcycle, or other means: 0.2%
--- Worked from home: 6.6%
#16. Breckinridge County
- Average commute to work: 33.8 minutes
- Share with commutes over an hour: 21.3%
- Share that worked outside their county of residence: 43.9%
- Means of transportation to work:
--- Drove alone: 80.3%
--- Carpooled: 12.2%
--- Public transportation: 0.6%
--- Walked: 1.3%
--- Bicycle: 0.2%
--- Taxicab, motorcycle, or other means: 2.2%
--- Worked from home: 3.3%
#15. Edmonson County
- Average commute to work: 34 minutes
- Share with commutes over an hour: 12%
- Share that worked outside their county of residence: 63.9%
- Means of transportation to work:
--- Drove alone: 82.1%
--- Carpooled: 9.4%
--- Public transportation: 0%
--- Walked: 4.6%
--- Bicycle: 0%
--- Taxicab, motorcycle, or other means: 0.4%
--- Worked from home: 3.5%
#14. Garrard County
- Average commute to work: 34.1 minutes
- Share with commutes over an hour: 13.4%
- Share that worked outside their county of residence: 64.8%
- Means of transportation to work:
--- Drove alone: 80.7%
--- Carpooled: 8.9%
--- Public transportation: 0%
--- Walked: 0.3%
--- Bicycle: 0%
--- Taxicab, motorcycle, or other means: 0.5%
--- Worked from home: 9.6%
#13. Estill County
- Average commute to work: 34.5 minutes
- Share with commutes over an hour: 19.4%
- Share that worked outside their county of residence: 54%
- Means of transportation to work:
--- Drove alone: 75.3%
--- Carpooled: 16%
--- Public transportation: 0%
--- Walked: 3.2%
--- Bicycle: 0%
--- Taxicab, motorcycle, or other means: 0.5%
--- Worked from home: 5%
#12. Bracken County
- Average commute to work: 34.9 minutes
- Share with commutes over an hour: 22.1%
- Share that worked outside their county of residence: 51.5%
- Means of transportation to work:
--- Drove alone: 79.7%
--- Carpooled: 14.5%
--- Public transportation: 0.2%
--- Walked: 1.9%
--- Bicycle: 0%
--- Taxicab, motorcycle, or other means: 1.2%
--- Worked from home: 2.5%
#11. Pendleton County
- Average commute to work: 36.3 minutes
- Share with commutes over an hour: 16%
- Share that worked outside their county of residence: 58.2%
- Means of transportation to work:
--- Drove alone: 85.4%
--- Carpooled: 6%
--- Public transportation: 0.7%
--- Walked: 2%
--- Bicycle: 0%
--- Taxicab, motorcycle, or other means: 0.3%
--- Worked from home: 5.6%
#10. Owsley County
- Average commute to work: 36.5 minutes
- Share with commutes over an hour: 20.6%
- Share that worked outside their county of residence: 36%
- Means of transportation to work:
--- Drove alone: 76%
--- Carpooled: 12.6%
--- Public transportation: 0%
--- Walked: 2.9%
--- Bicycle: 0%
--- Taxicab, motorcycle, or other means: 4.1%
--- Worked from home: 4.5%
#9. Robertson County
- Average commute to work: 37.6 minutes
- Share with commutes over an hour: 23.2%
- Share that worked outside their county of residence: 50.6%
- Means of transportation to work:
--- Drove alone: 92.1%
--- Carpooled: 2.4%
--- Public transportation: 0%
--- Walked: 0%
--- Bicycle: 0%
--- Taxicab, motorcycle, or other means: 0%
--- Worked from home: 5.6%
#8. Leslie County
- Average commute to work: 37.9 minutes
- Share with commutes over an hour: 23.4%
- Share that worked outside their county of residence: 52.9%
- Means of transportation to work:
--- Drove alone: 87.1%
--- Carpooled: 10.7%
--- Public transportation: 0%
--- Walked: 0.2%
--- Bicycle: 0%
--- Taxicab, motorcycle, or other means: 0%
--- Worked from home: 2%
#6. Lee County (tie)
- Average commute to work: 38.8 minutes
- Share with commutes over an hour: 24.4%
- Share that worked outside their county of residence: 44.2%
- Means of transportation to work:
--- Drove alone: 77.9%
--- Carpooled: 10.5%
--- Public transportation: 0%
--- Walked: 3.7%
--- Bicycle: 1.4%
--- Taxicab, motorcycle, or other means: 1.1%
--- Worked from home: 5.4%
#6. Nicholas County (tie)
- Average commute to work: 38.8 minutes
- Share with commutes over an hour: 22.7%
- Share that worked outside their county of residence: 64%
- Means of transportation to work:
--- Drove alone: 83.1%
--- Carpooled: 11.8%
--- Public transportation: 0%
--- Walked: 1.2%
--- Bicycle: 0%
--- Taxicab, motorcycle, or other means: 0.7%
--- Worked from home: 3.2%
#5. Menifee County
- Average commute to work: 39.7 minutes
- Share with commutes over an hour: 20.5%
- Share that worked outside their county of residence: 60.4%
- Means of transportation to work:
--- Drove alone: 79.7%
--- Carpooled: 8.2%
--- Public transportation: 0%
--- Walked: 0.4%
--- Bicycle: 0%
--- Taxicab, motorcycle, or other means: 0%
--- Worked from home: 11.7%
#4. Owen County
- Average commute to work: 39.8 minutes
- Share with commutes over an hour: 20.6%
- Share that worked outside their county of residence: 60.7%
- Means of transportation to work:
--- Drove alone: 78.4%
--- Carpooled: 12.7%
--- Public transportation: 0.2%
--- Walked: 2.7%
--- Bicycle: 0%
--- Taxicab, motorcycle, or other means: 0.5%
--- Worked from home: 5.6%
#3. Elliott County
- Average commute to work: 39.9 minutes
- Share with commutes over an hour: 16.9%
- Share that worked outside their county of residence: 55.8%
- Means of transportation to work:
--- Drove alone: 77.7%
--- Carpooled: 16.9%
--- Public transportation: 0.2%
--- Walked: 1.1%
--- Bicycle: 0%
--- Taxicab, motorcycle, or other means: 0.8%
--- Worked from home: 3.3%
#2. Jackson County
- Average commute to work: 40.5 minutes
- Share with commutes over an hour: 24.2%
- Share that worked outside their county of residence: 59.2%
- Means of transportation to work:
--- Drove alone: 73.8%
--- Carpooled: 17%
--- Public transportation: 0.9%
--- Walked: 2.6%
--- Bicycle: 0%
--- Taxicab, motorcycle, or other means: 1%
--- Worked from home: 4.7%
#1. Lewis County
- Average commute to work: 45.9 minutes
- Share with commutes over an hour: 28.1%
- Share that worked outside their county of residence: 39.8%
- Means of transportation to work:
--- Drove alone: 77.1%
--- Carpooled: 11.6%
--- Public transportation: 0%
--- Walked: 0.6%
--- Bicycle: 0%
--- Taxicab, motorcycle, or other means: 0.5%
--- Worked from home: 10.2%


