Stacker Studio

Metros where homes are selling the fastest

Written by:
May 11, 2021
Brian Goodman // Shutterstock

This story originally appeared on Stacker and was produced and distributed in partnership with Stacker Studio.

Metros where homes are selling the fastest

So much of life was slowed or halted altogether by the COVID-19 pandemic, from school plans to job changes to travel dreams. But housing markets have been sizzling in many parts of the country.

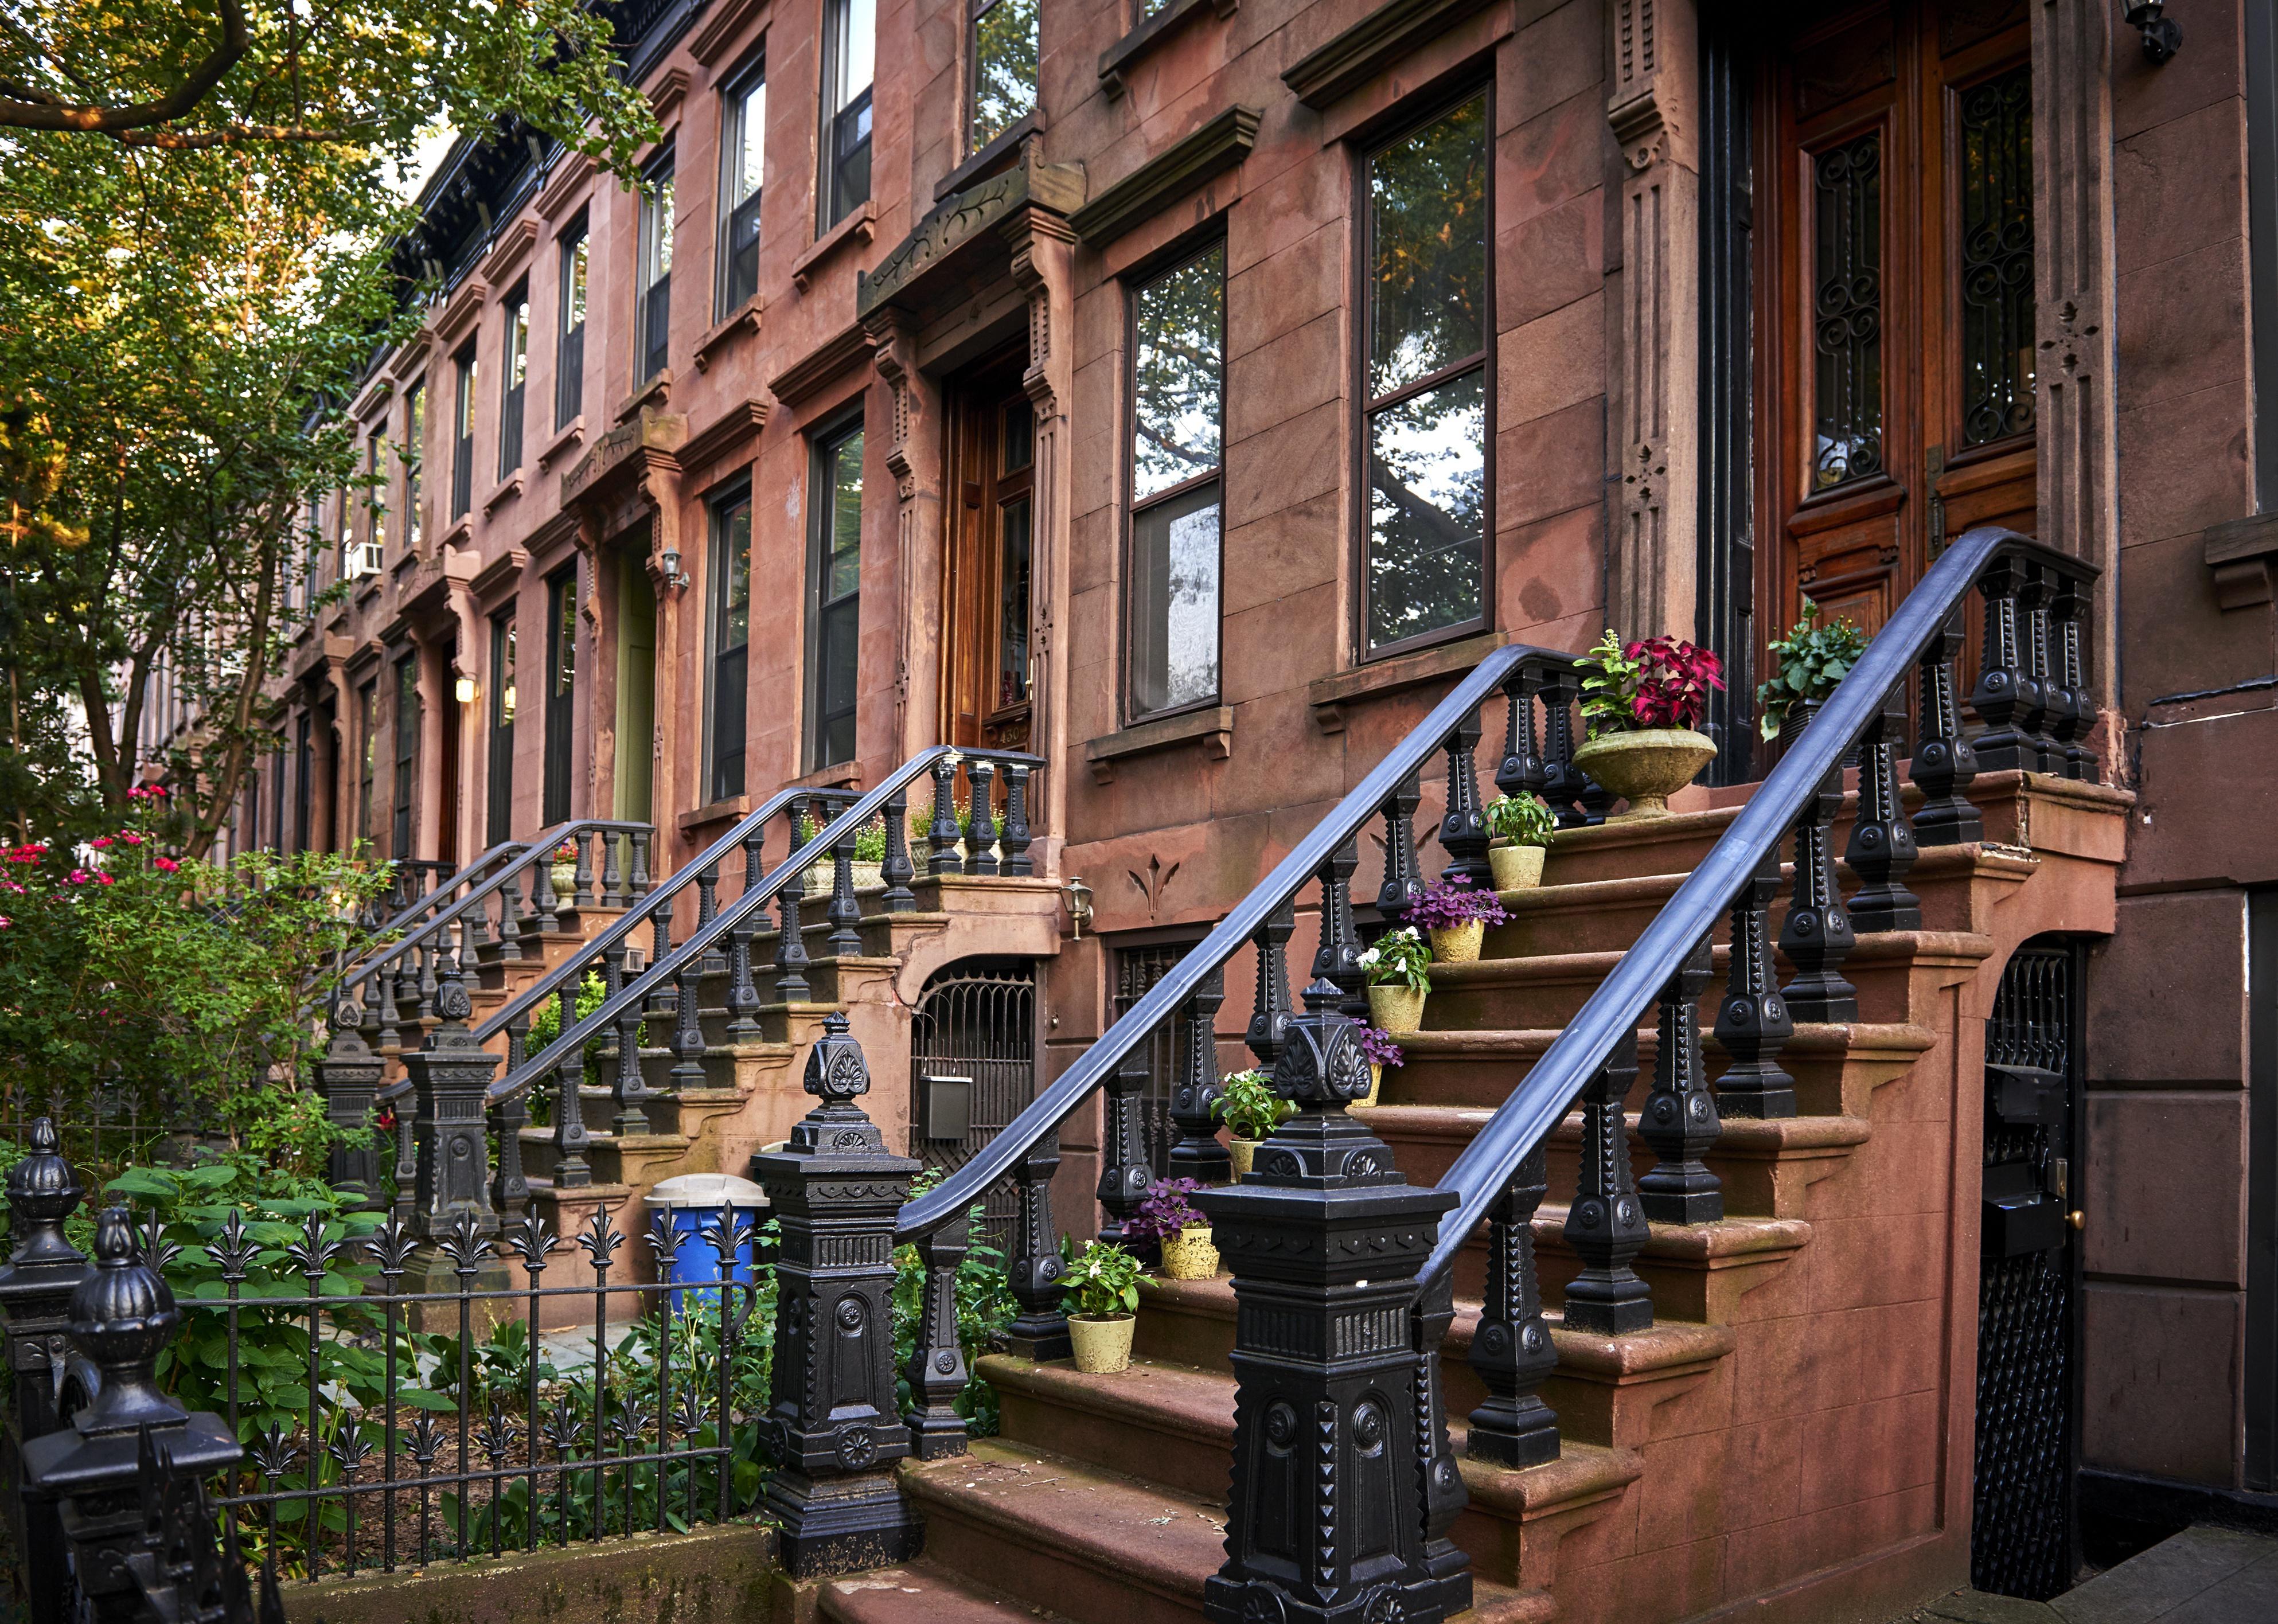
People who suddenly were forced to work from home found they didn’t necessarily have to live within commuting distance of their workplace. Workers found themselves wanting extra space for home offices, and families craved more room for children to study remotely and play outside safely.

Low mortgage rates helped stoke home-buying interest. But on the supply side, the number of homes for sale in spring 2021 has dropped by more than 28% from last year, according to industry figures. Many homeowners, especially older people, have been reluctant to put their houses on the market during a global health crisis. New construction, meanwhile, has been stymied by a rise in lumber prices—up a whopping 180% over last year—and a shortage of labor under the restrictions of protective COVID-19 protocols.

With such a skewed imbalance of supply and demand, sellers find themselves inundated at open houses and getting multiple offers for their homes within hours. Bids come pouring in well over the asking price, and houses on the market are snapped up before most buyers can even make a thoughtful decision, much less an offer. Such a vigorous seller’s market has propelled housing prices out of reach for many would-be purchasers. As of February 2021, the median sale price of homes was $288,667.

U.S. housing markets are so red hot that Credible decided to take a closer look and compile a list of 20 metro areas where homes are selling the fastest. Credible used data from Zillow and ranked homes according to the average number of days they were listed before there was a pending sale in December 2020, the most recent month in which data was available for all metros. Ties are broken by the median sale price of homes in February 2021, ranked from lowest to highest prices.

1 / 20
Harold Stiver // Shutterstock

#20. Louisville-Jefferson County, Kentucky

- Average days homes are listed before a pending sale (December 2020): 25
- Median sale price of homes in February 2021: $211,633 (29.1% less than national median)
- Houses for sale in February 2019: 4,994 (-34.7% change between 2019-2021)
- Houses for sale in February 2020: 4,761 (-31.5% change between 2020-2021)
- Houses for sale in February 2021: 3,262

Extremely low supply has driven the quick pace of the Louisville housing market. Older homeowners have been reluctant to move during the COVID-19 pandemic, opting to wait for safer times. At the same time, low mortgage rates have motivated a lot of first-home buyers, clamoring for inventory.

2 / 20
Sean Pavone // Shutterstock

#19. Memphis, Tennessee

- Average days homes are listed before a pending sale (December 2020): 25
- Median sale price of homes in February 2021: $215,817 (29.6% less than national median)
- Houses for sale in February 2019: 6,044 (-47.1% change between 2019-2021)
- Houses for sale in February 2020: 5,219 (-38.7% change between 2020-2021)
- Houses for sale in February 2021: 3,200

Housing inventory in Memphis was low before the pandemic and then dropped even lower. In the fall of 2020, for example, there were 30% fewer listings in the tri-county area of Shelby, Fayette, and Tipton than there were a year earlier. In part, demand has been driven by out-of-state investors buying residential real estate in Memphis for rentals. Major employers in the area include FedEx, founded in Memphis in the 1970s.

3 / 20
Sean Pavone // Shutterstock

#18. Harrisburg, Pennsylvania

- Average days homes are listed before a pending sale (December 2020): 25
- Median sale price of homes in February 2021: $205,333 (31.9% less than national median)
- Houses for sale in February 2019: 1,847 (-32.6% change between 2019-2021)
- Houses for sale in February 2020: 1,834 (-32.1% change between 2020-2021)
- Houses for sale in February 2021: 1,245

The housing market in Harrisburg is benefiting from so many people working from home due to COVID-19. That sweeping change has motivated home buyers to consider not only the suburbs but also smaller cities like Harrisburg, the state capital. Its prices are considered affordable, and the city offers restaurants and shopping as well as outdoor activities like hiking and biking spots nearby.

4 / 20
Sean Pavone // Shutterstock

#17. Worcester, Massachusetts

- Average days homes are listed before a pending sale (December 2020): 24
- Median sale price of homes in February 2021: $320,633 (8.2% greater than national median)
- Houses for sale in February 2019: 2,813 (-45.7% change between 2019-2021)
- Houses for sale in February 2020: 2,515 (-39.2% change between 2020-2021)
- Houses for sale in February 2021: 1,528

Worcester is not far outside of Boston, which due to the local economy’s predominance of hospitals, colleges, and life science businesses, has fewer employees working from home than do other major urban centers. That has boosted demand for housing in cities like Worcester, which offers more space and is less than an hour’s drive away.

5 / 20
Sean Pavone // Shutterstock

#16. Indianapolis, Indiana

- Average days homes are listed before a pending sale (December 2020): 24
- Median sale price of homes in February 2021: $222,667 (25.2% less than national median)
- Houses for sale in February 2019: 6,837 (-25.8% change between 2019-2021)
- Houses for sale in February 2020: 7,166 (-29.2% change between 2020-2021)
- Houses for sale in February 2021: 5,070

Indianapolis ranks among the top inland U.S. cities for growth in the high-tech sector, and the employment prospects have lured job seekers and entrepreneurs. The Indianapolis area historically has offered affordable housing prices and a cost of living lower than the national average.

6 / 20
Kevin Ruck // Shutterstock

#15. Charlotte, North Carolina

- Average days homes are listed before a pending sale (December 2020): 23
- Median sale price of homes in February 2021: $293,333 (0.1% greater than national median)
- Houses for sale in February 2019: 11,040 (-35.2% change between 2019-2021)
- Houses for sale in February 2020: 11,451 (-37.5% change between 2020-2021)
- Houses for sale in February 2021: 7,154

In 2020, housing prices in Charlotte rose for the eighth straight year, and the supply of homes for sale fell in early 2021 to the lowest level in 17 years. In terms of investment quality, the median price of a home in Charlotte has appreciated by more than 90% since 2012. Most recently, the city has seen the release of pent-up demand from buyers seeking relief from more expensive markets in the west and north.

7 / 20
Sean Pavone // Shutterstock

#14. Richmond, Virginia

- Average days homes are listed before a pending sale (December 2020): 23
- Median sale price of homes in February 2021: $288,305 (1.4% less than national median)
- Houses for sale in February 2019: 4,672 (-29.8% change between 2019-2021)
- Houses for sale in February 2020: 4,769 (-31.3% change between 2020-2021)
- Houses for sale in February 2021: 3,278

Listed houses are moving so fast in Richmond that one local realtor quoted in the media compared the market to a grocery delivery truck selling food in the parking lot and not even getting its produce inside to store shelves. Experts say the competition is favoring all-cash buyers and those with deep pockets able to come up with large down payments, squeezing low-income and first-time buyers out of the market.

8 / 20
Photosbykaity // Shutterstock

#13. Grand Rapids, Michigan

- Average days homes are listed before a pending sale (December 2020): 23
- Median sale price of homes in February 2021: $231,167 (20.6% less than national median)
- Houses for sale in February 2019: 3,296 (-32.6% change between 2019-2021)
- Houses for sale in February 2020: 3,300 (-32.7% change between 2020-2021)
- Houses for sale in February 2021: 2,220

Home prices in Grand Rapids grew by 6.8% in 2020, according to a Construction Coverage analysis. That rate is expected to duplicate itself in 2021, with 6.5% anticipated growth.

9 / 20
Sean Pavone // Shutterstock

#12. Cincinnati, Ohio

- Average days homes are listed before a pending sale (December 2020): 23
- Median sale price of homes in February 2021: $210,133 (30.7% less than national median)
- Houses for sale in February 2019: 7,992 (-37.0% change between 2019-2021)
- Houses for sale in February 2020: 7,177 (-29.8% change between 2020-2021)
- Houses for sale in February 2021: 5,038

Demand for homes in Cincinnati has been intensifying since as far back as the 2008 recession, when house building came to a halt and supply fell behind. This past year, people have been on the move, looking for more space, especially after they started working from home or children were studying remotely, according to local experts. Prices in Cincinnati are up about 20% over last year.

10 / 20
TJ Brown // Shutterstock

#11. Washington D.C.

- Average days homes are listed before a pending sale (December 2020): 22
- Median sale price of homes in February 2021: $447,000 (50.6% greater than national median)
- Houses for sale in February 2019: 17,706 (-24.0% change between 2019-2021)
- Houses for sale in February 2020: 16,699 (-19.4% change between 2020-2021)
- Houses for sale in February 2021: 13,465

Demand is surging for housing across Washington D.C., especially with inventory for attached homes (e.g., townhouses, duplexes, and condos) down 35% in March 2021 compared with a year earlier. The inventory of detached houses was off 51% for the same time period. As to cost, the median price of a home in the nation’s capital is 66% higher than it was a decade ago.

11 / 20
Johnny Habell // Shutterstock

#10. Sacramento, California

- Average days homes are listed before a pending sale (December 2020): 21
- Median sale price of homes in February 2021: $472,000 (63.0% greater than national median)
- Houses for sale in February 2019: 6,474 (-38.4% change between 2019-2021)
- Houses for sale in February 2020: 5,897 (-32.3% change between 2020-2021)
- Houses for sale in February 2021: 3,990

Home prices have soared in the Sacramento region as renters and residents of smaller homes have sought more space after working remotely during the pandemic. To help meet demand, lawmakers have proposed measures to boost housing production by rewriting zoning regulations and streamlining environmental reviews. Most recent efforts include a bill calling for construction of more duplex homes and a strategy to help first-time buyers with down payments.

12 / 20
Sean Pavone // Shutterstock

#9. Raleigh, North Carolina

- Average days homes are listed before a pending sale (December 2020): 21
- Median sale price of homes in February 2021: $316,663 (9.1% greater than national median)
- Houses for sale in February 2019: 6,710 (-43.7% change between 2019-2021)
- Houses for sale in February 2020: 7,571 (-50.1% change between 2020-2021)
- Houses for sale in February 2021: 3,778

The Raleigh housing market is so hot that in 2020, views per listed property jumped more than 80%, and that boom is predicted to continue into 2021. At the end of 2020, more than four out of five houses being resold were on the market a month or less, and more than a third of sales had closing prices higher than what was listed. Raleigh is known for its pleasant climate, quality of life, and access to education and jobs, especially in the state’s “Research Triangle” area, named after Duke University, the University of North Carolina at Chapel Hill, and North Carolina State University.

13 / 20
Sean Pavone // Shutterstock

#8. Columbus, Ohio

- Average days homes are listed before a pending sale (December 2020): 21
- Median sale price of homes in February 2021: $229,783 (22.0% less than national median)
- Houses for sale in February 2019: 5,324 (-28.0% change between 2019-2021)
- Houses for sale in February 2020: 5,330 (-28.1% change between 2020-2021)
- Houses for sale in February 2021: 3,832

The number of houses available for sale in central Ohio, where Columbus is located, hit a record low in February 2021. The number of housing permits issued to builders in 2020 rose by 46%, but new construction has been constrained by factors like the number of available workers and the cost of materials such as lumber.

14 / 20
Rigucci // Shutterstock

#7. Seattle, Washington

- Average days homes are listed before a pending sale (December 2020): 20
- Median sale price of homes in February 2021: $552,497 (91.2% greater than national median)
- Houses for sale in February 2019: 9,009 (-25.6% change between 2019-2021)
- Houses for sale in February 2020: 6,835 (-2.0% change between 2020-2021)
- Houses for sale in February 2021: 6,700

Housing prices were among the nation’s fastest growing at the start of 2021 in Seattle, up more than 14% from a year earlier. Prices rose most dramatically at the lower end of the market, compared with more expensive properties. Seattle has retained well-paying jobs, and its industries have weathered the pandemic’s blows, producing buyers with high incomes driving up the housing market.

15 / 20
Ami Parikh // Shutterstock

#6. Dayton, Ohio

- Average days homes are listed before a pending sale (December 2020): 20
- Median sale price of homes in February 2021: $160,000 (45.8% less than national median)
- Houses for sale in February 2019: 2,727 (-40.8% change between 2019-2021)
- Houses for sale in February 2020: 2,222 (-27.4% change between 2020-2021)
- Houses for sale in February 2021: 1,614

Home sales in Dayton were 10% higher at the start of 2021 than they were a year earlier, and the median sale price was up about 14%. Local experts predict the market will continue to fly high as more would-be sellers and buyers get vaccinated against COVID-19 and grow more optimistic about their moving options.

16 / 20
Sean Pavone // Shutterstock

#5. Salt Lake City, Utah

- Average days homes are listed before a pending sale (December 2020): 19
- Median sale price of homes in February 2021: $389,800 (39.1% greater than national median)
- Houses for sale in February 2019: 3,938 (-50.6% change between 2019-2021)
- Houses for sale in February 2020: 3,208 (-39.3% change between 2020-2021)
- Houses for sale in February 2021: 1,947

Homebuyers moving to Salt Lake City cite its affordable housing prices, job opportunities, low unemployment, and outdoor activities. Among those heading to the area are former California residents seeking relief from high costs. The appreciation rate of properties in Salt Lake City is among the highest in the nation.

17 / 20
Terrance Emerson // Shutterstock

#4. Stockton, California

- Average days homes are listed before a pending sale (December 2020): 18
- Median sale price of homes in February 2021: $431,667 (50.7% greater than national median)
- Houses for sale in February 2019: 1,616 (-44.1% change between 2019-2021)
- Houses for sale in February 2020: 1,553 (-41.9% change between 2020-2021)
- Houses for sale in February 2021: 903

A significant portion of the demand for housing in the Stockton area comes from Californians seeking an escape from the expensive Bay Area. Those transplants, many of whom have been freed to move by remote working arrangements, tend to seek a lower cost of living and less crowded neighborhoods. Local experts call locales like Stockton “spillover markets” from high-priced places like San Francisco and San Jose.

18 / 20
Jacob Boomsma // Shutterstock

#3. Provo, Utah

- Average days homes are listed before a pending sale (December 2020): 18
- Median sale price of homes in February 2021: $380,417 (35.6% greater than national median)
- Houses for sale in February 2019: 3,190 (-58.5% change between 2019-2021)
- Houses for sale in February 2020: 3,034 (-56.4% change between 2020-2021)
- Houses for sale in February 2021: 1,324

Housing inventory is tight in Provo and elsewhere in Utah, where quality of life and work opportunities attract buyers. One factor keeping inventory low is existing homebuyers who cannot afford to buy bigger properties in such a dynamic seller’s market. Out-of-state buyers in particular are driving up housing demand.

19 / 20
CSNafzger // Shutterstock

#2. Boise City, Idaho

- Average days homes are listed before a pending sale (December 2020): 16
- Median sale price of homes in February 2021: $383,157 (39.9% greater than national median)
- Houses for sale in February 2019: 3,462 (-50.3% change between 2019-2021)
- Houses for sale in February 2020: 3,478 (-50.5% change between 2020-2021)
- Houses for sale in February 2021: 1,721

Boise City, as well as the rest of Idaho, is attracting homebuyers drawn by a cost of living that is lower than neighboring states. In 2018, more than a quarter of the people who moved to Idaho came from California. Home sellers in Boise have been getting more than 104% of their asking price this year, after getting 98.5% of their asking price in 2020. In dollar terms, they are getting an average of almost $20,000 over their list price, after getting about $7,600 less on average than their list price last year.

20 / 20
Guy In Utah // Shutterstock

#1. Ogden, Utah

- Average days homes are listed before a pending sale (December 2020): 16
- Median sale price of homes in February 2021: $341,767 (19.1% greater than national median)
- Houses for sale in February 2019: 2,123 (-47.9% change between 2019-2021)
- Houses for sale in February 2020: 1,989 (-44.3% change between 2020-2021)
- Houses for sale in February 2021: 1,107

In historic Ogden, the state’s first settlement about 35 miles north of Salt Lake City, the value of a middle-tier home soared more than 20% from 2020 to 2021. The drop in inventory has been dramatic, going from about 1,850 available homes for sale in September 2019 to a mere 540 homes a year later. The city is known for outdoor recreation including its proximity to wilderness areas, hiking and biking trails, and top ski resorts.

Trending Now