Here's how much home prices have risen since 1950
This story originally appeared on Better and was produced and distributed in partnership with Stacker Studio.
Here's how much home prices have risen since 1950
The rise and fall of home prices can be traced historically to many factors. Some of these include mortgage rates, inflation, historical events like economic recessions, and state-to-state or city-to-city migration rates, to name but a few. The decades between the 1950s to the 2020s saw significant home price fluctuations—especially the period between the post-war 1950s to the late 1980s, which saw a steady rise in home prices, minus a few bumps along the road. The recession in the early 1990s produced a minor real estate market bubble that burst, ultimately bringing a nominal dip in home prices.
Significant price drops in the housing market didn't really materialize until the 2008 Great Recession and real estate crash. The real estate housing market hadn't experienced something like that since the 1930s, and though solid numbers for home prices weren't tracked back then, home production rates dropped by 90%, proving trends were on a downward trajectory in the U.S. home market. As with any financial market, price fluctuations are expected. Overall, while sensitive to other external market forces, the home real estate market has proven to be relatively robust.
Better, an online mortgage lender with a free mortgage calculator, looked into historical Census and HUD data. The data collected analyzed median home values in America for the first year of every decade since 1950 and the percent growth of the first year of each decade's home value since 1950.
Prices are shown in both 2020 adjusted and unadjusted dollar amounts. The analysis from 1980 and onward also includes the average interest rate for a 30-year fixed-rate mortgage, using data from Freddie Mac.
1950
- Median home value (unadjusted): $7,354
- Median home value (inflation-adjusted to 2020 dollars): $79,063
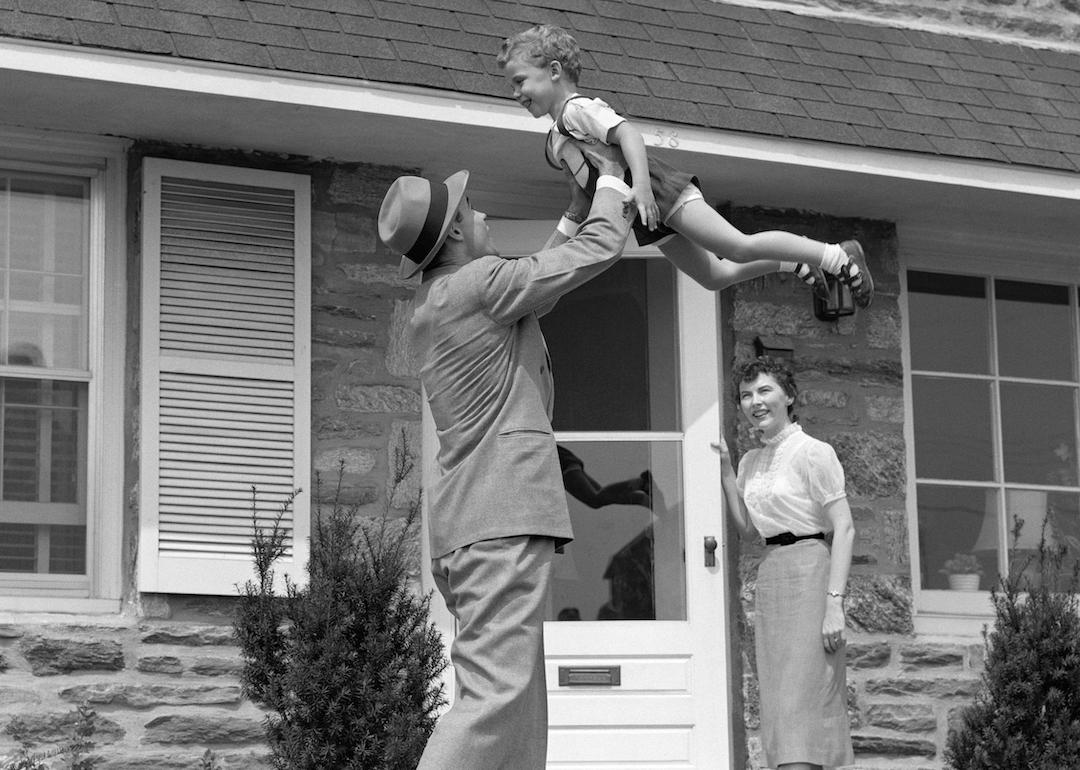
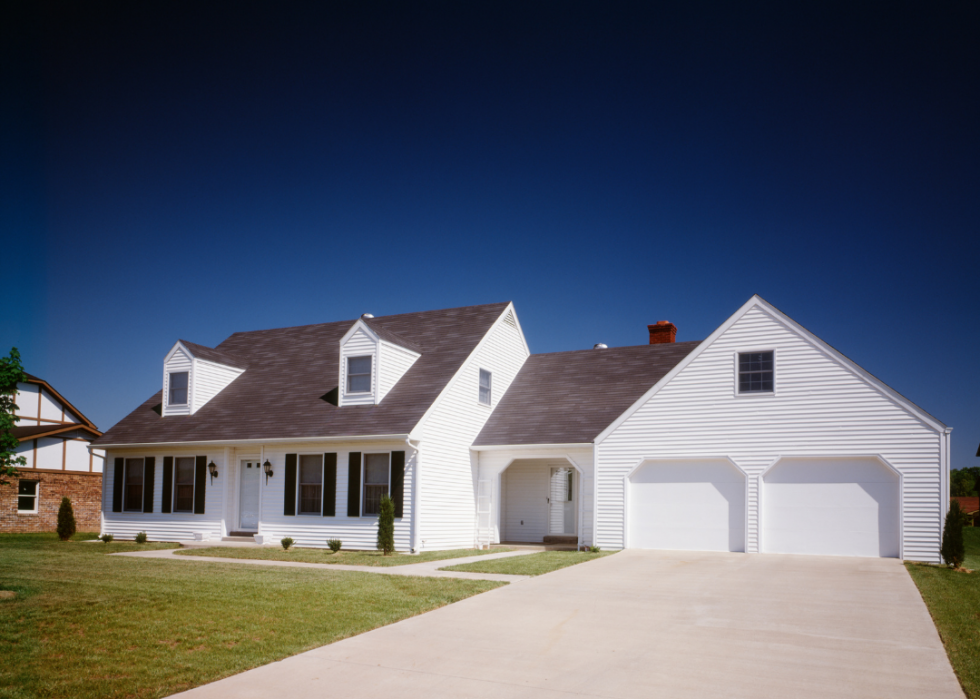
At the start of the 1940s, homeownership sunk to a new century low of 43.6% while the median U.S. home value was just $2,938,, or $30,600 in today's dollars. With World War II raging overseas, home ownership was low on the priority list both on Main Street and Pennsylvania Avenue. This was no surprise given the 90% drop in production of new homes just a decade before the start of the Great Depression. The robust real estate market of the 1950s fell into place with high demand for homes, the shortage that demand created, the surging economy, and the migration to the suburbs.
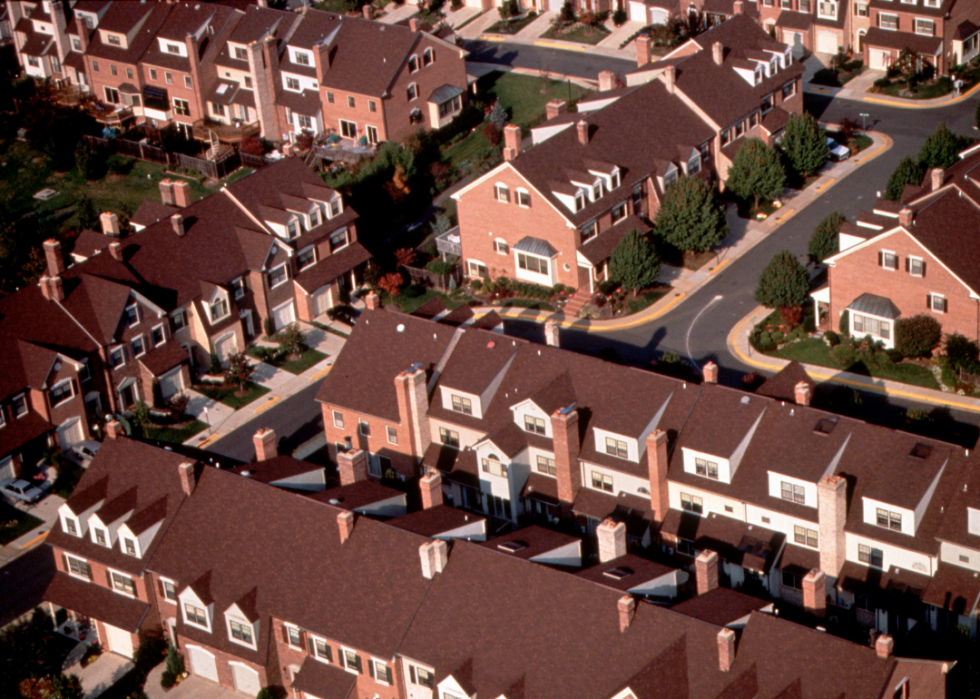
Amid the boom of post-war purchasing, U.S. President Dwight D. Eisenhower passed the Federal Aid Highway Act of 1956, connecting the country like never before. This paved the way for suburban sprawl, altering the real estate market and opening new possibilities for places to live—especially as many Americans were starting families. Families purchased cars in record numbers, and federally sponsored highways drove people out of cities and into the suburbs where post-war subdivisions like Levittown popped up.
At the end of the war, the return of 15 million GIs was just the thing to rev up the long-suffering real estate market. Government-backed loans helped 2.4 million war veterans to purchase homes by 1952. While this contributed to major home buying and economic mobility for many white veterans of World War II, this was not the case for many Black veterans. Black families were still feeling the ramifications of redlining districts—a practice of banks refusing to grant mortgages to people because of their race or what neighborhood they lived in—that began in the 1930s and would not be deemed illegal until 1968.
1960
- Median home price (unadjusted): $11,900
- Median home price (inflation-adjusted to 2020 dollars): $104,166
- Price growth since 1950: 31.7%
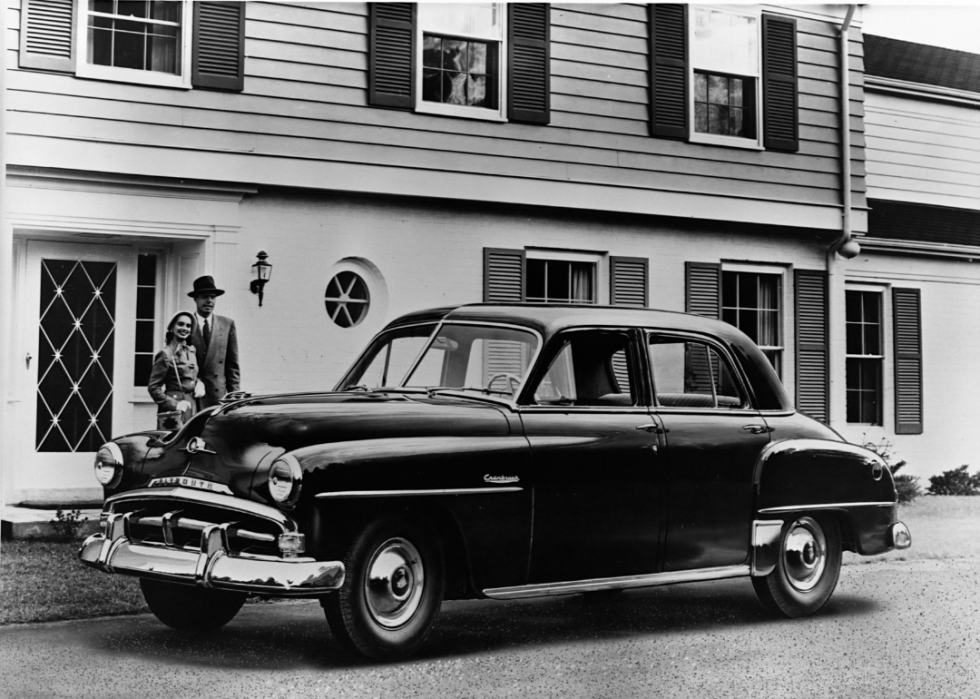
The homeownership boom continued into the 1960s, as did general prosperity in the United States. Many factors contributed to the rise in homeownership and home price increases, including a healthy price-to-income ratio, which is how much income the price of a house should cost (according to City Lab, that number is now 2.6 years of income). In the 1960s, the price-to-income ratio was 2, which meant that purchasing a house required two years of household income. The average household income had also risen to $5,400 by the end of the 1950s, up 80% from 1947.
Another contributing factor to rising homeownership and home prices were changes in mortgage financing led by the Federal Housing Administration (FHA), which like the popular GI Bill in the years following War War II, allowed many Americans to affordably buy homes. Homeownership edged up past 60% in 1960. Mortgage rates also remained low. In 1960, FHA mortgages were 4.6%, VA-backed mortgages were 4.5%, and the average mortgage rate was 5.1%.
The economy was also flourishing in the 1960s with factors such as intense workforce growth and government assistance to remedy poverty through Food Stamps and Medicare. The Fair Housing Act of 1968 also became law during this decade, making redlining illegal and (in theory) opening up a fairer housing market to people of color. While The Fair Housing Act of 1968 provided legislative strides, Black homeownership rates are not any higher today.
1970
- Median home price (unadjusted): $17,000
- Median home price (inflation-adjusted to 2020 dollars): $112,941
- Price growth since 1950: 42.8%
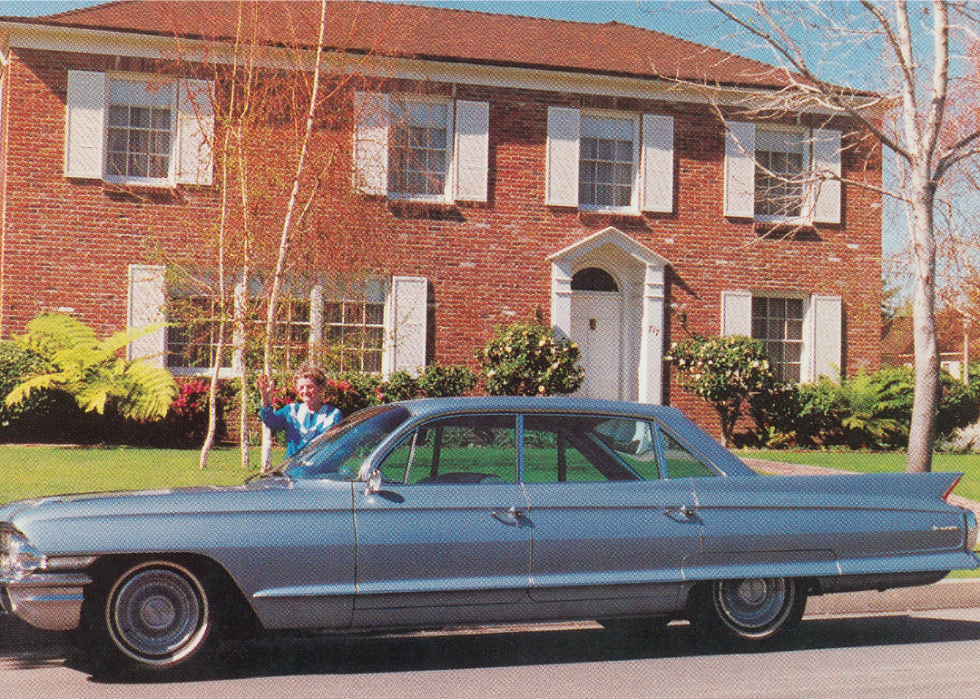
Median home values rose fastest (43%) in the 1970s from the time the Census started tracking values in the 1940s through the year 2000. The decade saw oil shocks, which caused gas prices to skyrocket and meat prices to go through the roof. Overspending on the Vietnam War also hurt the U.S. economy, as did the 1973-74 stock market crash. All these factors led to inflation, which rose during the decade to some of the highest rates in U.S. history. The streak of a strong economy during the prior two decades had finally ended.
Along with inflation and rates, home prices also increased. While the recession of 1973-75 may not have dampened home prices, it did impact the housing market. According to the Joint Center for Housing Studies of Harvard University, home sales and housing starts fell leading up to the recession in the early 1970s and aided economic recovery in the period that followed the recession. One Harvard study found that baby boomers entering the housing market in the 1970s was a major cause for the real housing price increase.
1980
- Median home price (unadjusted): $47,200
- Median home price (inflation-adjusted to 2020 dollars): $147,879
- Price growth since 1950: 87.0%
- Average interest rate for 30-year fixed-rate mortgage: 13.7%
Back-to-back recessions rocked the early 1980s and left close to 4 million people without jobs. President Ronald Raegan's tax cuts to the wealthy in 1982 and 1986-87 also contributed to a widening wealth gap in the country, making it more difficult for average Americans to purchase homes. The recessions in the 1980s also impacted Black Americans the hardest as they had unemployment rates as much as 2.77 times that of white unemployment. The manufacturing sector—which disproportionately employed Black Americans—shrank the most during the '80s.
Normally, such high unemployment rates would negatively impact housing prices, though this was not the case during the earliest years of the decade. Inflation also continued to rise, which caused home mortgage interest rates to skyrocket. Double-digit inflation caused double-digit mortgage interest rates. According to Freddie Mac data, in 1981, the annual average mortgage interest rate was 16.63%, the highest in recorded history. On "Black Monday," Oct. 19, 1987, the stock market dropped 22.61%. The impact was felt globally though the damage to the real estate market was regional, with New York City commercial real estate feeling the impact, albeit temporarily.
1990
- Median home price (unadjusted): $79,100
- Median home price (inflation-adjusted to 2020 dollars): $157,169
- Price growth since 1950: 98.8%
- Average interest rate for 30-year fixed-rate mortgage: 10.1%
After rising steadily throughout the 1980s, home prices for the decade peaked in 1989 with an average sale price of $151,200. When the recession hit in 1990, the housing bubble burst, and nominal home prices slipped 0.9%. While the recession ended in the spring of the following year, real U.S. home prices actually continued to fall and were down from the 1989 peak in certain sections of the country.
The 1990 housing bubble burst only impacted a few major cities like New York, Boston, Los Angeles, San Diego, Washington D.C., and San Francisco. Many of these cities didn't return to their peaks until nearly a decade later. A 2009 report by the Federal Housing Finance Agency found that New England was particularly hard hit, and by 1997, housing prices lost more than 32% of their value from the peak in 1988.
2000
- Median home price (unadjusted): $119,600
- Median home price (inflation-adjusted to 2020 dollars): $179,331
- Price growth since 1950: 126.8%
- Average interest rate for 30-year fixed-rate mortgage: 8.1%
While the areas of the residential real estate market that had taken a hit during 1990 (mainly major U.S. cities and certain parts of the country, like New England) had recovered by 2000, another major blow would upset home prices later in the decade. A home building boom and shoddy lending practices damaged the housing market and led to a slowdown by 2007 and the collapse of the subprime mortgage industry. This was followed by rising mortgage rates and record foreclosures. On Dec. 26, 2007, The New York Times reported that home prices had fallen for the 10th straight month and noted that based on economist Robert Shiller's calculations, "the decline in home prices is greater than at any time since 1941 when the housing market was faltering at the start of World War II."
The U.S. housing bubble burst in 2008, and the United States and many other countries around the globe were thrown into a recession. More than 10 million Americans lost their homes and 9 million lost their jobs during the Great Recession, and 46.5 million Americans would be living in poverty by 2012. Black Americans were also significantly impacted by the Great Recession, with median net worths of Black households falling by 53% between 2005 and 2009. White households only saw a dip of 17%.
2010
- Median home price (unadjusted): $221,800
- Median home price (inflation-adjusted to 2020 dollars): $263,604
- Price growth since 1950: 233.4%
- Average interest rate for 30-year fixed-rate mortgage: 4.7%
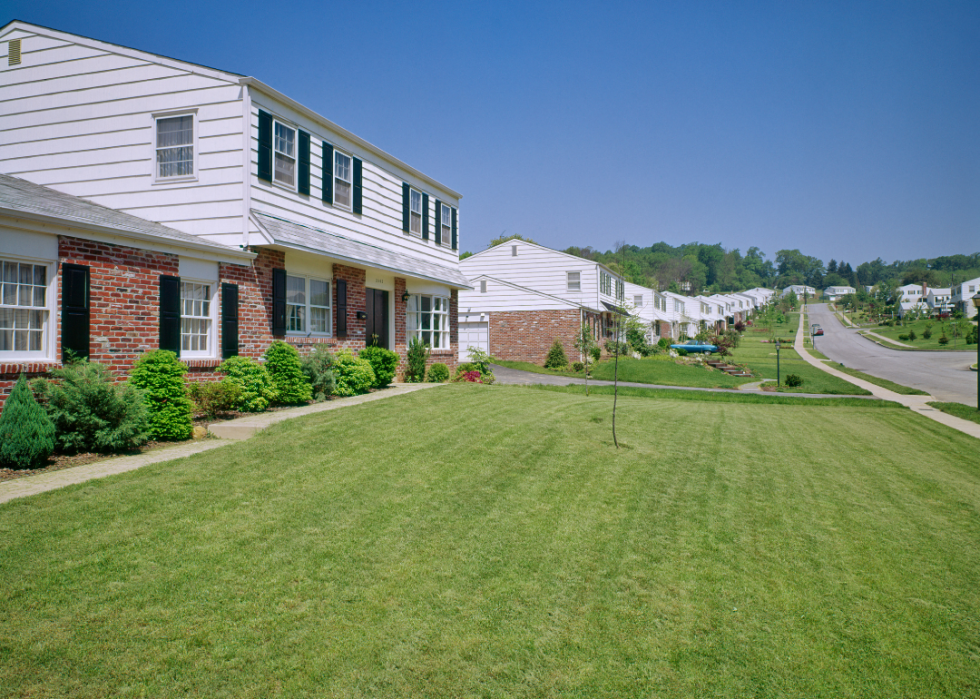
The 2010s were a time of transformation and growth for the real estate industry. The decade is wedged between a market low with the 2008 real estate crash and a market high with the unexpected home price increases during the COVID-19 pandemic.
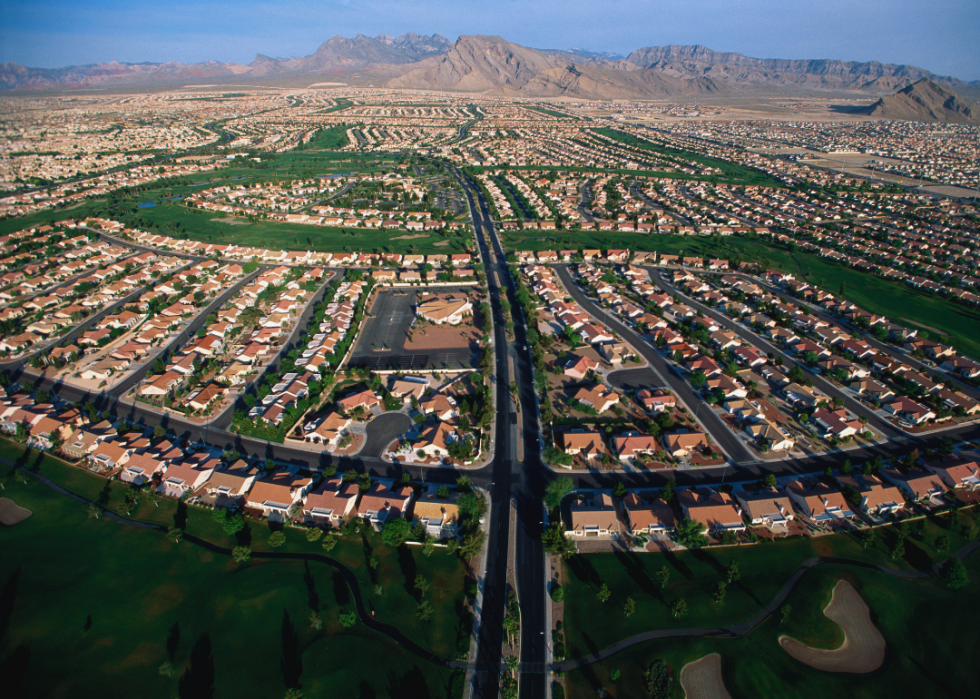
According to Federal Reserve Economic Data (FRED), the average sale price of homes sold in the U.S. during the first quarter of 2010 was $275,300. That number rose to $384,600 during the fourth and final quarter of 2019—an over $100,000 jump within 10 years. During this decade, large urban centers across all price ranges shot past national price gains. According to PropertyShark, Sunbelt cities like Phoenix and Mesa, Arizona, also saw significant home price increases in the 2010s.
As home prices increased, so did the need for mortgages. People of color saw some of the highest denial rates for mortgages in the early 2010s, with Black Americans peaking at 40% and Hispanic Americans at more than 25%. By 2015, those percentages dropped to 27.4% and 19.2% for Black and Hispanic Americans, respectively. White Americans at most saw denial rates above 15% in the early 2010s, down to about 11% in 2015.
2020
- Median home price (unadjusted): $336,900
- Median home price (inflation-adjusted to 2020 dollars): $336,900
- Price growth since 1950: 326.1%
- Average interest rate for 30-year fixed-rate mortgage: 3.1%
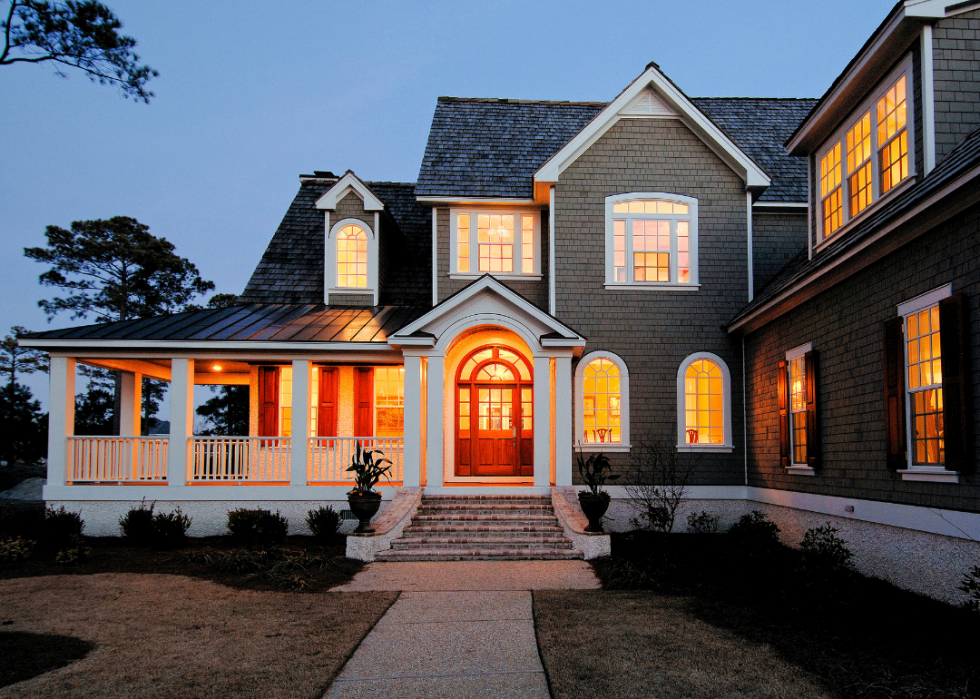
The year 2020 was a record-setting year in housing prices, with the median cost of a home sold in August 2020 reaching $310,600, an all-time high. It was also a banner year for sales in general, with an inventory shortage and record low mortgage rates keeping the market strong. Home prices skyrocketed due to several contributing factors, including millennials coming into their peak buying years and the COVID-19 pandemic creating a boom in remote/work-from-home opportunities, which has allowed many people to move virtually anywhere.
While many major cities have seen a price drop and a lower demand for homes, suburban and rural areas have seen the opposite. This may be due to homeowners' desire to find safer areas with lower infection rates and homes that offer more space both indoors and out. In 2020, the Freddie Mac House Price Index (FMHPI) showed a home price increase of 11.3% in the U.S. Heading into fall 2021, median listing prices are dropping. Experts predict housing prices will level off and slow, and that mortgage rates will rise.


