How the American wealth gap has increased
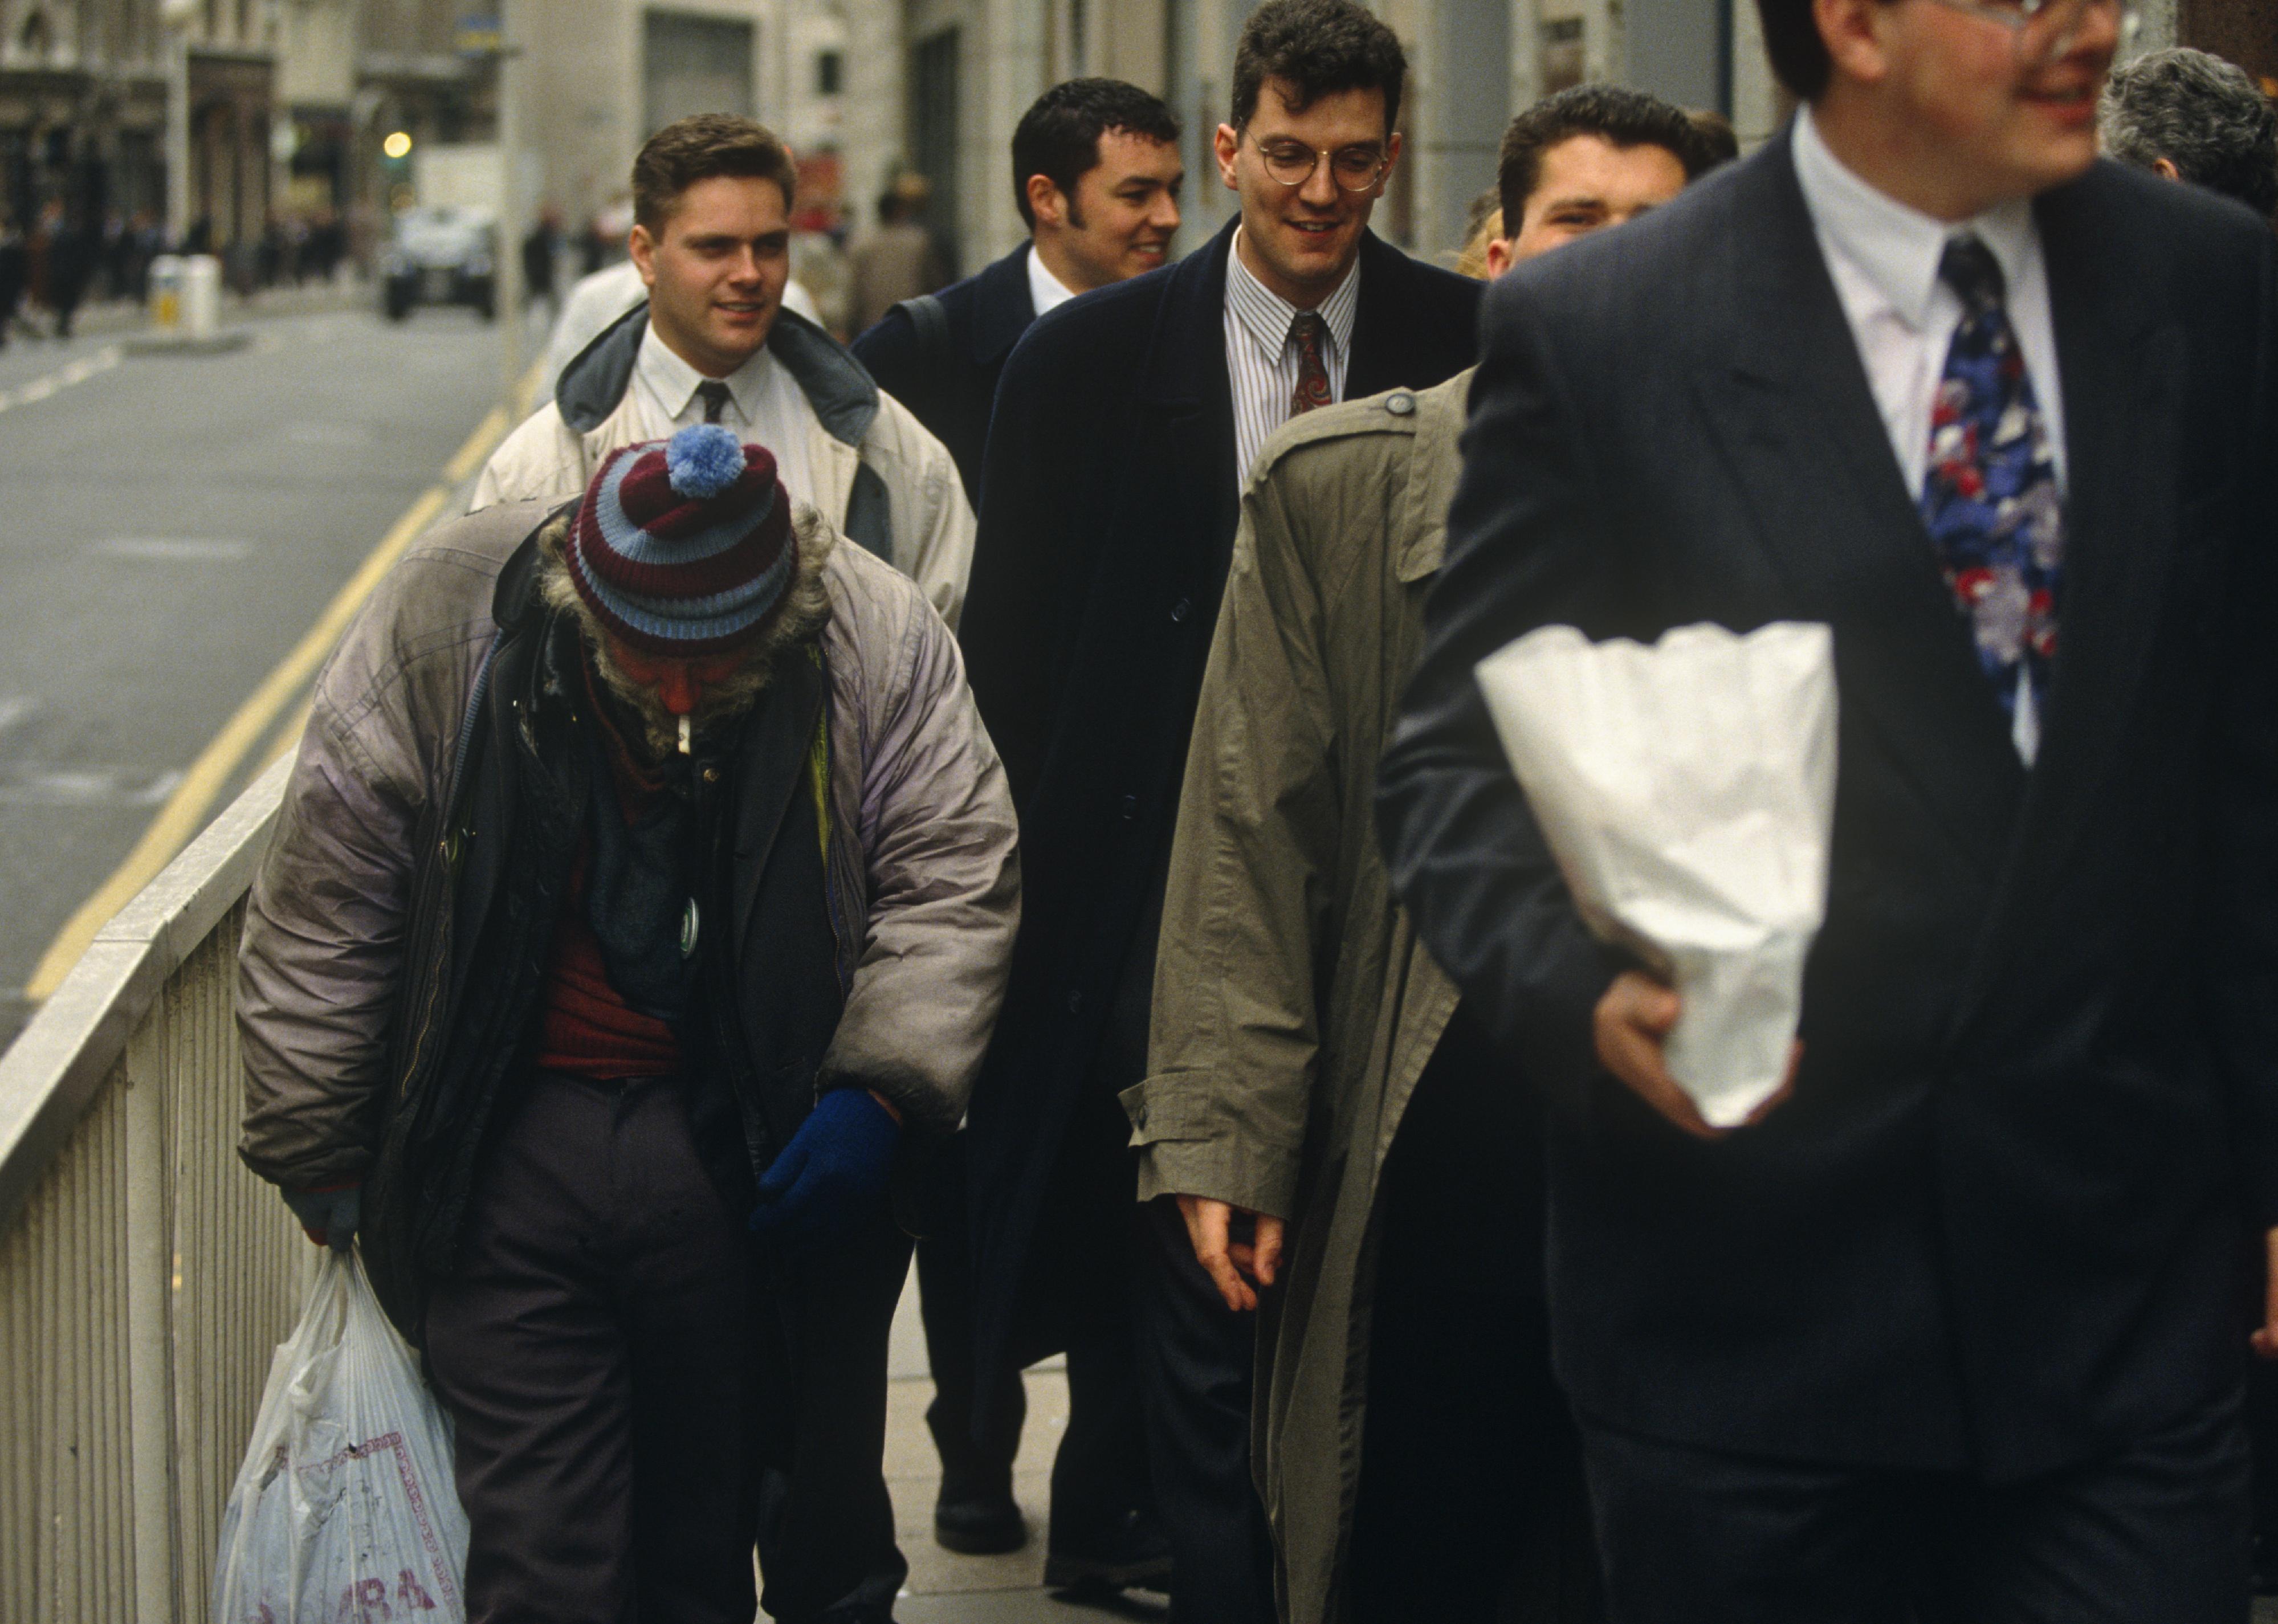
America's wealth gap is at historic levels, nearing the inequality that marked the exuberant years of the Jazz Age, when the country's riches were concentrated in the hands of the very top echelon.
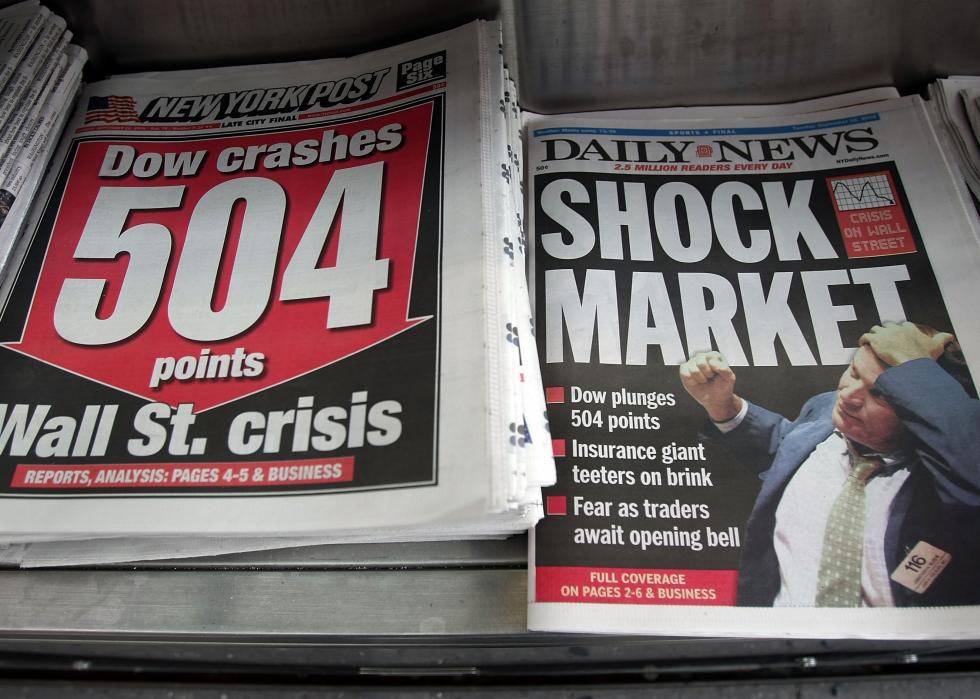
During the Roaring Twenties, the most affluent Americans held close to a quarter of total household wealth, a number that tumbled during the Great Depression along with the stock market. But the concentration of fortune among the most prosperous has been on the rise since the 1980s, with some economists worrying that a stock market bubble will again burst with severe economic consequences.
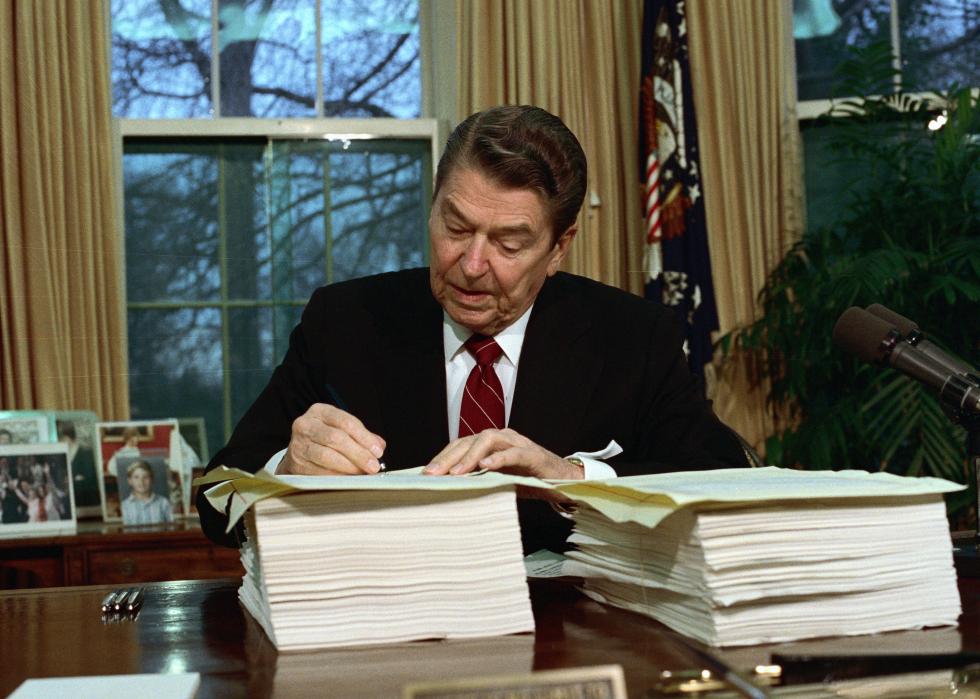
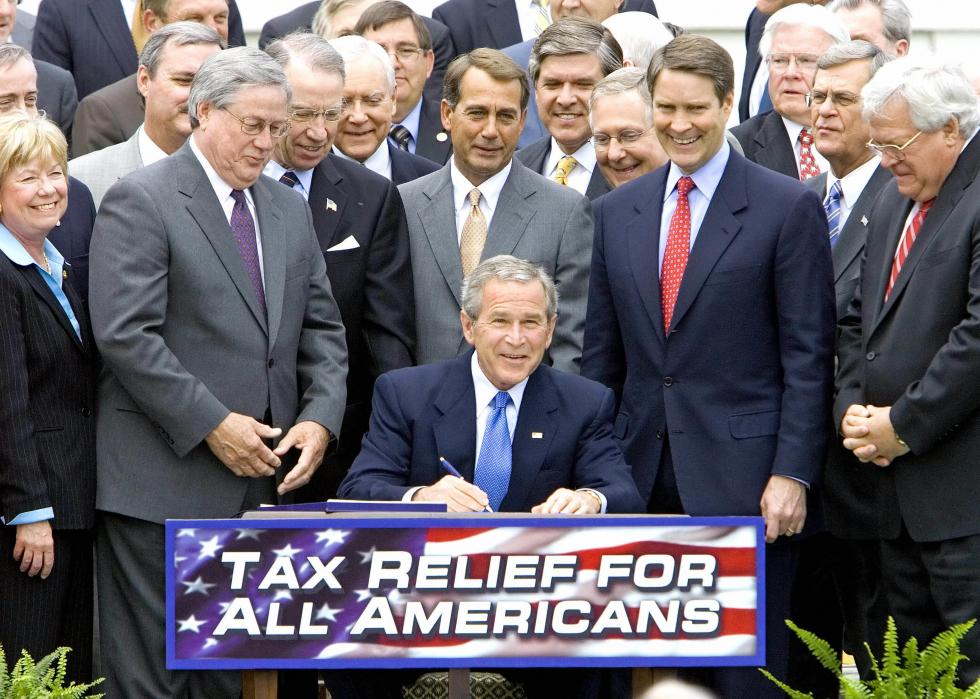
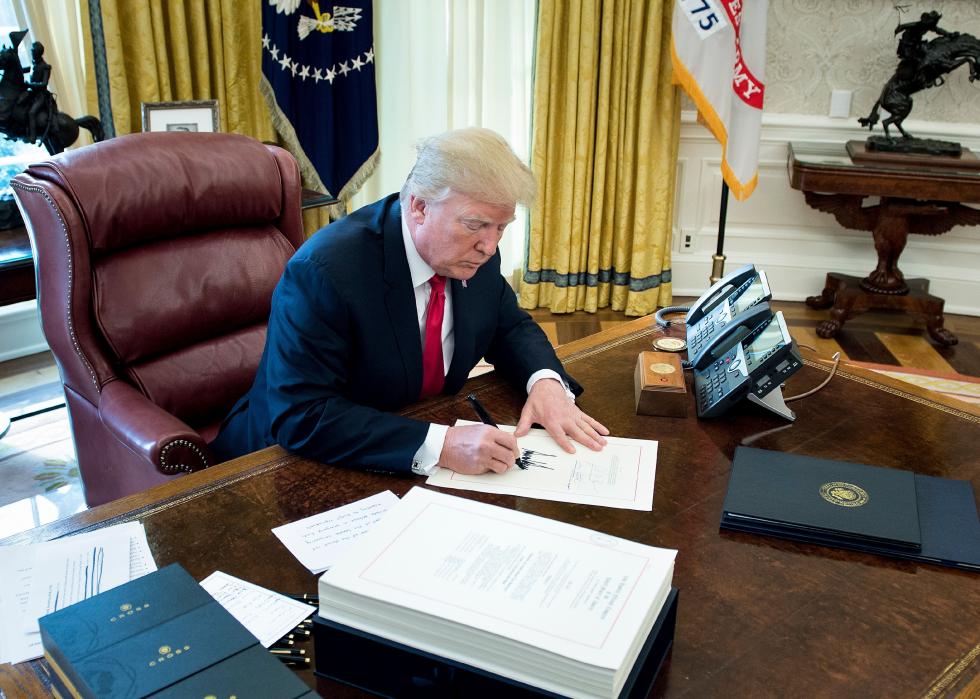
A slew of factors contribute to the country's income inequality. Among those cited, and often disputed, are tax cuts for the wealthy, assistance to the poor, a decline in the influence of unions, globalization, technological advances, and the minimum wage's shrinking value. Liberals argue that the notion that tax cuts will spur business growth has failed repeatedly. Conservatives are less likely to say that the wealth gap is unfair, though they do donate to charities and otherwise help the poor at an individual level instead of addressing the problem systematically.
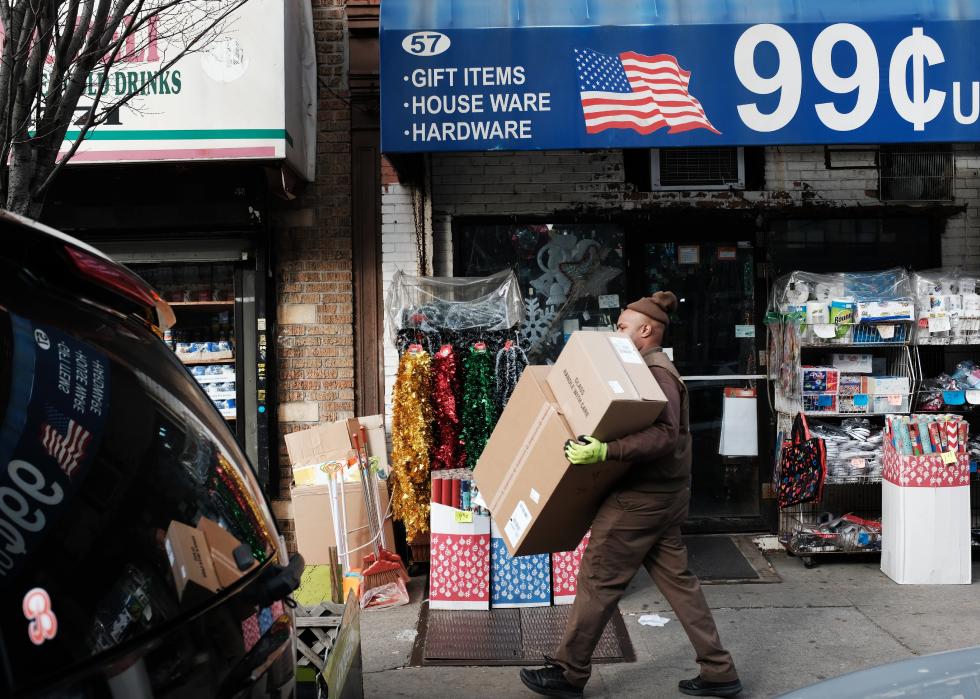
Globally, America is one of the world's richest countries but also one of the most unequal. Among developed countries in 2017, it ranked 23 out of 30 in a measure focused on income, health, poverty and sustainability. Here is a look at some significant milestones in the country's march toward that inequality. Stacker searched news reports, academic studies, and international assessments to compile this list of important moments in American history.