Ranking the worst commutes in Chicago
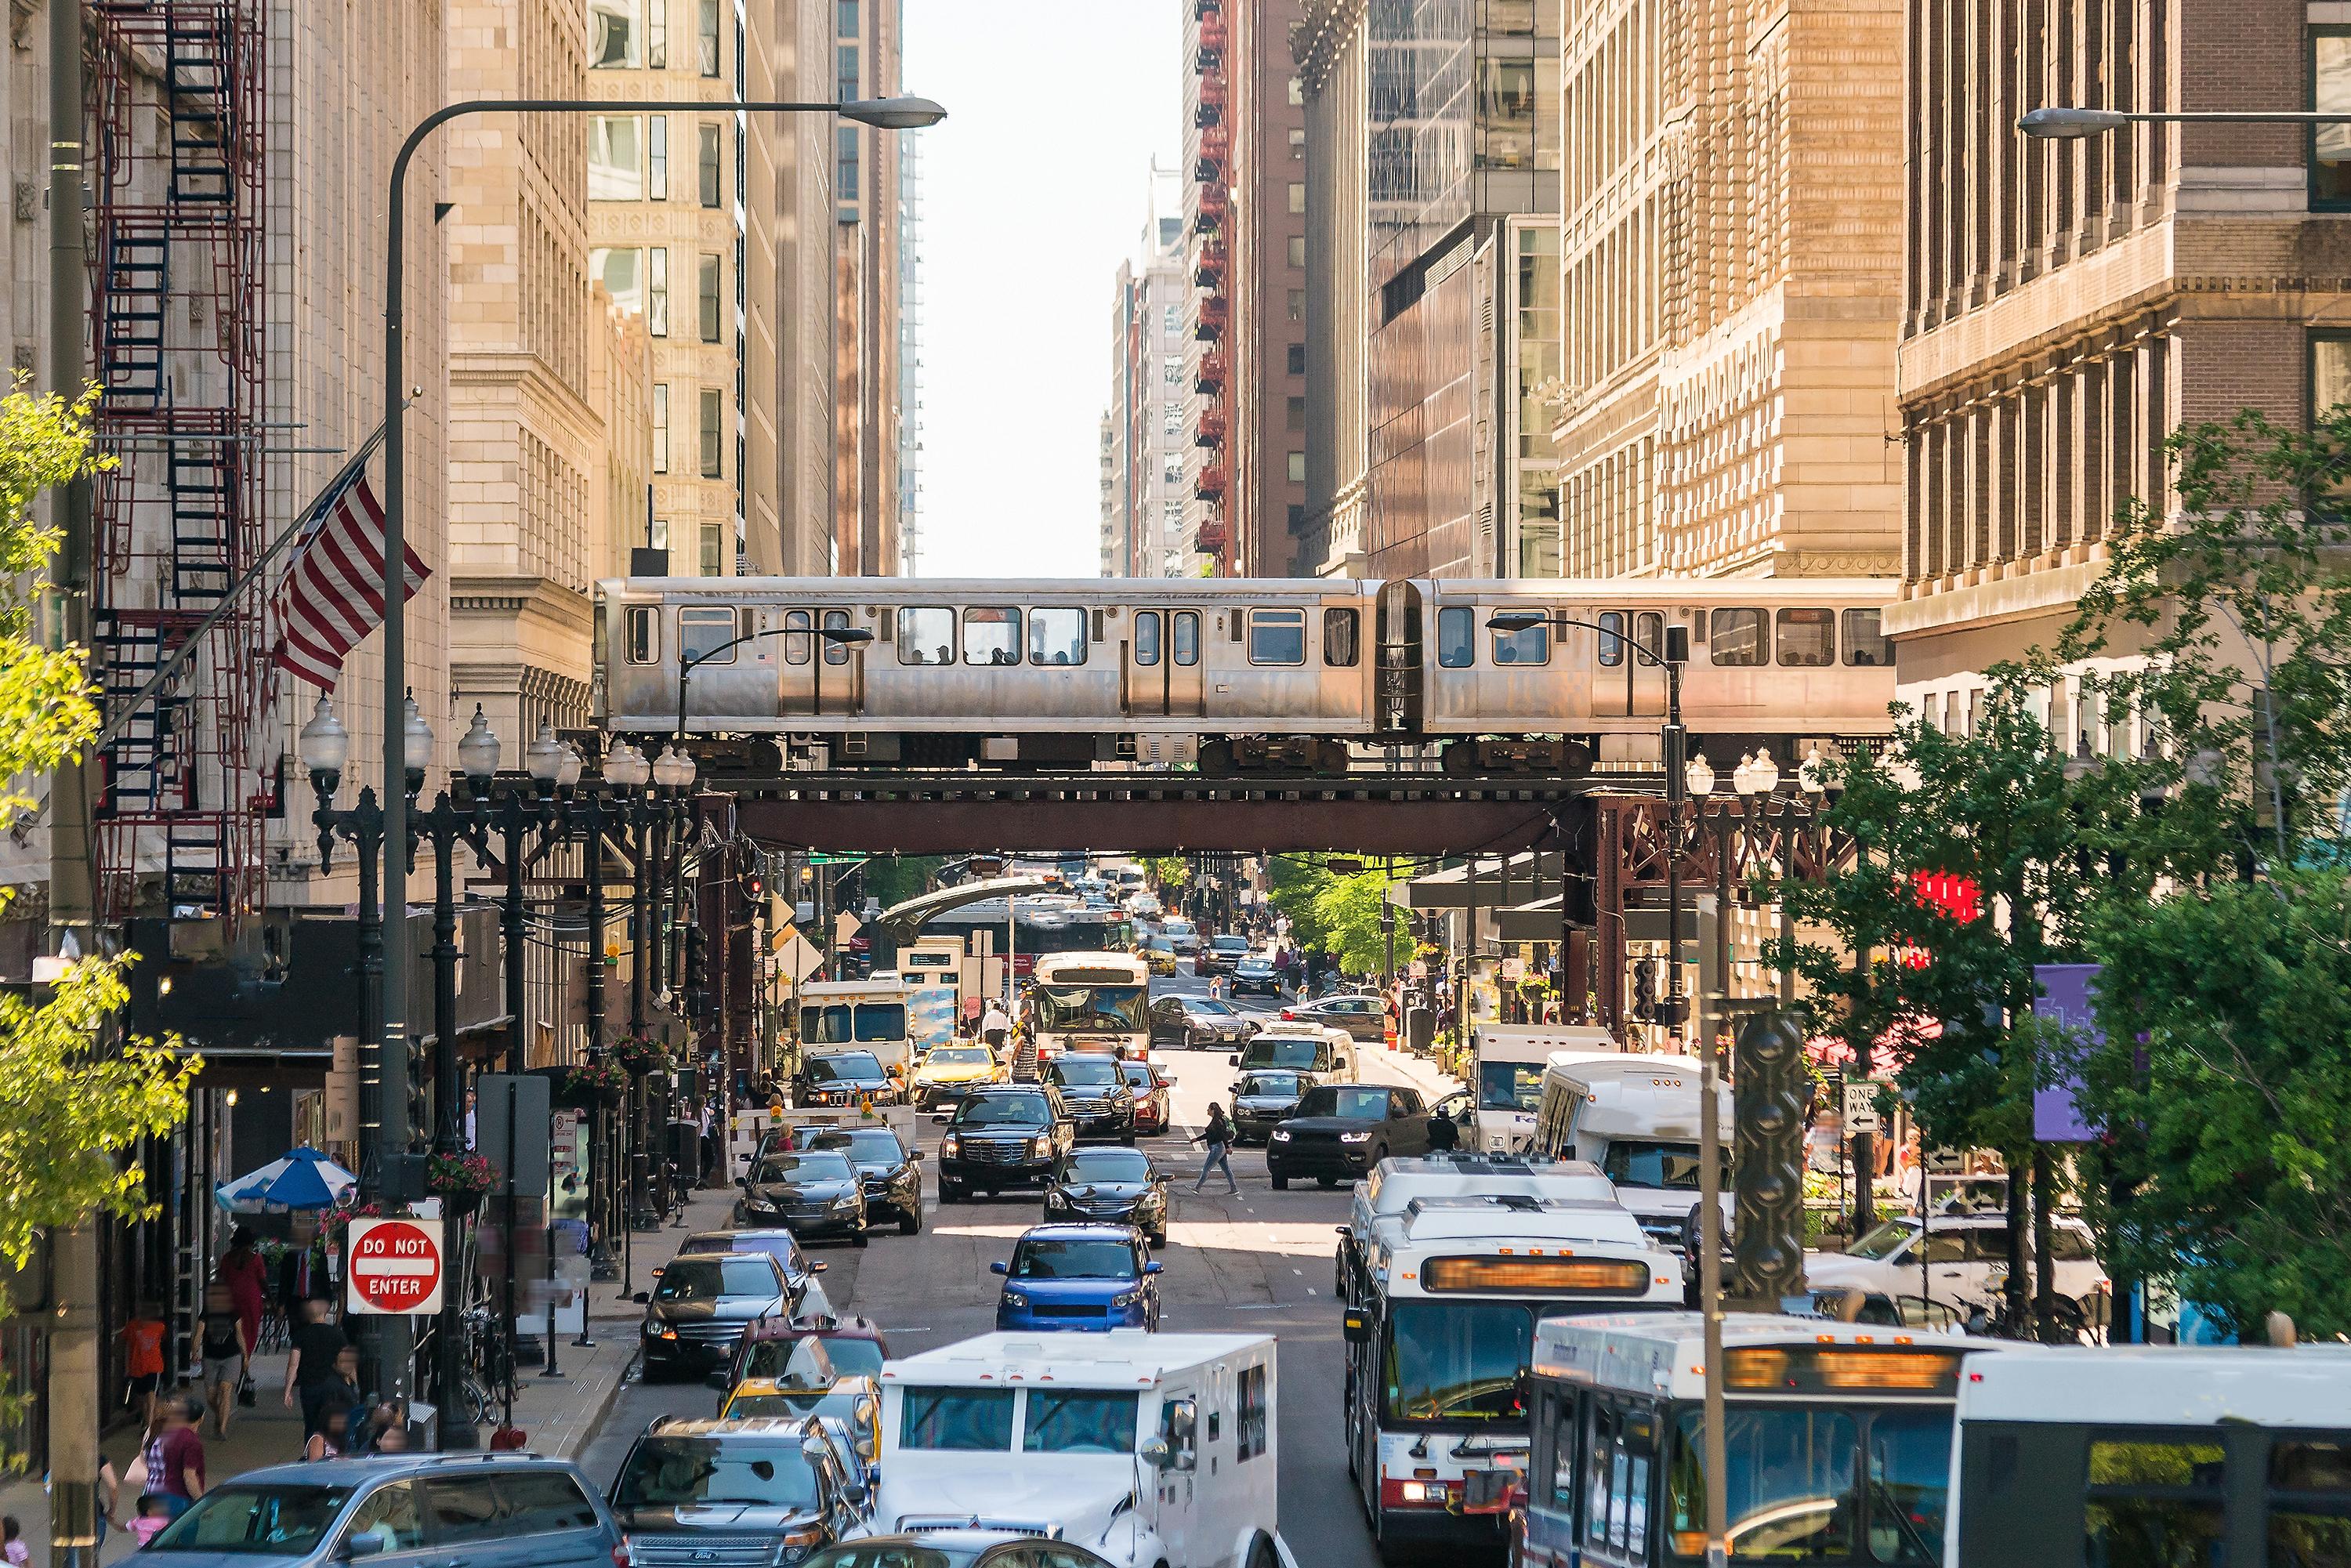
Chicago commuters have some of the longest treks in the country, with an average one-way travel time to work of 34.4 minutes, or 31% above the national average of 26.1 minutes. For the typical Chicago commuter, this amounts to nearly 12 days of travel time per year across 50 weeks of work. For the venerated "mega-commuters," those with one-way treks of over 90-minutes, annual time spent journeying to work leaps to over 31 days.
For all the transportation challenges throughout the city, the question emerges: which areas have it worst?
Using data from the recently released 2016 American Community Survey, Stacker analyzed how daily commutes compare across the Chicago area. This analysis focused on the city's 23 Public Use Microdata Areas (PUMAs), statistical geographic areas with populations of over 100,000. Each area was ranked by median one-way commute time; in addition insights into the percentage of commuters with more than 60- and 90-minute journeys have been included.
The list begins in the Loop and ends with the worst commute in Chicago, where over 28% of commuters travel more than an hour and a hallowed 8% make mega-commutes.
Read on to see where your area ranks among the longest journeys to work.
You may also like: Worst commutes in Illinois
#17: Central — near North Side, Loop, and near South Side
- Population: 145,782 (89,793 commuters)
- Median commute time: 20 to 24 min.
- Over 60-min. commute: 9.2% of all commuters
- Over 90-min. commute: 3.2% of all commuters
#16: West — West Town, near West Side and lower West Side
- Population: 173,195 (97,843 commuters)
- Median commute time: 25 to 29 min.
- Over 60-min. commute: 7.9% of all commuters
- Over 90-min. commute: 2.2% of all commuters
#15: North — Lake View and Lincoln Park
- Population: 160,866 (103,404 commuters)
- Median commute time: 30 to 34 min.
- Over 60-min. commute: 9.8% of all commuters
- Over 90-min. commute: 2.5% of all commuters
#14: Southwest — Brighton Park, New City, Bridgeport, and McKinley Park
- Population: 162,347 (70,344 commuters)
- Median commute time: 30 to 34 min.
- Over 60-min. commute: 12.6% of all commuters
- Over 90-min. commute: 3.3% of all commuters
#13: Northwest — Logan Square, Avondale, and Hermosa
- Population: 136,220 (74,254 commuters)
- Median commute time: 30 to 34 min.
- Over 60-min. commute: 13.5% of all commuters
- Over 90-min. commute: 2.5% of all commuters
#12: Southwest — Gage Park, Garfield Ridge, and West Lawn
- Population: 158,146 (65,310 commuters)
- Median commute time: 30 to 34 min.
- Over 60-min. commute: 16.8% of all commuters
- Over 90-min. commute: 3.9% of all commuters
#11: Northwest — Portage Park, Dunning, and Jefferson Park
- Population: 125,270 (65,724 commuters)
- Median commute time: 30 to 34 min.
- Over 60-min. commute: 16.8% of all commuters
- Over 90-min. commute: 3% of all commuters
#10: South — Ashburn, Washington Heights, Morgan Park, and Beverly
- Population: 136,370 (60,970 commuters)
- Median commute time: 30 to 34 min.
- Over 60-min. commute: 17.8% of all commuters
- Over 90-min. commute: 4.1% of all commuters
#9: West — North and South Lawndale, Humboldt Park, East, and West Garfield Park
- Population: 209,402 (75,150 commuters)
- Median commute time: 30 to 34 min.
- Over 60-min. commute: 20% of all commuters
- Over 90-min. commute: 4.5% of all commuters
#8: South — South Shore, Hyde Park, Woodlawn, Grand Boulevard, and Douglas
- Population: 179,090 (71,003 commuters)
- Median commute time: 30 to 34 min.
- Over 60-min. commute: 19.7% of all commuters
- Over 90-min. commute: 6% of all commuters
#7: West — Austin, Belmont Cragin, and Montclare
- Population: 180,744 (76,222 commuters)
- Median commute time: 30 to 34 min.
- Over 60-min. commute: 21.8% of all commuters
- Over 90-min. commute: 4.6% of all commuters
#6: South — Chicago Lawn, Englewood/West Englewood, and Greater Grand Crossing
- Population: 137,667 (45,528 commuters)
- Median commute time: 30 to 34 min.
- Over 60-min. commute: 23.1% of all commuters
- Over 90-min. commute: 6% of all commuters
#5: North — West Ridge, Lincoln Square, and North Center
- Population: 154,108 (73,756 commuters)
- Median commute time: 35 to 39 min.
- Over 60-min. commute: 14.4% of all commuters
- Over 90-min. commute: 2.5% of all commuters
#4: Northwest — Irving Park, Albany Park, Forest Glen, and North Park
- Population: 147,974 (74,999 commuters)
- Median commute time: 35 to 39 min.
- Over 60-min. commute: 16.6% of all commuters
- Over 90-min. commute: 1.1% of all commuters
#3: South — Auburn Gresham, Roseland, Chatham, Avalon Park, and Burnside
- Population: 129,529 (43,510 commuters)
- Median commute time: 35 to 39 min.
- Over 60-min. commute: 20.4% of all commuters
- Over 90-min. commute: 5.2% of all commuters
#2: North — Edgewater, Uptown, and Rogers Park
- Population: 170,721 (89,953 commuters)
- Median commute time: 40 to 44 min.
- Over 60-min. commute: 17.4% of all commuters
- Over 90-min. commute: 2.6% of all commuters
#1: South — South Chicago, Pullman, West Pullman, East Side, and South Deering
- Population: 131,070 (48,010 commuters)
- Median commute time: 40 to 44 min.
- Over 60-min. commute: 28% of all commuters
- Over 90-min. commute: 8% of all commuters


