How the American commute has changed over the past 50 years
This story originally appeared on Jerry and was produced and distributed in partnership with Stacker Studio.
How the American commute has changed over the past 50 years
With the worldwide semiconductor chip shortage driving up vehicle prices and the approval of the $1 trillion federal Infrastructure Investment and Jobs Act, transportation is top of mind for many Americans.
Access to public transportation is limited in many areas, and American workers rely heavily on personal vehicles to get to work. But the delivery of new vehicles has been delayed by chip shortages and low supply inventories. Consumers have also seen sky-high sticker prices for both new and used vehicles, making buying a car cost-prohibitive for many.
However, commuting in the United States has a history of change and evolution, with the latest disruption coming in the form of the COVID-19 pandemic. As a result, more Americans are reevaluating the idea that they must travel to work every day. Many are opting to work either partially or fully remote—saving on gas, mileage on their vehicles, and time spent on long commutes via public transportation systems.
To determine how commuting has changed and developed in the United States, car insurance comparison shopping app Jerry compiled a list of commuting statistics and compared them to statistics from 50 years ago. The data comes from the U.S. Census Bureau, and various news reports from the 1970s to today.

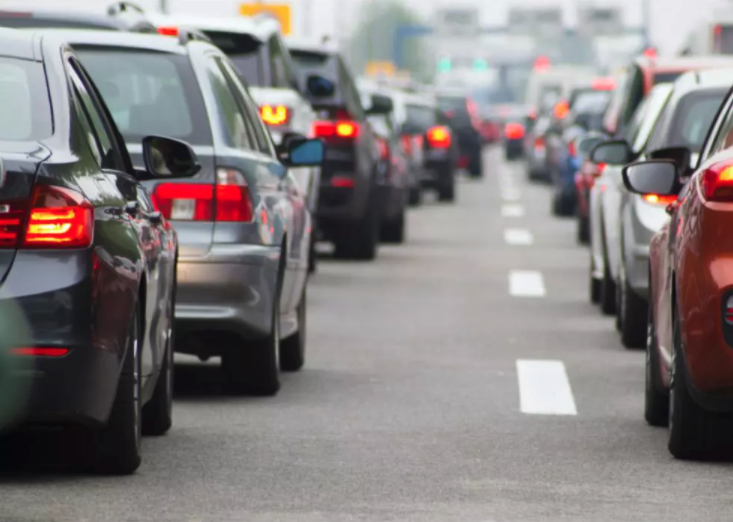
The average one-way commute in America is 28 minutes
American workers are no strangers to long work commutes. According to the U.S. Census Bureau, the average commute time for Americans in 2019 was just under 28 minutes, and that was just one way. In total, Americans spent 55 minutes driving to and from work per day, and even longer if they lived in major metro areas. This was a 10% increase from 2006, or more than 20 additional hours a year. Long commutes can be a frustrating part of working on-site, causing more wear and tear on vehicles, and increasing costs for gas, vehicle maintenance, and tolls. With that kind of time on the road, it’s easy to see why many Americans are eager to switch to working remotely.
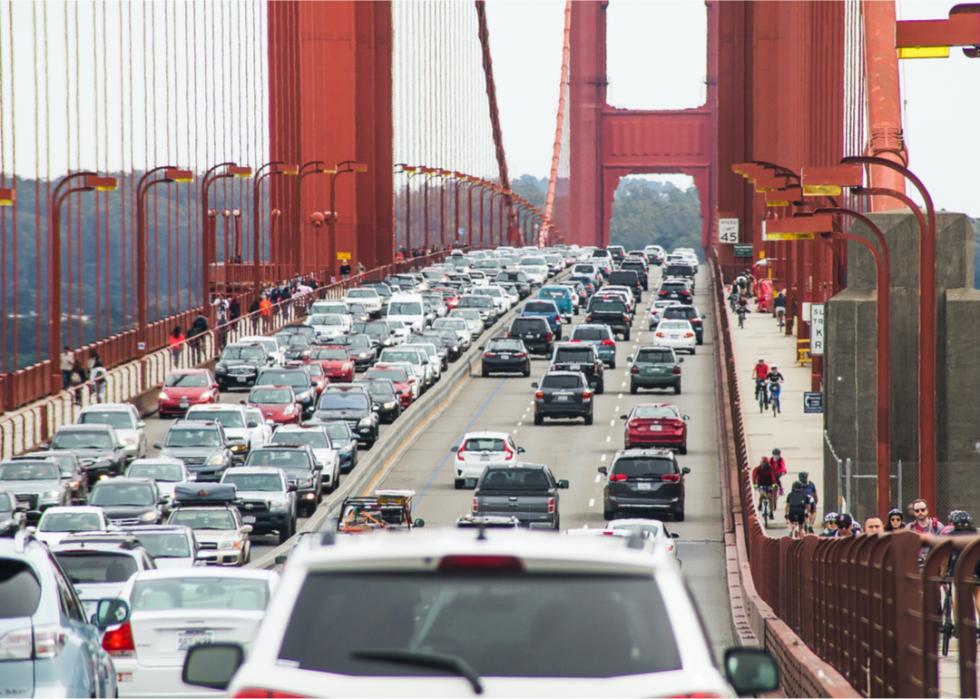
More than 130 million workers drove to work in 2019
The pandemic led to a drastic drop in people commuting to work—a Gallup poll found that in Sept. 2021, 45% of full-time American workers reported that they worked either partially or fully remote. Before the pandemic, more than 130 million people in the United States drove to work—that’s 85% of America’s total workforce according to the Census Bureau. This is more than double the number of workers who drove to their jobs in 1970, which was nearly 60 million people, or about 78% of the workforce. This massive increase in commuters over the past five decades may help explain why commute times increased as well. The more cars there were on the road, the more congestion, greater potential for accidents, and continual decline of road conditions.

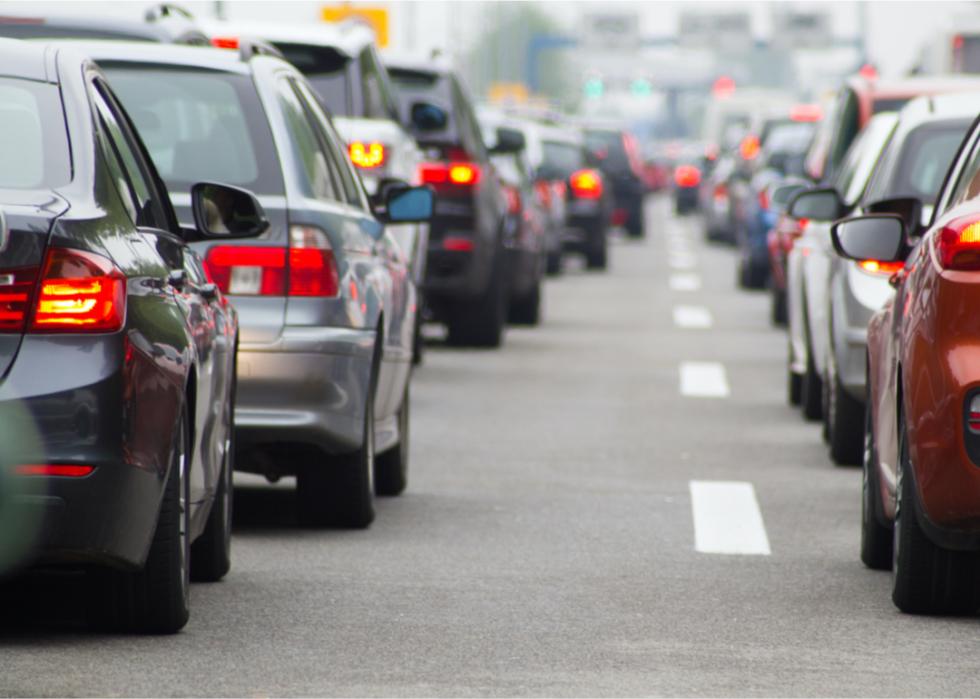
5% of workers take public transportation
In 2019, 5% of the labor force, or nearly 8 million people, used public transportation to get to work. Unfortunately, public transportation has some of the longest commute times—an average one-way bus commute can take nearly 47 minutes, according to the U.S. Census Bureau. Over the past five decades, however, the percentage of workers using public transportation decreased. In 1970, 9% of workers, or a total of 7 million people, used public transportation to get to their place of employment. This may be due to the lack of transportation development since 1970, making it harder for workers to commute without a vehicle. The rise in remote work during the pandemic also led to a significant decrease in commuting across the country. Public transit ridership will likely continue to see changing patterns in the years ahead as workplaces continue to adapt and change.
Nearly 25% of commuters travel outside their home county for work
While most commuters work and live within the same counties, nearly a quarter travel outside their counties for their jobs. Much less common, at less than 4%, are those who cross state lines for employment. This may be an issue of affordability—the cities or counties they work in can often be significantly more expensive than the areas where they live. For example, with the average home in Seattle priced at $663,100, many commuters reside in less expensive suburbs such as Bothell, Washington, where the average home costs $530,300.

Nearly 8 million employees worked from home before the coronavirus pandemic—and this number keeps growing
As of the latest Census data from 2019, only a small portion of workers were employed remotely at 5%, or 8 million people. However, this is still a much higher proportion than in 1970 when about 4% of employees worked remotely. This is due to the development of personal computers, cellphones, laptops, and cloud computing that make it much easier to communicate from a distance. Because of the pandemic, though, the number of people working from home is increasing. A report by the AAA Foundation for Traffic Safety found that in April 2020, work-related travel for all modes of transportation dropped by 40%. In the following months, the study found that commuting did rise again, but only to about 25% below pre-pandemic levels, indicating that remote work continued to be widely adopted.


