American cities that have grown the most since 1950
American cities that have grown the most since 1950
In 1950, the U.S. population reached a new milestone of 150.1 million people. That number more than doubled by 2016 and is only expected to continue climbing: Experts predict the U.S. to be home to more than 400 million people by 2050.
There's more to population growth than a postwar baby boom, of course, As life expectancies have lengthened from 69 years old in 1950 to a full decade older today, the total number of babies being born outpaces the total number of deaths. Populations also swell when people from other areas move in for job opportunities, warmer weather, or to be closer to family or other loved ones. Each year, an estimated 40 million Americans move at least once, according to U.S. Census Bureau's Population Estimates Program.
But what cities have grown the most in the U.S. since 1950? To find out, Stacker pored over 66 years of U.S. Census data from 1950 through 2016 (the latest data available) to compile a list of the 100 largest American cities by population. The difference in total population for each city between 1950 and 2016 was then calculated. Stacker further trimmed the list down to the 25 cities with the largest increase in inhabitants from 1950 to 2016. For the purposes of this gallery, cities are ordered from fewest to most new residents added in the 66 years reviewed.
While some states like California and Texas have experienced rapid growth across their borders, some cities in states like Utah and Oregon didn't make the cut. Whether you've already planted your roots in one of these U.S. cities, or are looking to make your home elsewhere, check out the 25 cities that have grown the most since 1950.
You may also like: Most bike-friendly cities in America
#25. Raleigh, NC
- Population change: 393,201 increase (+599%)
- 2016 population: 458,880
- 1950 population: 65,679
The population of Raleigh, N.C., has grown by 3% annually for the past century, and projections say the city will reach 600,000 inhabitants by 2035, according to Raleigh's City Planning Department. Raleigh's newest residents are largely comprised of millennials and retirees.
#24. Oklahoma City, OK
- Population change: 394,863 increase (+162%)
- 2016 population: 638,367
- 1950 population: 243,504
Oklahoma City continues to experience population growth despite cities throughout the state seeing stagnant or decreasing populations. Oklahoma City's secret may lie in its below-average cost of living and shorter-than-average commute times.
#23. Colorado Springs, CO
- Population change: 419,629 increase (+923%)
- 2016 population: 465,101
- 1950 population: 45,472
Americans on the move may be looking to Colorado Springs, Colo., for its low rates of violent crime and reasonable cost of living. Not to be overlooked, Colorado Springs is nationally ranked for its percentage of residents with high school, bachelor's, and graduates degrees.
#22. Indianapolis, IN
- Population change: 427,991 increase (+100%)
- 2016 population: 855,164
- 1950 population: 427,173
The automobile industry in the late 1800s brought thousands of Americans to Indianapolis. In 1970, the city's population saw another major surge when Indianapolis and Marion County merged, increasing the city's population by nearly half overnight. A 2018 study at Indiana University found that Indianapolis and its surrounding areas represent the region of highest population growth anywhere in the state.
#21. Fresno, CA
- Population change: 430,384 increase (+470%)
- 2016 population: 522,053
- 1950 population: 91,669
Fresno is located in California's Central Valley, where 8% of U.S. agricultural output is produced on just 1% of the country's farmland. In spite of Fresno's rapid population growth since 1950, the city is among California's poorest and has repeatedly made national headlines for its crystal meth epidemic.
#20. Virginia Beach, VA
- Population change: 447,212 increase (+8,297%)
- 2016 population: 452,602
- 1950 population: 5,390
For two decades after 1950, the population of Virginia Beach doubled or nearly doubled. The city's population has grown more slowly in recent years but continues nevertheless—largely due to the expansion of Washington D.C.'s suburbs.
#19. Albuquerque, NM
- Population change: 462,265 increase (+477%)
- 2016 population: 559,277
- 1950 population: 97,012
In a 1942 letter, journalist Ernie Pyle urged Americans to move to Albuquerque, N.M., to live a life unburdened by the soot and smoke of large cities. The Albuquerque City Council in the 1950s began a similar campaign with ads urging people to make their homes in the Southwest town because it was a “wonderful place to live.”
#18. Mesa, AZ
- Population change: 467,797 increase (+2,786%)
- 2016 population: 484,587
- 1950 population: 16,790
Many soldiers who trained and worked at Falcon Field Airport and Williams Air Force Base during World War II made their homes in the 1950s in Mesa, Ariz. The population spike attracted business owners; and in the years to follow, new jobs in the aerospace industry, farming sector, and technology companies drove more Americans to make this desert city home.
#17. Columbus, OH
- Population change: 484,189 increase (+129%)
- 2016 population: 860,090
- 1950 population: 375,901
Although many Midwest cities have suffered population decreases since the mid-1900s, Columbus, Ohio, seems to be an exception to the rule. That city's population has exploded, along with housing prices—Columbus was ranked by Realtor.com in 2018 as having the fourth-hottest housing market in the country.
#16. Tucson, AZ
- Population change: 485,252 increase (+1,068%)
- 2016 population: 530,706
- 1950 population: 45,454
Staggering population increases in Phoenix and Tucson have led some experts to predict the Arizonan cities may merge by 2040. Job-hunters have been moving to Tucson in particular for its extensive aerospace and defense sectors.
#15. Nashville, TN
- Population change: 486,081 increase (+279%)
- 2016 population: 660,388
- 1950 population: 174,307
Nashville, Tenn., is enjoying a serious population boom. In 2016, Nashville and the surrounding areas grew by what averaged out to approximately 100 people per day, according to 2017 reporting by the Tennessean. While 28% of the population growth was due to birth and death rates, a full 72% of the increase was the result of new residents moving to the area.
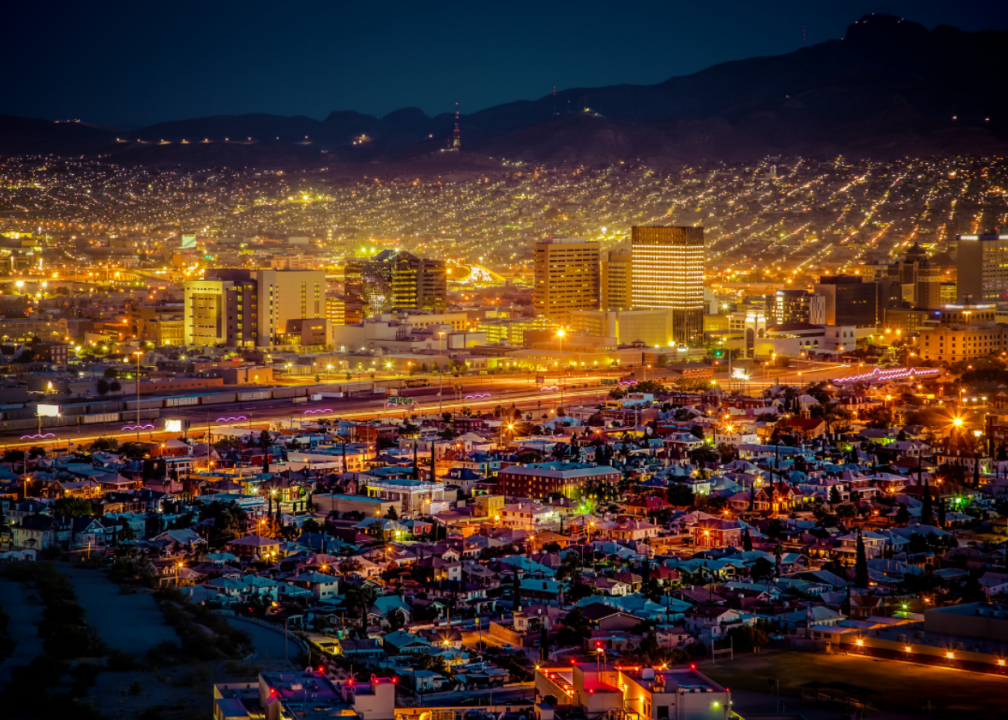
#14. El Paso, TX
- Population change: 552,595 increase (+423%)
- 2016 population: 683,080
- 1950 population: 130,485
El Paso, Texas, saw peak population growth in the 20th century. The average annual growth rate was 7.8% for each year between 1950 and 1960. Rates have tapered off since, with 2018 being a year of record-low-growth for Chucotown.
#13. Fort Worth, TX
- Population change: 575,335 increase (+206%)
- 2016 population: 854,113
- 1950 population: 278,778
The U.S. Census Bureau listed Fort Worth, Texas, as the fastest-growing large city in America between 2000 and 2010. Although the Dallas-Fort Worth metro area continues to expand, increased traffic and rising housing prices may deter growth in the coming years.
#12. Las Vegas, NV
- Population change: 608,494 increase (+2,492%)
- 2016 population: 632,912
- 1950 population: 24,418
Although the city was founded in 1905, Las Vegas didn't see its biggest population spike until the 1980s. Sin City nearly doubled its total number of inhabitants from 1985 to 1995 as increased gambling, tourism, and casino construction brought thousands of jobs to the city.
#11. New York, NY
- Population change: 645,716 increase (+8%)
- 2016 population: 8,537,673
- 1950 population: 7,891,957
Millions of immigrants from 1892 to 1954 made their way through Ellis Island in New York Harbor. Later in the 20th century, the city was marred by crime and gangs—but the Wall Street boom and construction of improved infrastructure in the 1990s helped increase the Big Apple's population.
#10. Jacksonville, FL
- Population change: 676,102 increase (+331%)
- 2016 population: 880,619
- 1950 population: 204,517
Florida is the third-most-populous state in the country and continues to see widespread growth across its cities and towns. Along with warm weather and beautiful beaches, Jacksonville, Fla., offers jobs at Fortune 500 companies and three military bases.
#9. Charlotte, NC
- Population change: 708,009 increase (+528%)
- 2016 population: 842,051
- 1950 population: 134,042
People all over the United States are choosing to move to Charlotte, N.C., and its surrounding suburbs. New residents in the metro area benefited from more than 298,000 workers added between 2005 and 2013—the highest workforce increase in the nation.
#8. Austin, TX
- Population change: 815,431 increase (+616%)
- 2016 population: 947,890
- 1950 population: 132,459
In 2018, the U.S. Census Bureau ranked the Austin, Texas, metropolitan area the fastest-growing U.S. metro for the eighth year in a row. Researchers have found the majority of people moving to Austin are migrating from other cities in the Lone Star State.
#7. Dallas, TX
- Population change: 883,467 increase (+203%)
- 2016 population: 1,317,929
- 1950 population: 434,462
The population booms of Dallas and neighboring Fort Worth, Texas, rival that of the Los Angeles boom in the 1980s, according to global real estate investment firm JLL after studying the numbers. For those who've purchased homes in Dallas, their investments are panning out: One Zillow study found Dallas home value to be increasing at a rate of $7.71 per hour.
#6. San Jose, CA
- Population change: 930,070 increase (+976%)
- 2016 population: 1,025,350
- 1950 population: 95,280
After World War II, aerospace companies and business firms planted roots in San Jose, Calif., thereby solidifying the city's role in Silicon Valley. San Jose in 2015 became one of only 10 cities across the nation at the time to have more than 1 million inhabitants.
#5. San Diego, CA
- Population change: 1,072,243 increase (+321%)
- 2016 population: 1,406,630
- 1950 population: 334,387
Like other cities on this list, World War II helped spur rapid growth along California's southern border. Along with a 321% increase in population, San Diego's land area quadrupled from 1950 to 2000.
#4. San Antonio, TX
- Population change: 1,084,068 increase (+265%)
- 2016 population: 1,492,510
- 1950 population: 408,442
San Antonio is the fifth city from the Lone Star state to make this list. The U.S. Census anticipates the city's strong population growth will continue, adding more than 1.1 million new residents by 2040.
#3. Phoenix, AZ
- Population change: 1,508,199 increase (+1,412%)
- 2016 population: 1,615,017
- 1950 population: 106,818
In 1950, Phoenix, Arizona, measured just over 17 square miles; today, Phoenix covers more than 500 square miles. Despite summer temperatures regularly reaching triple digits, Americans continue to move to this growing Southwestern city, the fifth-largest by population in the country.
#2. Houston, TX
- Population change: 1,707,319 increase (+286%)
- 2016 population: 2,303,482
- 1950 population: 596,163
Many cities in Texas—and Houston in particular—attract thousands of transplants from California each year. Houston's low taxes, business-friendly laws, and ample job opportunities are among the city's most attractive features.
#1. Los Angeles, CA
- Population change: 2,005,964 increase (+102%)
- 2016 population: 3,976,322
- 1950 population: 1,970,358
In each decade after the 1950s, Los Angeles gained hundreds of thousands of new inhabitants. However, despite experiencing the biggest total population growth of any city in America since 1950, Los Angeles County experienced 0% population growth in 2018.


