Aerial view of downtown Pittsfield, Massachusetts

Counties with the biggest percentage drop in population in each state

Written by:
July 15, 2022
Canva

Counties with the biggest percentage drop in population in each state

For decades, America has seen a decline in native-born births. Current population projections aren’t enough to compensate for the accelerated mortality curve that will occur with the passing of the baby boomers. In many communities throughout the United States, the number of deaths exceeds the number of births as the boomer generation has moved past childbearing age and is coming into old age. The U.S. Census Bureau estimates that by 2034, the nation, like many other countries, will have more senior citizens than kids.

The Center for Immigration Statistics found that, between 2008 and 2019, native births fell by 2.3 per thousand, while immigrant births fell by 7.1 per thousand. With recent crackdowns on immigration and an increase in life expectancy, many communities may soon have too few residents of childbearing age to replenish the workforce. These areas in the U.S. report either a stalled population growth rate, or a shrinking population and an overall increase in the average age of their residents. This leads to a reduced workforce, which in turn drives down tax revenues, hamstringing local and state governments’ abilities to reinvest in communities and encourage migration. These factors reduce the workforce even further.

As times change, a community’s makeup can change, too. The factors that can result in a county-level population decline are many, and some are more immediately impactful than others. The closing of a foundational industry can make an area less attractive—a town or string of towns that relies heavily on a manufacturing or automotive production facility for employment can become a ghost town when that facility shutters operations. A community that relies heavily on a single employer, such as a military base, will offer few high-paying, private sector jobs. And if an area is not drawing high-income workers, it may not have amenities that would be expected in more developed areas, such as gyms, coffee shops, parks, quality schools, and established or big-box retailers. These factors may make the choice between staying local and moving to a bigger market a painful but necessary one.

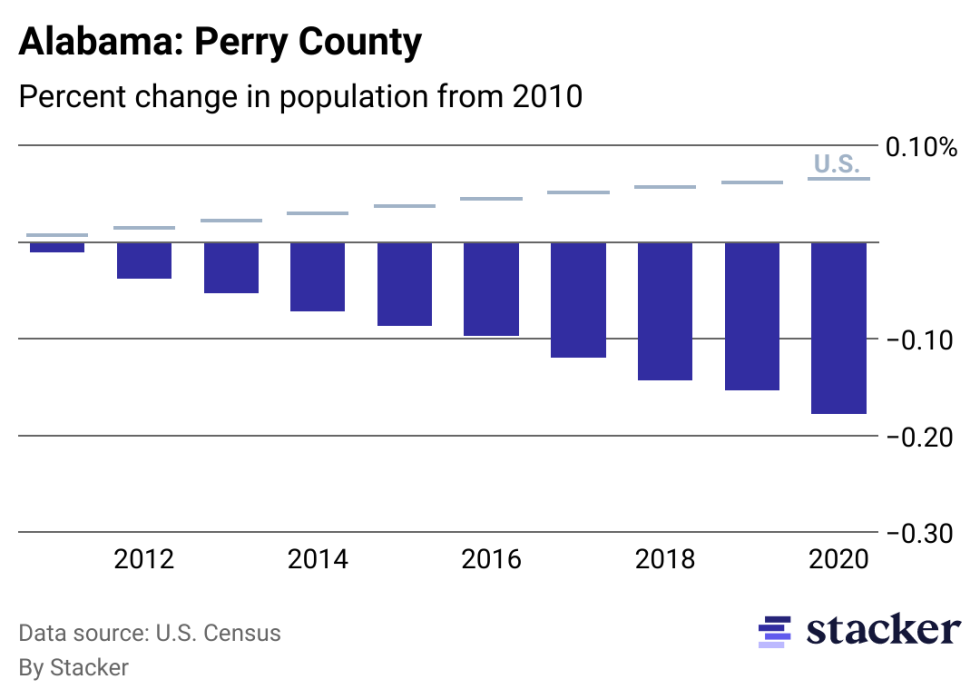
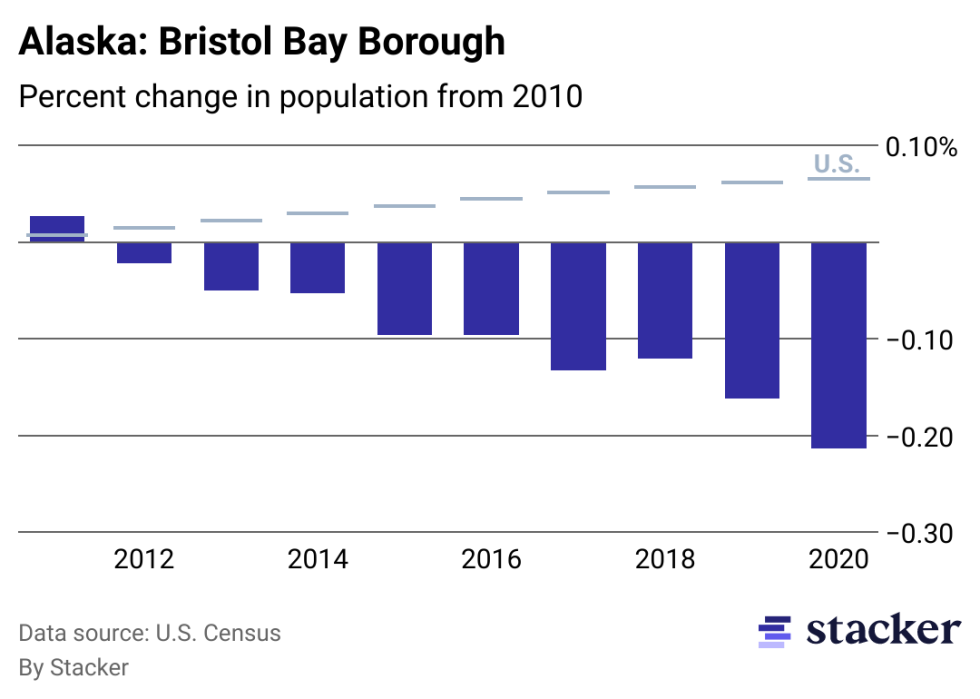
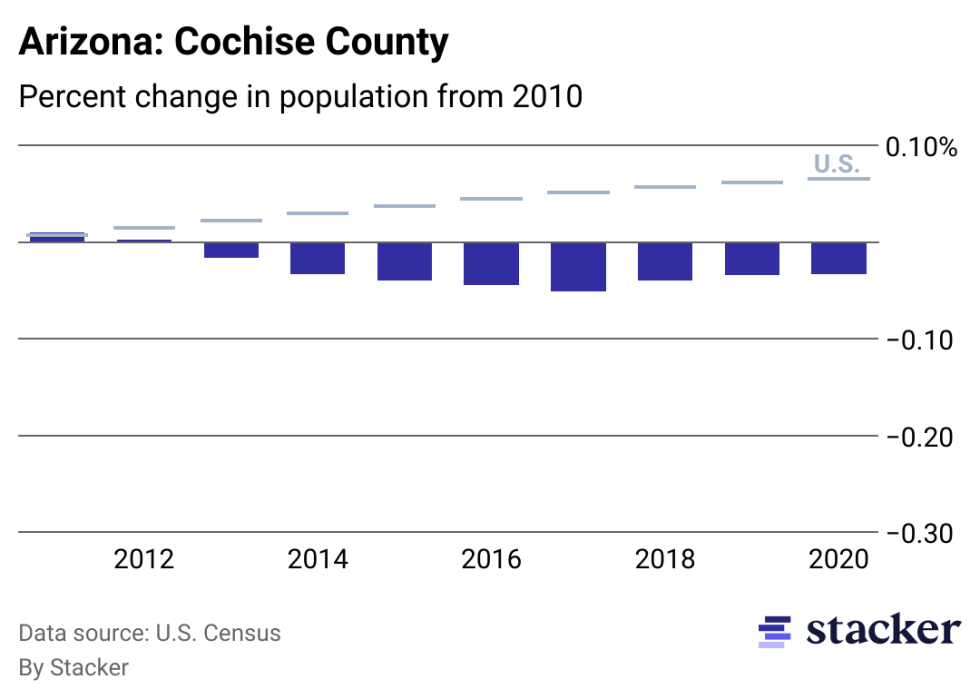
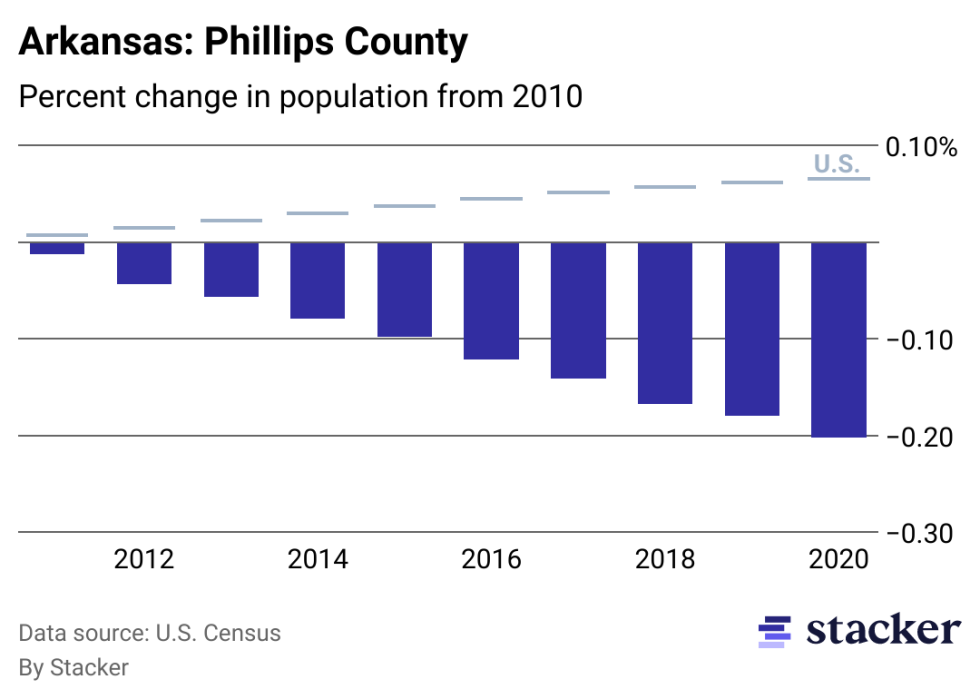
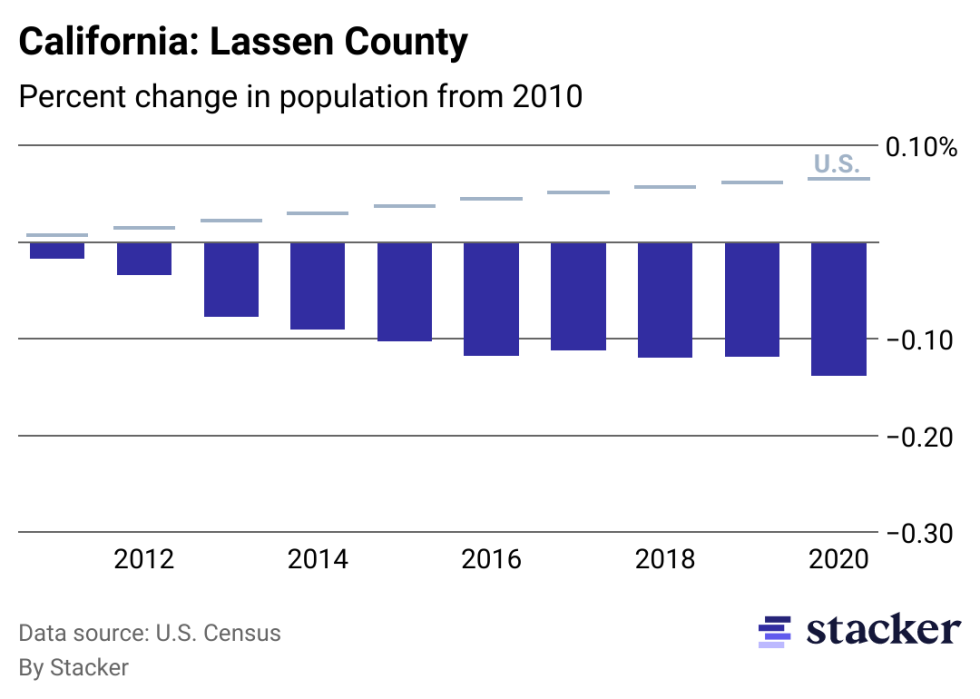
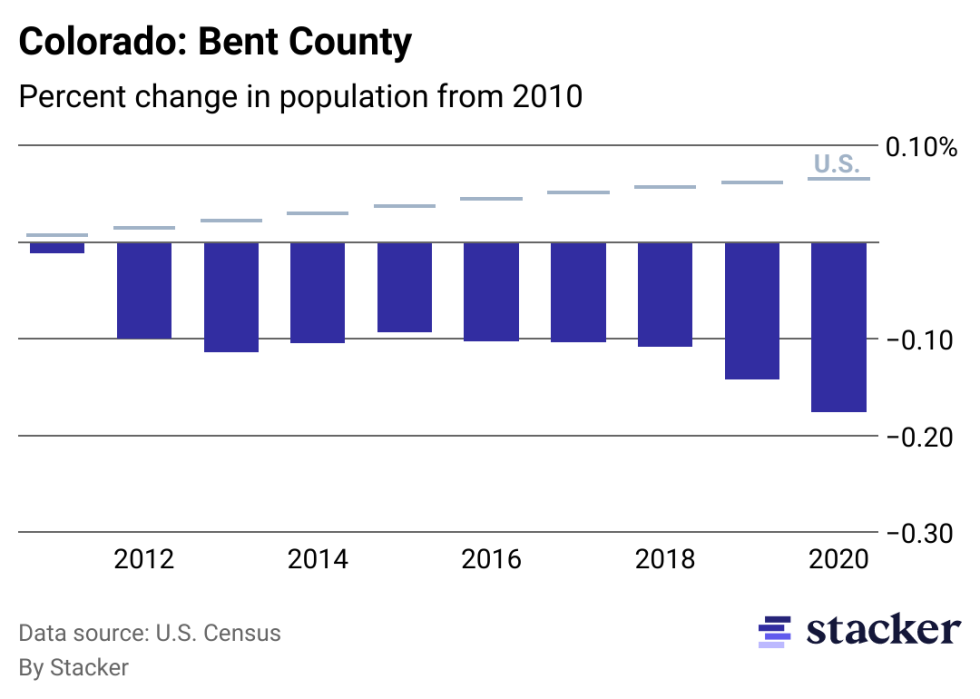
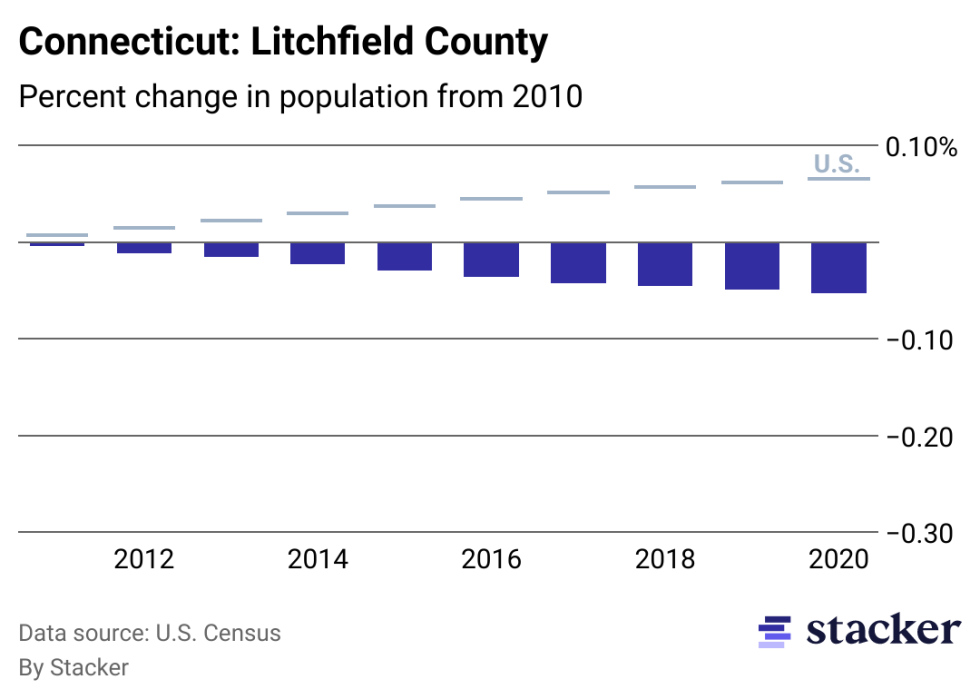
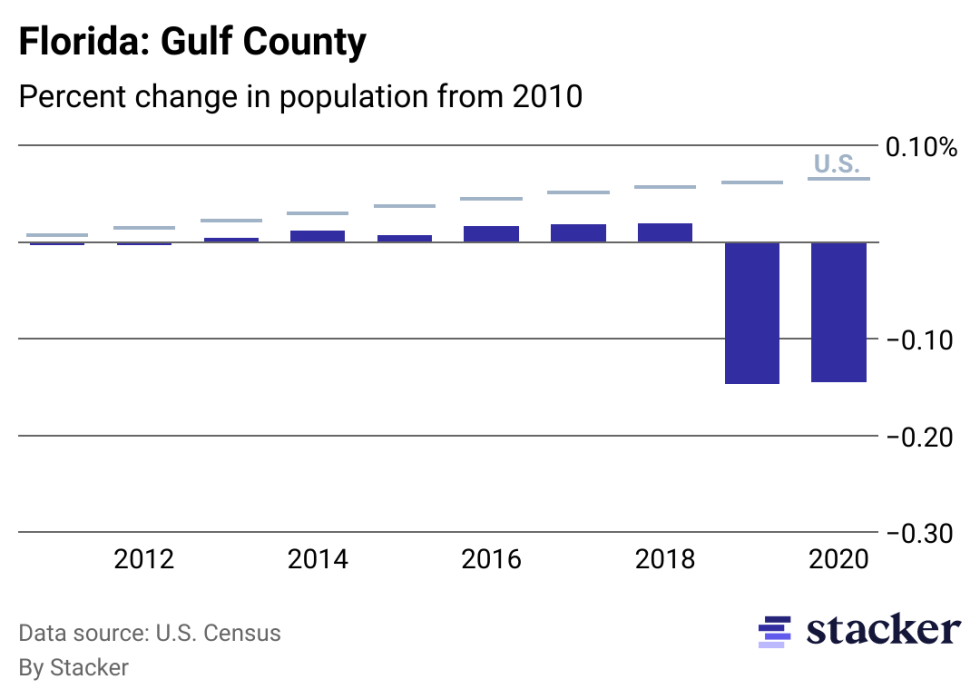
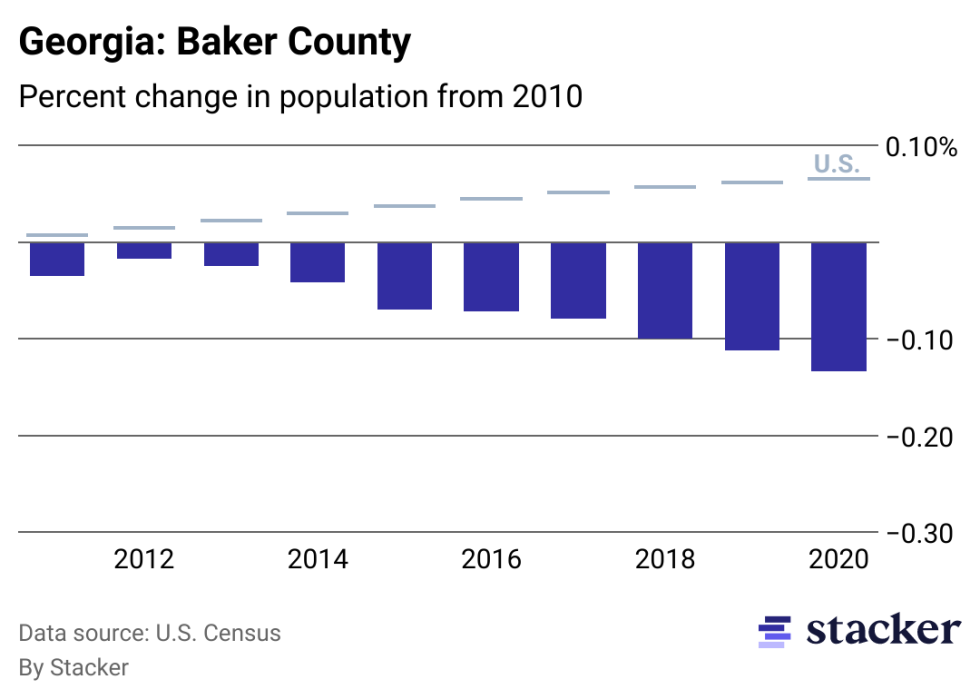
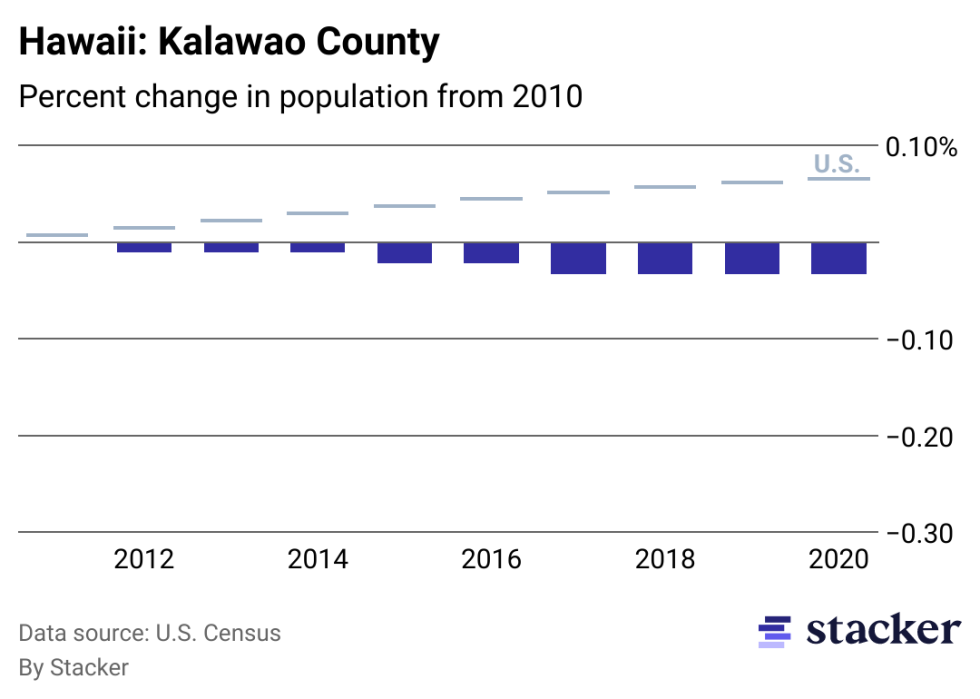
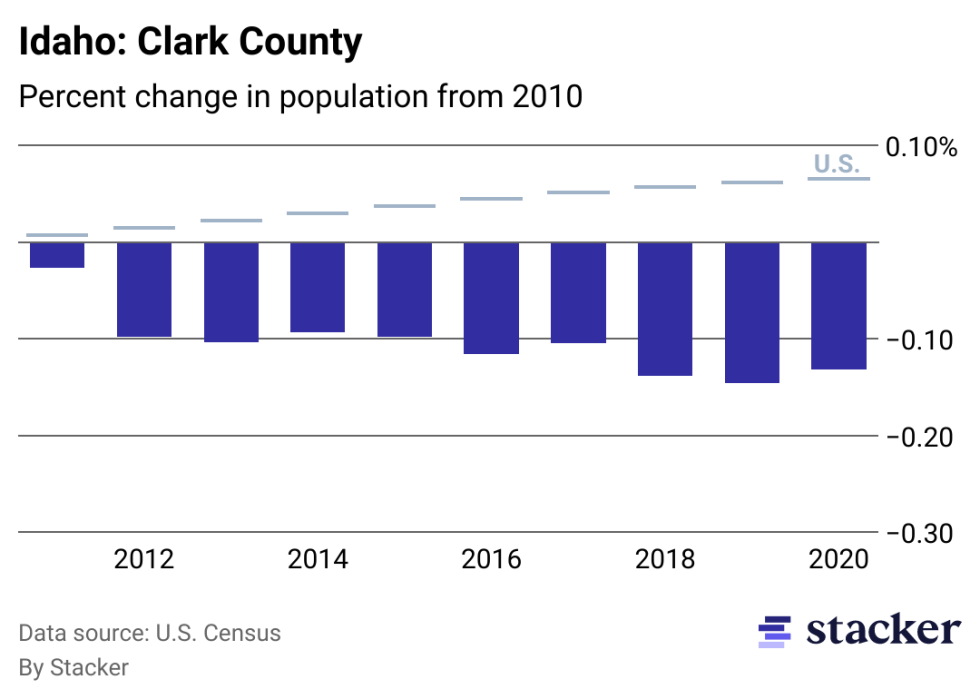
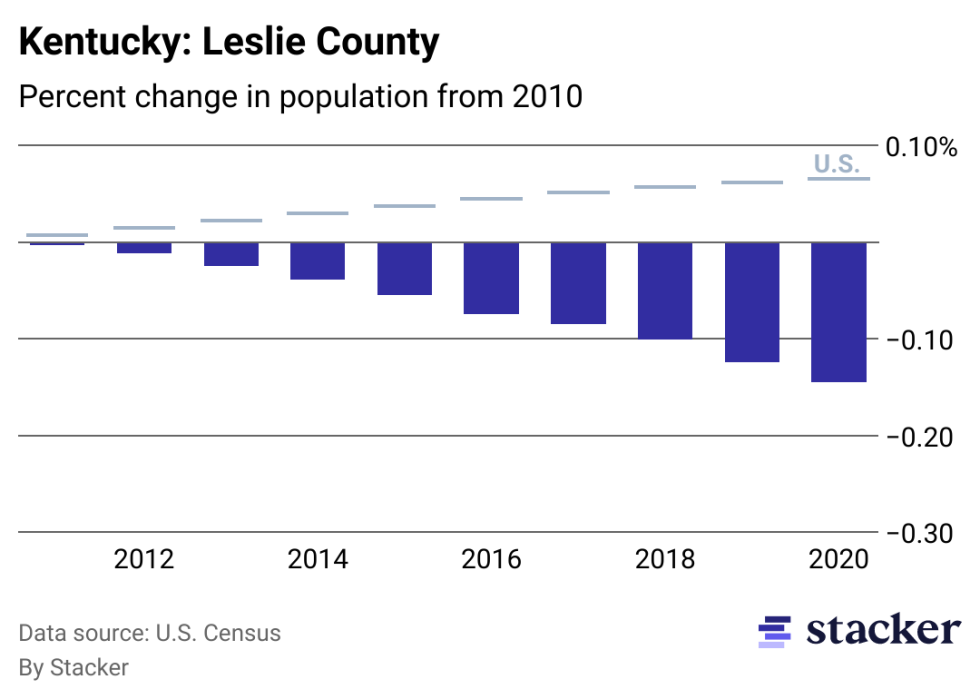
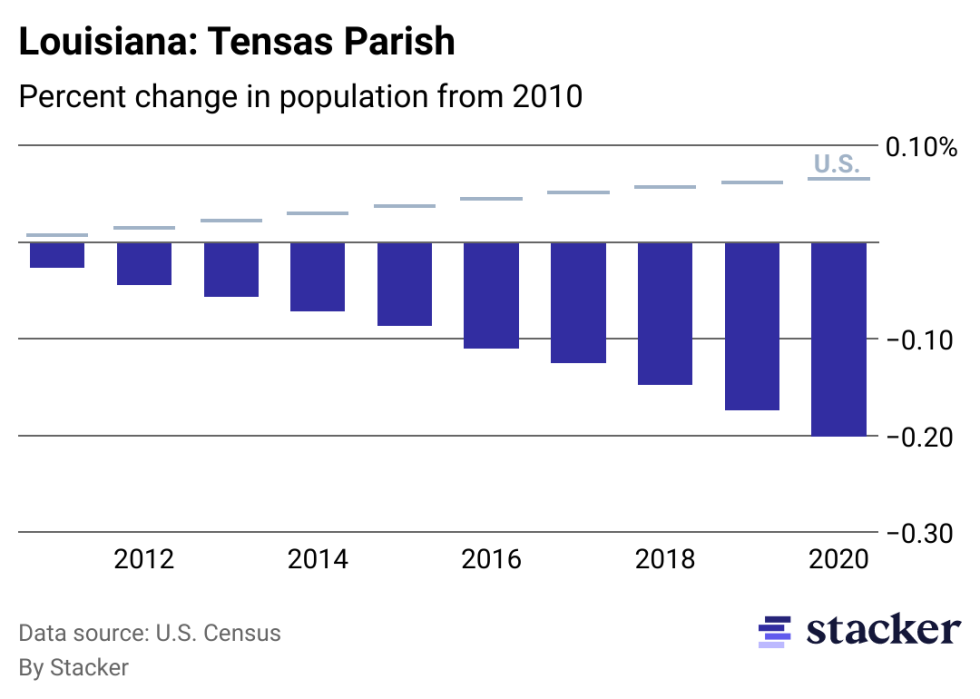
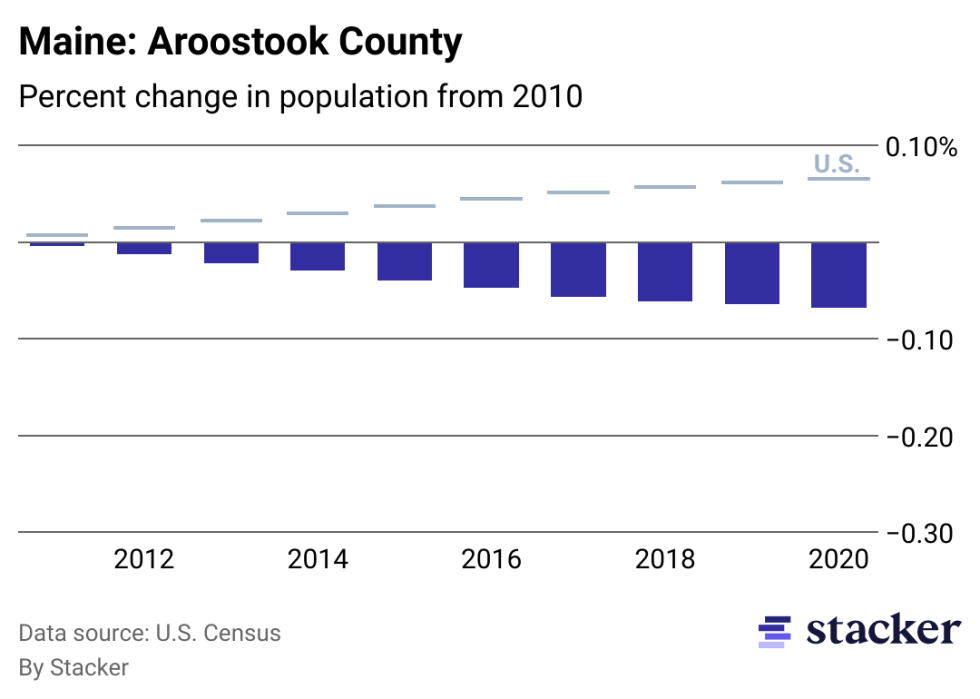
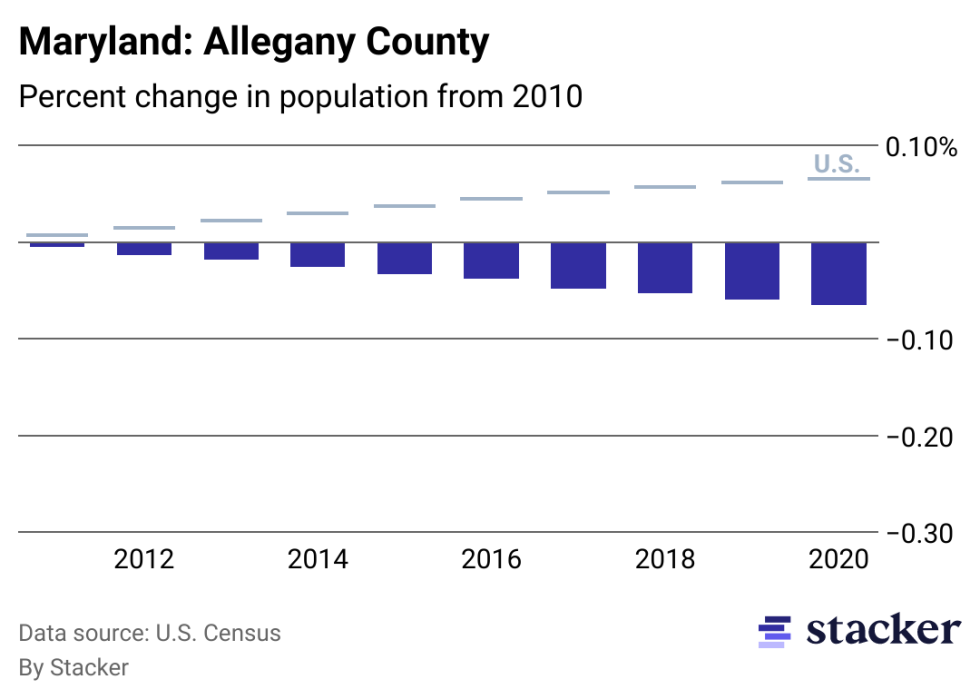
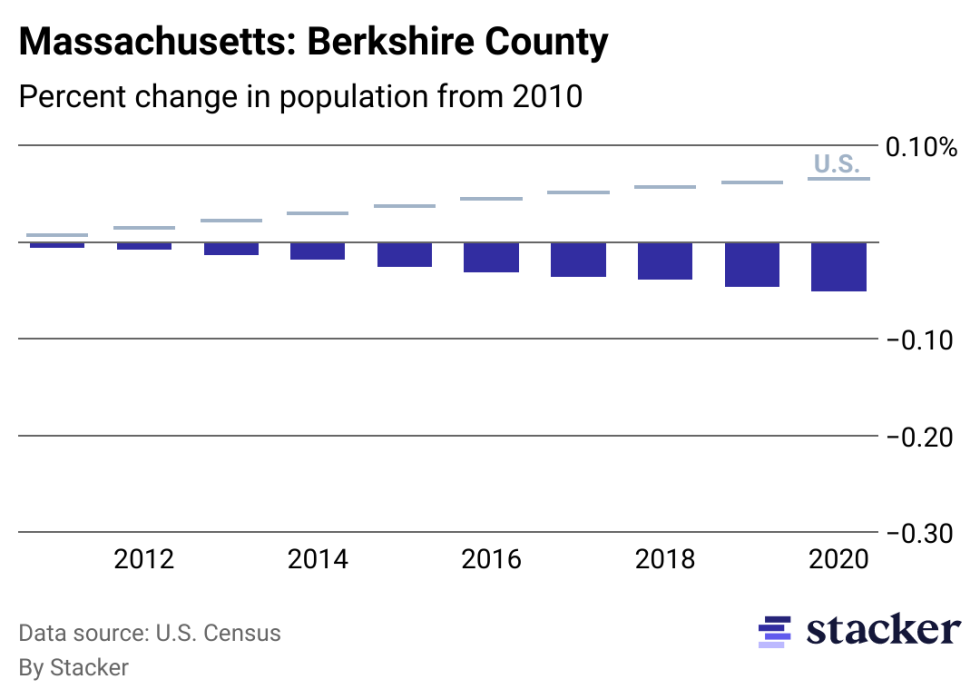
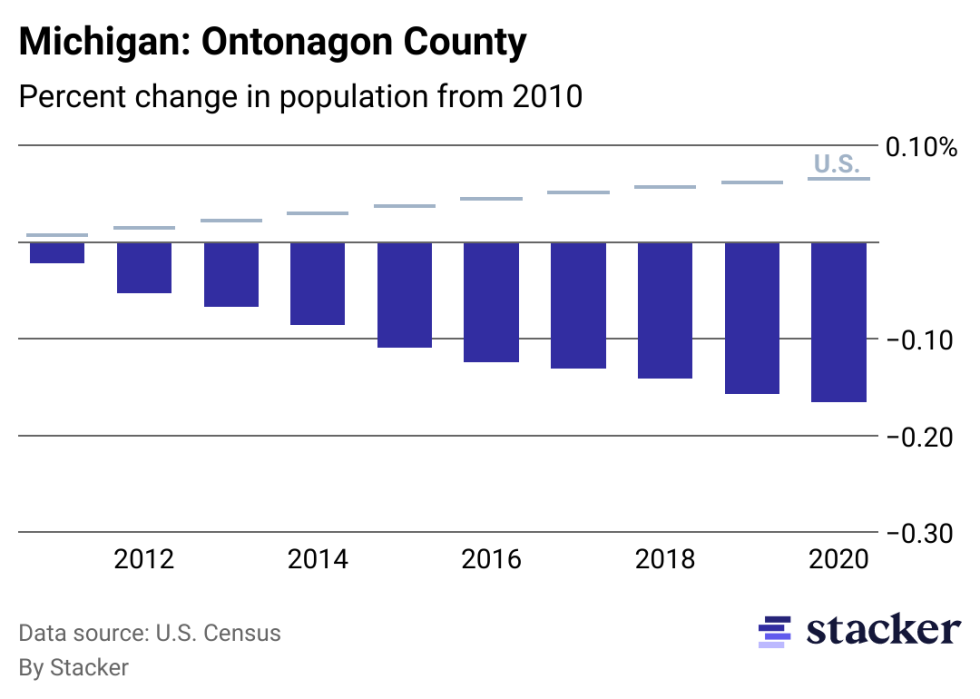
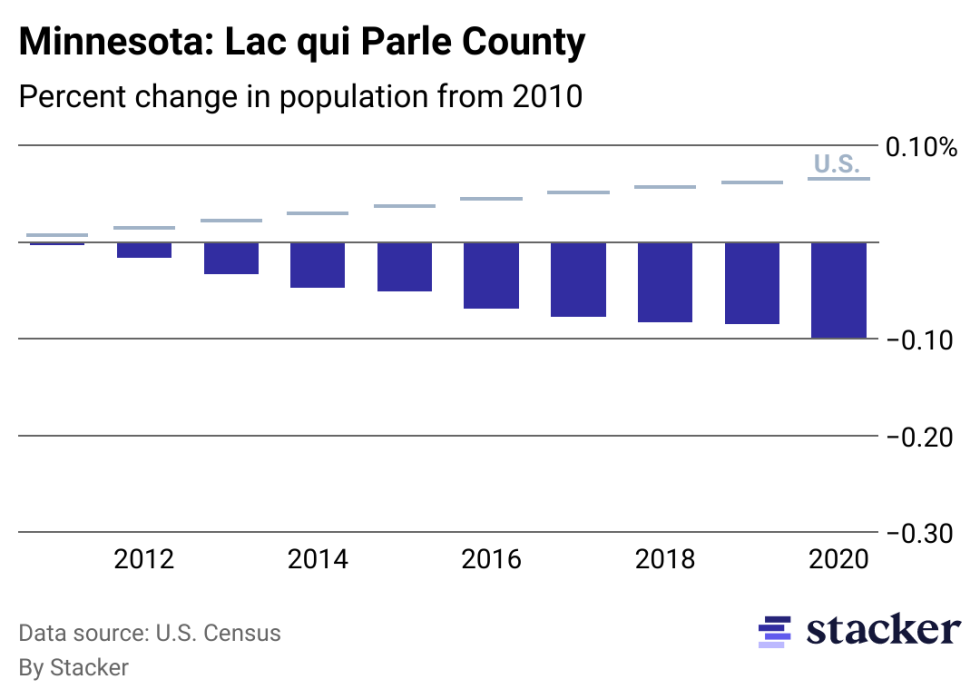
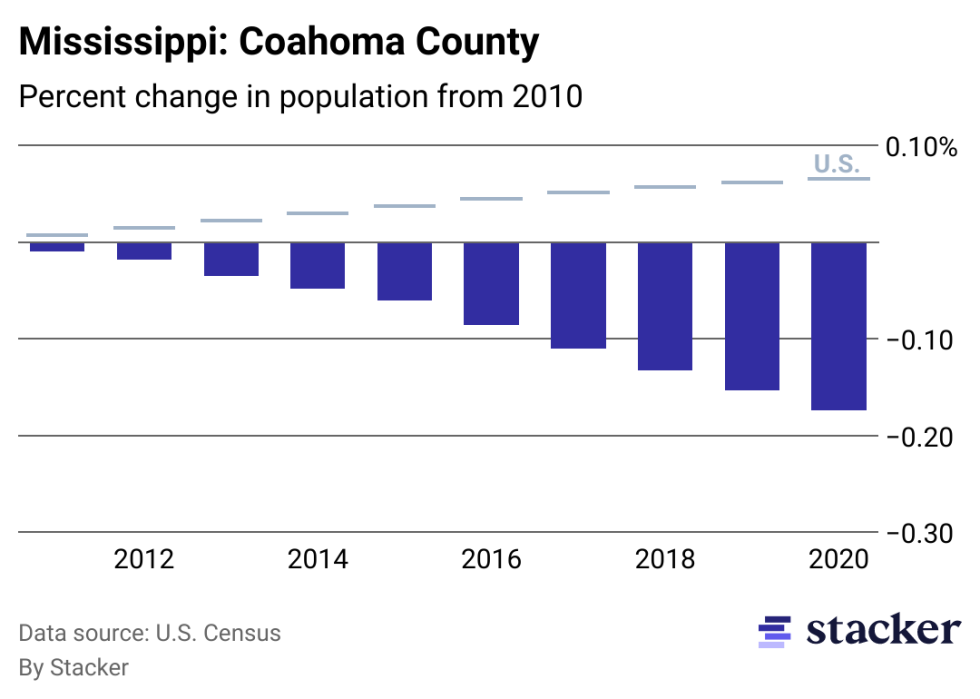
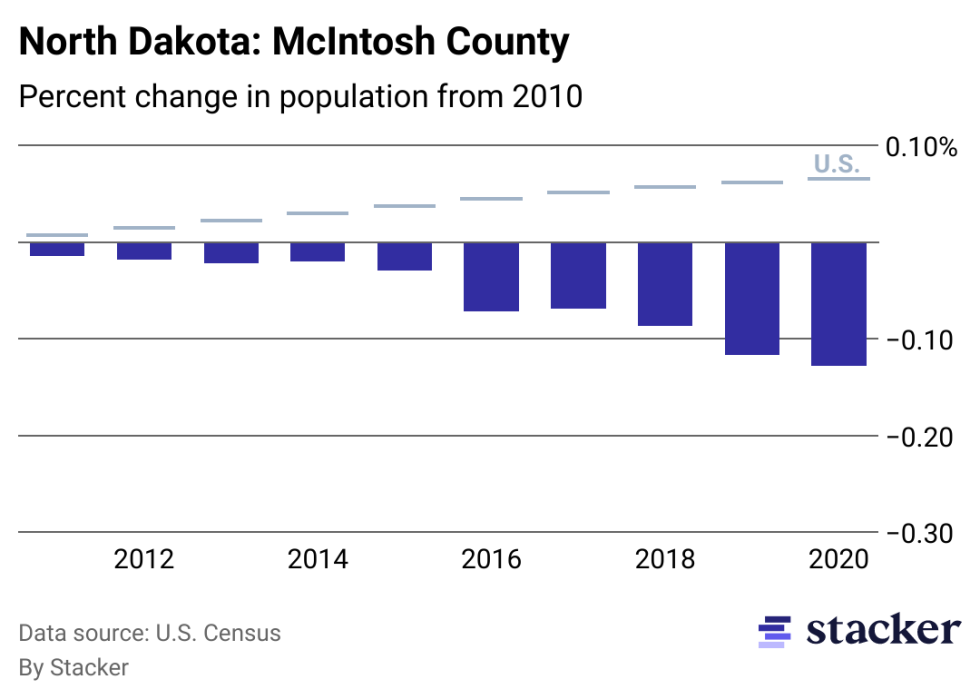
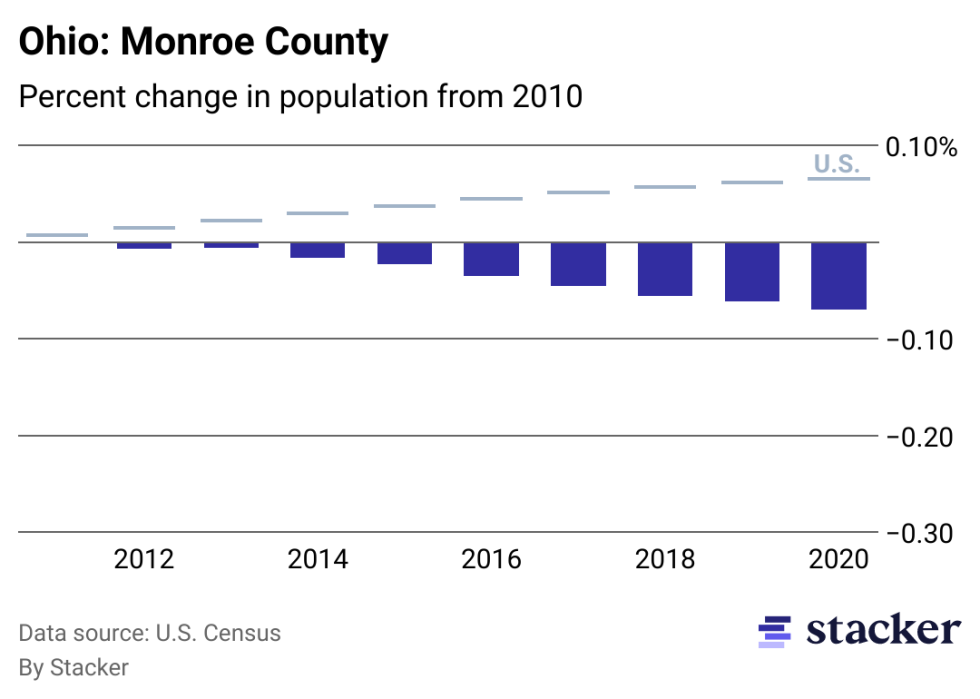
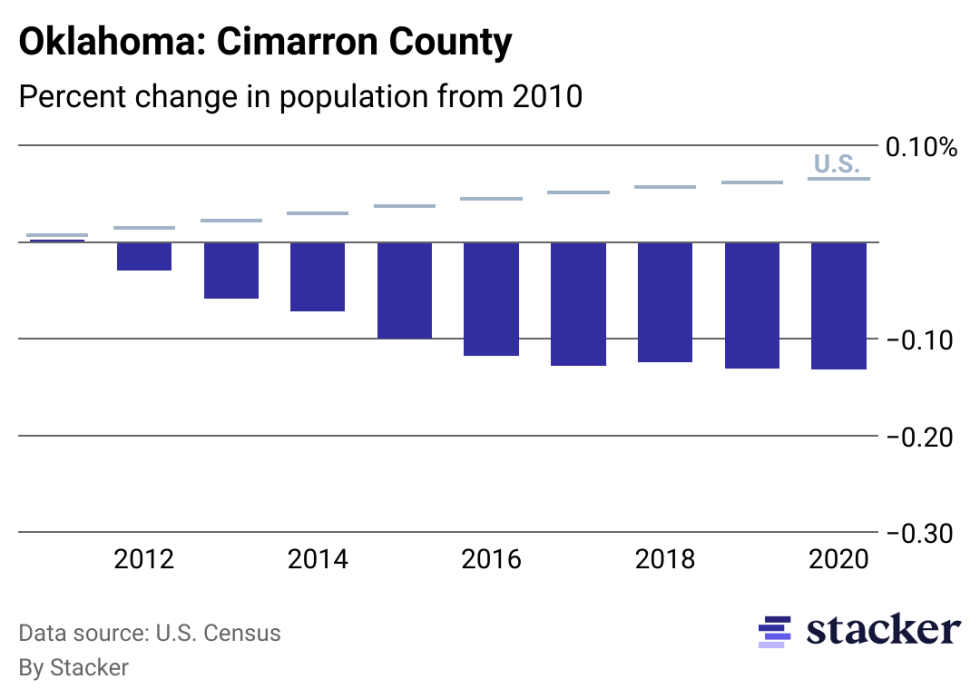
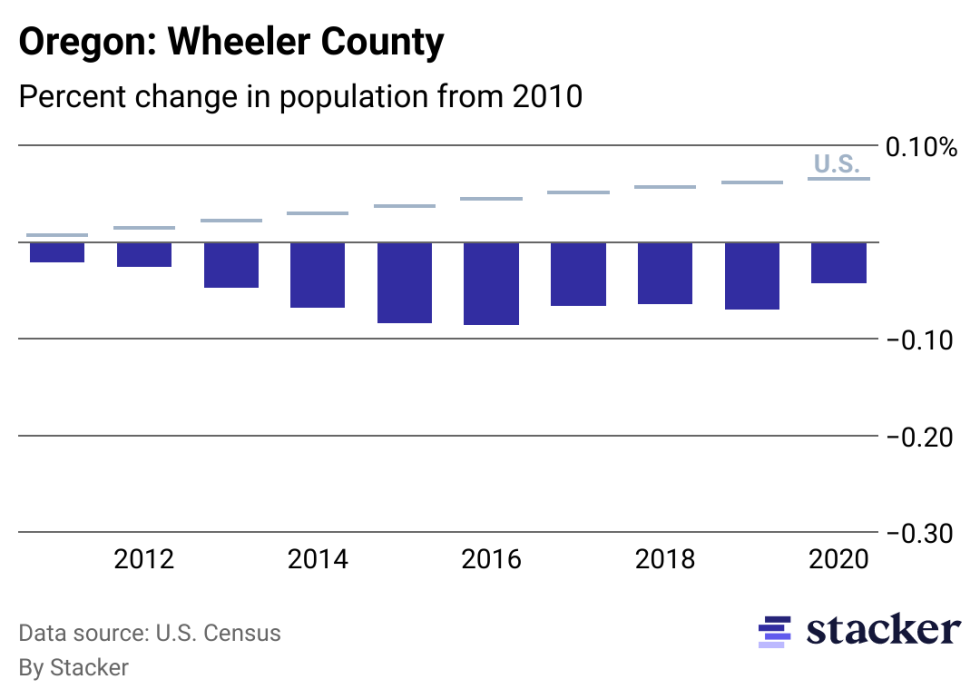
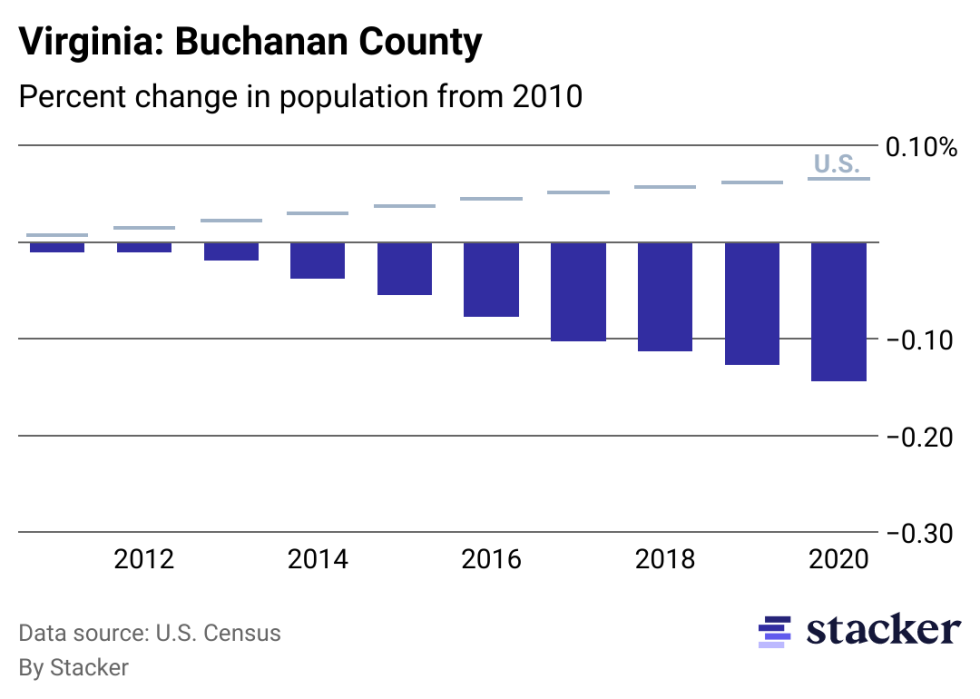
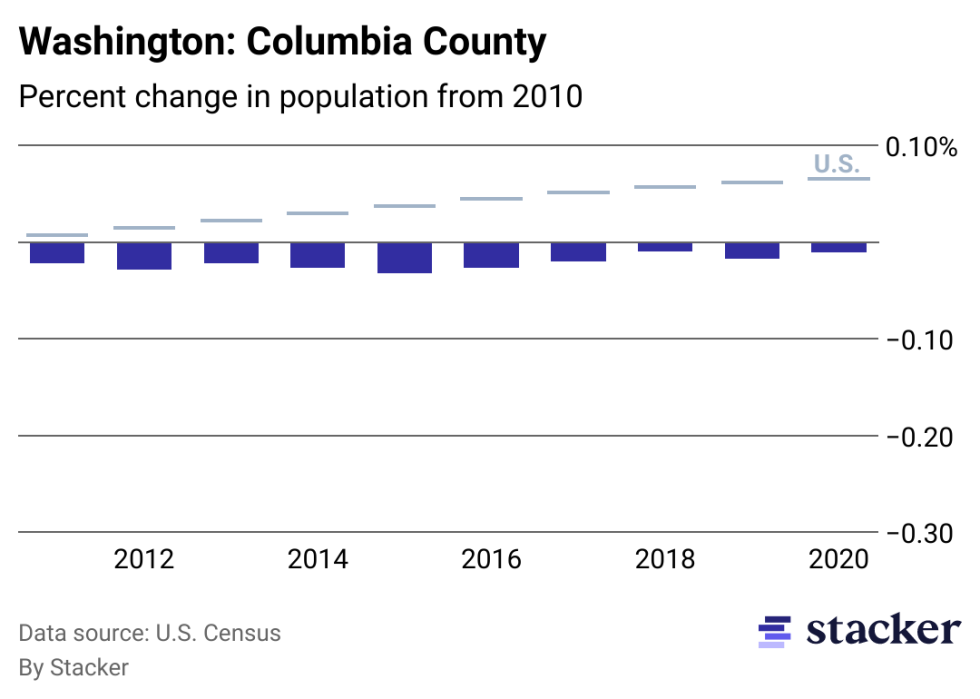
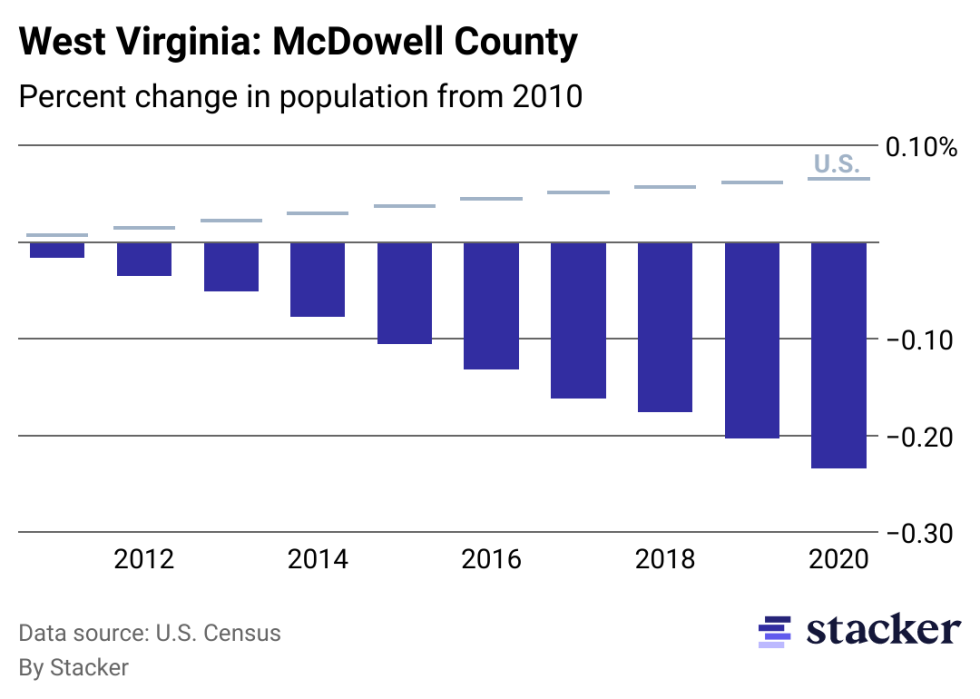
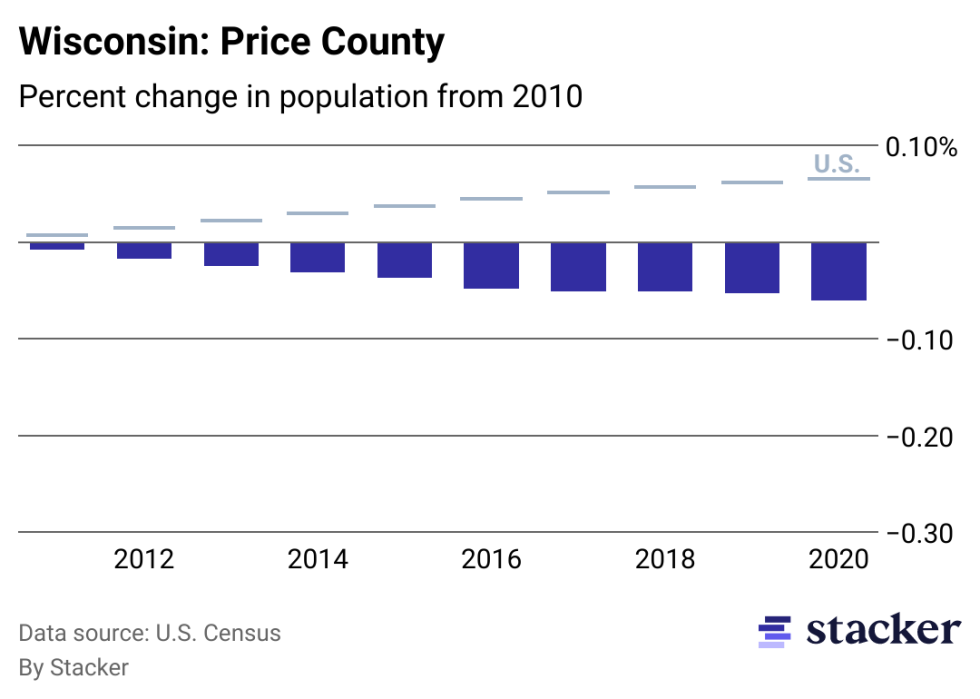
Looking at data from the U.S. Census Bureau’s Annual Estimates of the Resident Population for Counties in the United States from April 1, 2020 to July 1, 2021—which was released in March 2022—Stacker determined the counties in each state that have had the greatest drop in population by percentage. For this list, we considered counties and county-equivalents. For each state, the county with the greatest decline in population from 2010 to 2020 has been included. There is one caveat: the state of Delaware did not have a single county that showed a population decline; the only county that came close was New Castle County, which gained a little more than 23,000 residents during this time period. Delaware is thus absent from this list.

Each state has its growth regions, and each has its areas of decline. Read on to find out which counties across the country have been facing a shrinking population.

Chart showing 17.77% population decrease from 2010 to 2020 for Perry County, Alabama, compared to overall population increase for the U.S.
1 / 49
Stacker

Alabama: Perry County

- County population in 2020: 8,940 (down from 10,577 in 2010)
- State population change from 2010 to 2020: +2.84%

Chart showing 21.36% population decrease from 2010 to 2020 for Bristol Bay Borough, Alaska, compared to overall population increase for the U.S.
2 / 49
Stacker

Alaska: Bristol Bay Borough

- County population in 2020: 840 (down from 997 in 2010)
- State population change from 2010 to 2020: +2.41%

Chart showing 3.32% population decrease from 2010 to 2020 for Cochise County, Arizona, compared to overall population increase for the U.S.
3 / 49
Stacker

Arizona: Cochise County

- County population in 2020: 127,248 (down from 131,359 in 2010)
- State population change from 2010 to 2020: +15.83%

Chart showing 20.19% population decrease from 2010 to 2020 for Phillips County, Arkansas, compared to overall population increase for the U.S.
4 / 49
Stacker

Arkansas: Phillips County

- County population in 2020: 17,769 (down from 21,755 in 2010)
- State population change from 2010 to 2020: +3.71%

Chart showing 13.82% population decrease from 2010 to 2020 for Lassen County, California, compared to overall population increase for the U.S.
5 / 49
Stacker

California: Lassen County

- County population in 2020: 30,694 (down from 34,895 in 2010)
- State population change from 2010 to 2020: +5.49%

Chart showing 17.60% population decrease from 2010 to 2020 for Bent County, Colorado, compared to overall population increase for the U.S.
6 / 49
Stacker

Colorado: Bent County

- County population in 2020: 5,578 (down from 6,499 in 2010)
- State population change from 2010 to 2020: +15.06%

Chart showing 5.35% population decrease from 2010 to 2020 for Litchfield County, Connecticut, compared to overall population increase for the U.S.
7 / 49
Stacker

Connecticut: Litchfield County

- County population in 2020: 180,396 (down from 189,876 in 2010)
- State population change from 2010 to 2020: -0.62%

Chart showing 14.48% population decrease from 2010 to 2020 for Gulf County, Florida, compared to overall population increase for the U.S.
8 / 49
Stacker

Florida: Gulf County

- County population in 2020: 13,498 (down from 15,863 in 2010)
- State population change from 2010 to 2020: +15.32%

Chart showing 13.41% population decrease from 2010 to 2020 for Baker County, Georgia, compared to overall population increase for the U.S.
9 / 49
Stacker

Georgia: Baker County

- County population in 2020: 3,047 (down from 3,447 in 2010)
- State population change from 2010 to 2020: +10.27%

Chart showing 3.33% population decrease from 2010 to 2020 for Kalawao County, Hawaii, compared to overall population increase for the U.S.
10 / 49
Stacker

Hawaii: Kalawao County

- County population in 2020: 87 (down from 90 in 2010)
- State population change from 2010 to 2020: +3.15%

Chart showing 13.15% population decrease from 2010 to 2020 for Clark County, Idaho, compared to overall population increase for the U.S.
11 / 49
Stacker

Idaho: Clark County

- County population in 2020: 838 (down from 982 in 2010)
- State population change from 2010 to 2020: +16.30%

Chart showing 33.00% population decrease from 2010 to 2020 for Alexander County, Illinois, compared to overall population increase for the U.S.
12 / 49
Stacker

Illinois: Alexander County

- County population in 2020: 5,791 (down from 8,238 in 2010)
- State population change from 2010 to 2020: -1.97%

Chart showing 7.74% population decrease from 2010 to 2020 for Blackford County, Indiana, compared to overall population increase for the U.S.
13 / 49
Stacker

Indiana: Blackford County

- County population in 2020: 11,787 (down from 12,766 in 2010)
- State population change from 2010 to 2020: +4.07%

Chart showing 11.50% population decrease from 2010 to 2020 for Emmet County, Iowa, compared to overall population increase for the U.S.
14 / 49
Stacker

Iowa: Emmet County

- County population in 2020: 9,224 (down from 10,302 in 2010)
- State population change from 2010 to 2020: +3.70%

Chart showing 21.69% population decrease from 2010 to 2020 for Morton County, Kansas, compared to overall population increase for the U.S.
15 / 49
Stacker

Kansas: Morton County

- County population in 2020: 2,536 (down from 3,233 in 2010)
- State population change from 2010 to 2020: +1.94%

Chart showing 14.55% population decrease from 2010 to 2020 for Leslie County, Kentucky, compared to overall population increase for the U.S.
16 / 49
Stacker

Kentucky: Leslie County

- County population in 2020: 9,880 (down from 11,310 in 2010)
- State population change from 2010 to 2020: +2.96%

Chart showing 20.10% population decrease from 2010 to 2020 for Tensas Parish, Louisiana, compared to overall population increase for the U.S.
17 / 49
Stacker

Louisiana: Tensas Parish

- County population in 2020: 4,319 (down from 5,250 in 2010)
- State population change from 2010 to 2020: +2.22%

Chart showing 6.83% population decrease from 2010 to 2020 for Aroostook County, Maine, compared to overall population increase for the U.S.
18 / 49
Stacker

Maine: Aroostook County

- County population in 2020: 67,092 (down from 71,873 in 2010)
- State population change from 2010 to 2020: +1.69%

Chart showing 6.55% population decrease from 2010 to 2020 for Allegany County, Maryland, compared to overall population increase for the U.S.
19 / 49
Stacker

Maryland: Allegany County

- County population in 2020: 70,527 (down from 75,042 in 2010)
- State population change from 2010 to 2020: +4.61%

Chart showing 5.14% population decrease from 2010 to 2020 for Berkshire County, Massachusetts, compared to overall population increase for the U.S.
20 / 49
Stacker

Massachusetts: Berkshire County

- County population in 2020: 125,217 (down from 131,274 in 2010)
- State population change from 2010 to 2020: +4.98%

Chart showing 16.53% population decrease from 2010 to 2020 for Ontonagon County, Michigan, compared to overall population increase for the U.S.
21 / 49
Stacker

Michigan: Ontonagon County

- County population in 2020: 5,713 (down from 6,780 in 2010)
- State population change from 2010 to 2020: +0.90%

Chart showing 9.91% population decrease from 2010 to 2020 for Lac qui Parle County, Minnesota, compared to overall population increase for the U.S.
22 / 49
Stacker

Minnesota: Lac qui Parle County

- County population in 2020: 6,628 (down from 7,258 in 2010)
- State population change from 2010 to 2020: +6.52%

Chart showing 17.41% population decrease from 2010 to 2020 for Coahoma County, Mississippi, compared to overall population increase for the U.S.
23 / 49
Stacker

Mississippi: Coahoma County

- County population in 2020: 22,095 (down from 26,151 in 2010)
- State population change from 2010 to 2020: -0.13%

Chart showing 15.16% population decrease from 2010 to 2020 for DeKalb County, Missouri, compared to overall population increase for the U.S.
24 / 49
Stacker

Missouri: DeKalb County

- County population in 2020: 10,802 (down from 12,888 in 2010)
- State population change from 2010 to 2020: +2.59%

Chart showing 12.30% population decrease from 2010 to 2020 for Toole County, Montana, compared to overall population increase for the U.S.
25 / 49
Stacker

Montana: Toole County

- County population in 2020: 4,709 (down from 5,324 in 2010)
- State population change from 2010 to 2020: +9.07%

26 / 49
Stacker

Nebraska: Dundy County

- County population in 2020: 1,686 (down from 2,008 in 2010)
- State population change from 2010 to 2020: +5.90%

Chart showing 5.70% population decrease from 2010 to 2020 for Mineral County, Nevada, compared to overall population increase for the U.S.
27 / 49
Stacker

Nevada: Mineral County

- County population in 2020: 4,516 (down from 4,770 in 2010)
- State population change from 2010 to 2020: +16.13%

Chart showing 5.45% population decrease from 2010 to 2020 for Coos County, New Hampshire, compared to overall population increase for the U.S.
28 / 49
Stacker

New Hampshire: Coos County

- County population in 2020: 31,421 (down from 33,052 in 2010)
- State population change from 2010 to 2020: +3.76%

Chart showing 6.17% population decrease from 2010 to 2020 for Cumberland County, New Jersey, compared to overall population increase for the U.S.
29 / 49
Stacker

New Jersey: Cumberland County

- County population in 2020: 148,995 (down from 156,610 in 2010)
- State population change from 2010 to 2020: +0.94%

Chart showing 17.63% population decrease from 2010 to 2020 for De Baca County, New Mexico, compared to overall population increase for the U.S.
30 / 49
Stacker

New Mexico: De Baca County

- County population in 2020: 1,741 (down from 2,024 in 2010)
- State population change from 2010 to 2020: +2.02%

Chart showing 10.45% population decrease from 2010 to 2020 for Hamilton County, New York, compared to overall population increase for the U.S.
31 / 49
Stacker

New York: Hamilton County

- County population in 2020: 4,438 (down from 4,842 in 2010)
- State population change from 2010 to 2020: -0.33%

Chart showing 16.67% population decrease from 2010 to 2020 for Hyde County, North Carolina, compared to overall population increase for the U.S.
32 / 49
Stacker

North Carolina: Hyde County

- County population in 2020: 4,932 (down from 5,817 in 2010)
- State population change from 2010 to 2020: +10.72%

Chart showing 12.86% population decrease from 2010 to 2020 for McIntosh County, North Dakota, compared to overall population increase for the U.S.
33 / 49
Stacker

North Dakota: McIntosh County

- County population in 2020: 2,473 (down from 2,813 in 2010)
- State population change from 2010 to 2020: +13.42%

Chart showing 7.00% population decrease from 2010 to 2020 for Monroe County, Ohio, compared to overall population increase for the U.S.
34 / 49
Stacker

Ohio: Monroe County

- County population in 2020: 13,708 (down from 14,631 in 2010)
- State population change from 2010 to 2020: +1.33%

Chart showing 13.23% population decrease from 2010 to 2020 for Cimarron County, Oklahoma, compared to overall population increase for the U.S.
35 / 49
Stacker

Oklahoma: Cimarron County

- County population in 2020: 2,148 (down from 2,475 in 2010)
- State population change from 2010 to 2020: +5.87%

Chart showing 4.28% population decrease from 2010 to 2020 for Wheeler County, Oregon, compared to overall population increase for the U.S.
36 / 49
Stacker

Oregon: Wheeler County

- County population in 2020: 1,348 (down from 1,441 in 2010)
- State population change from 2010 to 2020: +10.52%

Chart showing 14.76% population decrease from 2010 to 2020 for Cameron County, Pennsylvania, compared to overall population increase for the U.S.
37 / 49
Stacker

Pennsylvania: Cameron County

- County population in 2020: 4,425 (down from 5,085 in 2010)
- State population change from 2010 to 2020: +0.57%

Chart showing 2.94% population decrease from 2010 to 2020 for Bristol County, Rhode Island, compared to overall population increase for the U.S.
38 / 49
Stacker

Rhode Island: Bristol County

- County population in 2020: 48,527 (down from 49,842 in 2010)
- State population change from 2010 to 2020: +0.30%

Chart showing 19.54% population decrease from 2010 to 2020 for Allendale County, South Carolina, compared to overall population increase for the U.S.
39 / 49
Stacker

South Carolina: Allendale County

- County population in 2020: 8,627 (down from 10,419 in 2010)
- State population change from 2010 to 2020: +12.56%

Chart showing 9.92% population decrease from 2010 to 2020 for Hyde County, South Dakota, compared to overall population increase for the U.S.
40 / 49
Stacker

South Dakota: Hyde County

- County population in 2020: 1,295 (down from 1,420 in 2010)
- State population change from 2010 to 2020: +9.38%

Chart showing 10.72% population decrease from 2010 to 2020 for Lake County, Tennessee, compared to overall population increase for the U.S.
41 / 49
Stacker

Tennessee: Lake County

- County population in 2020: 7,010 (down from 7,832 in 2010)
- State population change from 2010 to 2020: +8.36%

Chart showing 31.07% population decrease from 2010 to 2020 for Concho County, Texas, compared to overall population increase for the U.S.
42 / 49
Stacker

Texas: Concho County

- County population in 2020: 2,749 (down from 4,087 in 2010)
- State population change from 2010 to 2020: +16.32%

Chart showing 7.79% population decrease from 2010 to 2020 for Emery County, Utah, compared to overall population increase for the U.S.
43 / 49
Stacker

Utah: Emery County

- County population in 2020: 10,061 (down from 10,976 in 2010)
- State population change from 2010 to 2020: +17.10%

Chart showing 6.20% population decrease from 2010 to 2020 for Rutland County, Vermont, compared to overall population increase for the U.S.
44 / 49
Stacker

Vermont: Rutland County

- County population in 2020: 58,125 (down from 61,659 in 2010)
- State population change from 2010 to 2020: -0.41%

Chart showing 14.44% population decrease from 2010 to 2020 for Buchanan County, Virginia, compared to overall population increase for the U.S.
45 / 49
Stacker

Virginia: Buchanan County

- County population in 2020: 21,031 (down from 24,109 in 2010)
- State population change from 2010 to 2020: +7.06%

Chart showing 1.12% population decrease from 2010 to 2020 for Columbia County, Washington, compared to overall population increase for the U.S.
46 / 49
Stacker

Washington: Columbia County

- County population in 2020: 4,023 (down from 4,078 in 2010)
- State population change from 2010 to 2020: +14.10%

Chart showing 23.44% population decrease from 2010 to 2020 for McDowell County, West Virginia, compared to overall population increase for the U.S.
47 / 49
Stacker

West Virginia: McDowell County

- County population in 2020: 17,600 (down from 22,108 in 2010)
- State population change from 2010 to 2020: -3.75%

Chart showing 6.04% population decrease from 2010 to 2020 for Price County, Wisconsin, compared to overall population increase for the U.S.
48 / 49
Stacker

Wisconsin: Price County

- County population in 2020: 13,347 (down from 14,159 in 2010)
- State population change from 2010 to 2020: +2.50%

Chart showing 9.04% population decrease from 2010 to 2020 for Washakie County, Wyoming, compared to overall population increase for the U.S.
49 / 49
Stacker

Wyoming: Washakie County

- County population in 2020: 7,824 (down from 8,528 in 2010)
- State population change from 2010 to 2020: +3.15%

Trending Now