Metro areas with the most income inequality
Metro areas with the most income inequality
Income inequality has become a major issue in the United States, where a quarter of all workers make less than $10 an hour while the wealthiest 0.1% of Americans in 2017 had 188 times the income of the bottom 90%. Productivity is at its highest rate, yet hourly compensations are roughly where they were in 1972, adjusted for inflation.
A decrease in labor-union protections, along with racially and gender-based wage disparities, have left wealth generation concentrated among the investor class.
While some income inequality is arguably necessary to encourage job growth, too much can starve off productivity. If inequality is too high, one argument goes, there is the danger of rewarding investors beyond the value of the investment while reducing the incentive for workers to produce. The current model in the U.S. could eventually lead to a weakening of the American economy, creating a situation in which core industries like retail, which depend on lower-and middle-class buyers, will not have the means to grow.
To better understand this, Stacker looked at the data from the 2019 Federal Reserve Bank of New York's report on income inequality to determine the 15 American metropolitan areas with the most income inequality. For this report, we will be looking at the income disparity between the average income for the top 10% of Americans by income and the bottom 90%, per data from the US Census Bureau's American Community Survey. This may differ in results from the Gini coefficient, which is the standard the Census Bureau uses to measure wealth disparity. The data used in this report is current as of 2017.
Stacker compiled a list of 15 metro areas with the most income inequality, based on data compiled in a 2019 report by the Federal Reserve Bank of New York, using the U.S. Census Bureau's 2015 American Community Survey. The 90/10 ratio is based on how much people make in the 90th percentile of wage earnings versus how much people make in the 10th percentile. Therefore, if the 90/10 ratio is 7, a worker in the 90th percentile earns seven times more than a worker in the 10th percentile. Median household incomes and the percentages of households making more than $75,000 and less than $35,000, respectively, for the year 2017 are included as well.
Wage disparity can be explained in some cases by monolithic economies, such as college towns, where there may be a wide gap between higher-paid educated workers and lower-paid service workers, or by larger communities where there are both highly skilled and low-skilled workers. But pay disparities can also signal bigger infrastructure problems. In some cities, income inequality may be due to economic segregation, out-of-control cost of living, or gentrification. This may reflect an inability or unwillingness—intentional or otherwise—to act proactively toward promoting the needs of the community's poor and disenfranchised.
Keep reading to see if your community made the list.
You may also like: Metro areas with the least income inequality
#15. San Diego, CA
- 90/10 ratio in 2015: 6.5
- Median household income: $71,535
- Households making over $75,000: 47.9%
- Households making less than $35,000: 24.3%
San Diego is the eighth-largest city in the United States and the sister city of Tijuana, Mexico. Due to its natural deep-water harbor, the city is the home of several U.S. Navy, Marine, and Coast Guard bases, as well as many defense contractors including General Atomics and NASSCO. This, coupled with the city’s standing as the home of several wireless cellular companies and biotechnology firms, has created a dichotomy where the city’s highly-skilled, in-demand employees are seeing wage increases that the city’s lower-skilled workers are not.
#14. Washington D.C.
- 90/10 ratio in 2015: 6.6
- Median household income: $77,649
- Households making over $75,000: 51.3%
- Households making less than $35,000: 27.5%
The nation’s capital is unsurprisingly politics-driven, home to thousands of government workers, politicians, and lobbyists. Washington D.C.'s obvious need for government access has attracted some of the country's largest companies, such as Lockheed Martin, Danaher, General Dynamics, Northrop Grumman, and Marriott, to the city and its surrounding area. But Washington D.C. is also a Southern majority-minority city with a predominately Black population. Due to the city being under the auspice of Congress, many of the city’s proposed social initiatives have been stalled or overruled.
#13. Ann Arbor, MI
- 90/10 ratio in 2015: 6.6
- Median household income: $61,247
- Households making over $75,000: 42.9%
- Households making less than $35,000: 30.2%
Michigan's capital city is also home of the University of Michigan, which functions as a city-within-a-city. Ann Arbor is also highly racially and economically segregated: With the city being home to several technology startups, research facilities, and hospitals, the poor have been pushed out in light of increasing rents. This has forced many who cannot afford to live in Ann Arbor to move to surrounding suburbs like Ypsilanti.
#12. Oxnard-Thousand Oaks-Ventura, CA
- 90/10 ratio in 2015: 6.9
- Median household income: $82,857
- Households making over $75,000: 54.6%
- Households making less than $35,000: 19.6%
The Oxnard-Thousand Oaks-Ventura, Calif., Metropolitan Statistical Area—the southernmost portion of the Los Angeles-Long Beach, Calif. Combined Statistical Area—is one of the wealthiest and safest parts of the country. With home values hitting $2 million in some areas, the community has become the preferred address of the Los Angeles wealthy, as well as being the home of San Fernando Valley (which, incidentally, has received the reputation of being the center of the American porn industry).
#11. Odessa, TX
- 90/10 ratio in 2015: 6.9
- Median household income: $61,541
- Households making over $75,000: 41.0%
- Households making less than $35,000: 27.4%
Situated in the West Texas oil fields, Odessa largely centers around the energy industry. While some of the city's largest companies are petroleum refineriess and oilfield supply companies, the city has also diversified into wind and nuclear power. Odessa's location on major rail and road lines also means that it is well-situated to be a logistic center for the region. This means that the city has a glut of both high-skilled and low-skilled jobs available.
#10. Los Angeles, CA
- 90/10 ratio in 2015: 6.9
- Median household income: $54,501
- Households making over $75,000: 37.7%
- Households making less than $35,000: 34.4%
Los Angeles is the second-largest city in the nation by population. Besides being the home of the American movie, music, and television industries, the city has the third-largest gross metropolitan product in the world, behind New York City and Tokyo. Los Angeles is the largest manufacturing center in the western United States, the fifth-busiest port in the world, and home to major transportation, fashion, apparel, telecommunications, financial, and healthcare firms. However, with such a large population, there are many that are left behind. A 2018 study profiling the economic equity of Los Angeles found the city to be #7 in income inequality anywhere in the U.S., with almost one-fifth of residents living below the poverty line.
#9. Tyler, TX
- 90/10 ratio in 2015: 6.9
- Median household income: $46,463
- Households making over $75,000: 28.8%
- Households making less than $35,000: 37.7%
College towns are notorious for high levels of income inequality because the university or college itself is often the town’s largest industry. That creates a situation where the best-paying jobs are with the college or with firms somehow related to the college, while the rest of the town’s workforce is consigned to work in service jobs supporting the university community. This is the case in Tyler, which is the home of the University of Texas-Tyler, the University of Texas Health Center at Tyler, Texas College, and Tyler Junior College.
#8. San Francisco, CA
- 90/10 ratio in 2015: 7.0
- Median household income: $96,265
- Households making over $75,000: 58.4%
- Households making less than $35,000: 23.2%
San Francisco is part of the San Jose-San Francisco Metropolitan Area, colloquially known as Silicon Valley. The name comes from the high concentration of tech companies situated in the region, including Facebook, Google, Apple, Cisco, Intel, Adobe, Tesla, Netflix, Twitter, eBay, PayPal, Square, Visa, and more. This concentration of highly-skilled workers has created a housing crunch in places like San Francisco, which is itself the home of Lyft, Uber, Yelp, Reddit, Gap, Levi Strauss & Co., Dolby, Pinterest, and five of the largest banking institutions in the world.
#7. New York, NY
- 90/10 ratio in 2015: 7.0
- Median household income: $57,782
- Households making over $75,000: 40.2%
- Households making less than $35,000: 33.9%
New York City is home to the nation’s financial industry and serves as a major hub for media and entertainment, fashion, tech and biotech, and international commerce. The Port of New York and New Jersey is the third-largest port in the U.S. and among the world's largest natural harbors. The city also has the largest foreign-born population in the world, as the city remains a traditional first step for immigrants entering the nation from Europe, Africa, and Asia. The city in 2017 enacted a Fair Workweek Law, designed to afford retail and restaurant workers more predictable hours and, therefore, more predictable income. In spite of the legislation, the Center for New York City Affairs found unpredictable scheduling to be more prevalent following the laws than before.
#6. Santa Cruz, CA
- 90/10 ratio in 2015: 7.1
- Median household income: $65,421
- Households making over $75,000: 44.8%
- Households making less than $35,000: 32.4%
Santa Cruz is another college town with high levels of income inequality and poverty. The beach resort city is home to UC Santa Cruz (which awarded 4,863 degrees in 2016) and Cosmo Factory Cosmetology Academy and has become a bedroom community to nearby San Jose.
#5. Bakersfield, CA
- 90/10 ratio in 2015: 7.1
- Median household income: $60,058
- Households making over $75,000: 39.6%
- Households making less than $35,000: 29.6%
Kern County, where Bakersfield is located, is widely considered the oil capital of California. It is the most petroleum-productive and fourth-most agriculturally productive county or county-equivalent in the U.S. This had led the county to be industry-rich, with firms ranging from aerospace to mining to food processing operating in the region, and Bakersfield to represent an economic hub that employes 156,000 people at a wide range of income levels. Bakersfield is also home to the world’s largest ice cream plant.
#4. Houston, TX
- 90/10 ratio in 2015: 7.1
- Median household income: $49,399
- Households making over $75,000: 32.8%
- Households making less than $35,000: 36.7%
Houston has the second-largest port in the nation by total cargo handles and is a major industrial hub for aerospace, medicine, research, aeronautics, manufacturing, and energy. The city has the most racially and ethnically diverse population in the nation, and also one of the fastest-growing rates of income inequality. A 2019 study found that from 2008 to 2017, Houston's income inequality grew by 16.3%—a higher rate than anywhere else in Texas, and 11th in the country.
#3. Trenton, NJ
- 90/10 ratio in 2015: 7.4
- Median household income: $35,524
- Households making over $75,000: 21.5%
- Households making less than $35,000: 49.4%
New Jersey's capital is a Rust Belt manufacturing hub that fell on hard times after the collapse of the national manufacturing core. While, according to our metric, Trenton is the most income unequal community in New Jersey, the city does not break the top 10 based on the U.S. Census Bureau’s Gini Index. The top honor, per that index, goes to Atlantic City.
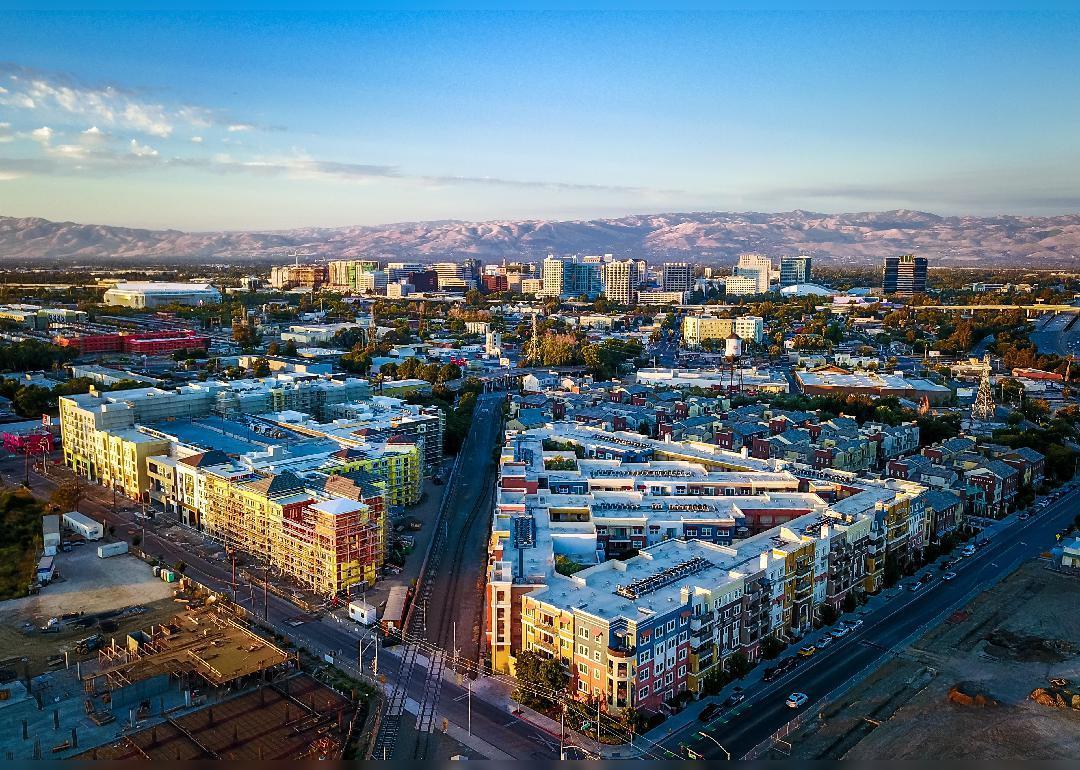
#2. San Jose, CA
- 90/10 ratio in 2015: 7.9
- Median household income: $96,662
- Households making over $75,000: 60.0%
- Households making less than $35,000: 18.1%
San Jose is the largest city in California’s Silicon Valley. The home of Acer, Samsung, Western Digital, Cisco, eBay, Adobe, PayPal, and Hewlett Packard, the city is among the state’s fastest-growing economies. While this has created a trickle-down effect for the city’s service workers, the area’s high cost of living has effectively squeezed out the poor and created a 42% spike in homelessness from 2017 to 2019.
#1. Fairfield, CT
- 90/10 ratio in 2015: 8.7
- Median household income: $89,773
- Households making over $75,000: 56.5%
- Households making less than $35,000: 20.6%
Located on the Gold Coast of Connecticut, Fairfield is a highly affluent community. The home of Fairfield University and Sacred Heart University, the community bears many of the characteristics of a college town. The town is also home to the Bigelow Tea Company and firearms producer Strum, Ruger & Co. Income inequality in Fairfield is represented by 1% of earners making 62.2 times that of the other 99% of the city's population.
You may also like: Metro areas with the least income inequality


