Where America gets its cocoa and 20 other agricultural imports
Where America gets its cocoa and 20 other agricultural imports
Part of the popular American conception and mythology is that the country is the home of the farmer. But while the United States may maintain a robust and diverse network of farmers, many popular American foods are actually imported.
For example, one of the most ubiquitous American foods—the avocado—is primarily imported to the United States from Mexico. And while Hawaii's history as a producer of pineapples may loom in the popular imagination, land and labor prices on the island forced the industry to largely shut down in recent years, as producers could not compete with cheaper production prices abroad.
Examining the global map of where most U.S. food exports come from, production conditions in those export countries vary, and some have been called to task for treating their workers poorly. The primary banana exporter to the United States—Guatemala—has been criticized for paying some of the industry's workers' wages that they can't live on, sometimes as little as $3 per day.
And sometimes international politics can intervene in matters of the plate. China, for example, has been locked in an escalating trade war with the United States, which has the potential to affect everything from tea imports to soybean exports. China also has recently been engaged in a dispute with Canada—the #1 pork and bovine meat exporter to the United States—over the same products, contending that the country's meat products do not pass a safety inspection. This occurred soon after the arrest of a Chinese executive in Vancouver escalated tensions between the two countries.
Stacker has compiled a list of 21 agriculture products and from where they are imported using data by the Census Bureau. Agriculture import totals by country are updated as of 2018. Keep reading to learn about the top U.S. imports of food products, and where they come from.
You may also like: States with the most farmland
Avocados
- U.S. total imports: $2.3 billion
- Top countries imported from:
--- #1. Mexico ($2.1 billion, 88.2% of U.S. imports)
--- #2. Peru ($177.4 million, 7.6%)
--- #3. Chile ($61.8 million, 2.6%)
--- #4. Dominican Republic ($36.7 million, 1.6%)
--- #5. Colombia ($0.6 million, 0%)
Used in everything from guacamole to the ubiquitous avocado toast, avocados are wildly popular in the United States. The primary import country is Mexico, from which the United States gets the vast majority of its avocados. The Michoacán region of Mexico is responsible for about 80% of the country’s avocado exports. When a two-week strike disrupted the country’s avocado pickers and packers in 2018, a 38,000 metric-ton avocado shortfall was reported in the United States.
Bananas
- U.S. total imports: $2.2 billion
- Top countries imported from:
--- #1. Guatemala ($884.2 million, 39.6% of U.S. imports)
--- #2. Costa Rica ($401.7 million, 18%)
--- #3. Ecuador ($304.7 million, 13.6%)
--- #4. Honduras ($226.8 million, 10.2%)
--- #5. Mexico ($197.3 million, 8.8%)
America’s main banana import country, Guatemala, is the third-largest banana exporter in the world, behind Costa Rica and Colombia. According to critics, the country’s high volume of banana exports has come at a cost to local workers, with some banana field workers reported being paid as little as $3 per day.
Bovine meat
- U.S. total imports: $3 billion
- Top countries imported from:
--- #1. Canada ($1.4 billion, 45.2% of U.S. imports)
--- #2. Mexico ($1 billion, 33.3%)
--- #3. Australia ($525.4 million, 17.4%)
--- #4. Nicaragua ($36.8 million, 1.2%)
--- #5. New Zealand ($27.1 million, 0.9%)
The primary exporter of bovine meat to the United States is its northern neighbor, Canada. But not everyone is so enthusiastic about Canadian cow imports. Chinese customs officials recently declared they found residue from a restricted feed additive in a Canadian shipment of pork, prompting China to suspend all meat imports from Canada.
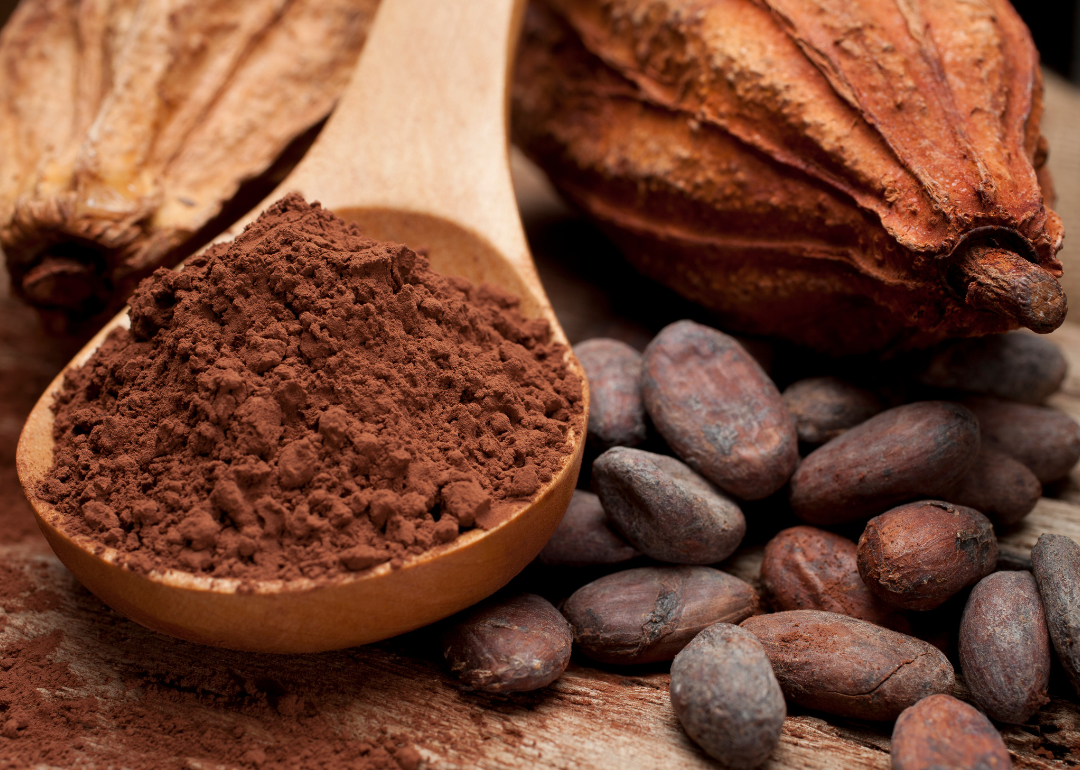
Cocoa beans
- U.S. total imports: $961.2 million
- Top countries imported from:
--- #1. Cote d'Ivoire ($608.1 million, 63.3% of U.S. imports)
--- #2. Ecuador ($123.5 million, 12.8%)
--- #3. Ghana ($115.3 million, 12%)
--- #4. Dominican Republic ($47.1 million, 4.9%)
--- #5. Papua New Guinea ($17.3 million, 1.8%)
Americans import more cocoa from the African nation of Cote d’Ivoire than anywhere else. But as valuable as Americans may find the country’s cocoa, it’s even more valuable within the country’s borders. In Cote d’Ivoire itself, cocoa is reportedly more valuable to the country’s citizens than even gold.
Coconut oil
- U.S. total imports: $1.1 billion
- Top countries imported from:
--- #1. Philippines ($534.6 million, 46.6% of U.S. imports)
--- #2. Indonesia ($432.3 million, 37.7%)
--- #3. Malaysia ($103.5 million, 9%)
--- #4. Singapore ($25.1 million, 2.2%)
--- #5. Sri Lanka ($21.7 million, 1.9%)
A wellness world and natural food staple in the United States, coconut oil is imported primarily from Indonesia and the Philippines. Growers in Indonesia have been hurt in 2018 by a spike in price on desiccated coconut powder, which has cut into their profit margins significantly.
Coffee
- U.S. total imports: $5.6 billion
- Top countries imported from:
--- #1. Colombia ($1.2 billion, 21% of U.S. imports)
--- #2. Brazil ($938.5 million, 16.8%)
--- #3. Canada ($425 million, 7.6%)
--- #4. Vietnam ($395.4 million, 7.1%)
--- #5. Guatemala ($326.3 million, 5.8%)
Colombia accounts for most coffee imports to the United States, and now individuals can get in on the export game along with major producers. Starting in 2016, Colombia began allowing individuals to export small amounts of coffee from the country via international transport or postal companies.
Figs
- U.S. total imports: $44.4 million
- Top countries imported from:
--- #1. Turkey ($35.6 million, 80.2% of U.S. imports)
--- #2. Greece ($2.7 million, 6%)
--- #3. Mexico ($2.1 million, 4.8%)
--- #4. Spain ($1.9 million, 4.3%)
--- #5. Peru ($0.7 million, 1.6%)
The vast majority of U.S. fig imports comes from the Middle Eastern country of Turkey. Despite difficult climate conditions in Turkey for fig production, demand has kept exports high. Fig production is also an important source of income for many in Turkey’s primary fig-growing regions of Aydin and Izmir, where the crop is responsible for at least 45,000 jobs.
Legumes
- U.S. total imports: $237.3 million
- Top countries imported from:
--- #1. Mexico ($107.3 million, 45.2% of U.S. imports)
--- #2. Guatemala ($105.5 million, 44.5%)
--- #3. Peru ($8.9 million, 3.7%)
--- #4. Argentina ($6.2 million, 2.6%)
--- #5. Canada ($5.6 million, 2.4%)
Guatemala provides almost half of America’s legume imports, and the country’s dominance shows no signs of abating. In the first quarter of 2018, legume exports were reported to be up a whopping 23%.
Melons
- U.S. total imports: $769.1 million
- Top countries imported from:
--- #1. Mexico ($403.5 million, 52.5% of U.S. imports)
--- #2. Guatemala ($227.6 million, 29.6%)
--- #3. Honduras ($103.4 million, 13.4%)
--- #4. Costa Rica ($28 million, 3.6%)
--- #5. Brazil ($2.2 million, 0.3%)
Mexico is the #1 melon exporter to the United States, with the majority being watermelons. A drop in production during colder months raises prices in the United States, with the quality of the melons themselves also being linked to the climate conditions under which they are grown.
Nuts, fresh or dried: almonds, hazelnuts, pistachios, etc.
- U.S. total imports: $1.2 billion
- Top countries imported from:
--- #1. Mexico ($720.8 million, 60.5% of U.S. imports)
--- #2. China ($89.4 million, 7.5%)
--- #3. South Africa ($79.4 million, 6.7%)
--- #4. Kenya ($73.3 million, 6.2%)
--- #5. Spain ($73 million, 6.1%)
Although China is the second largest nut exporter to the United States, nut imports are set to decrease. The United States has placed additional import tariffs on almonds, walnuts, and pistachios, accounting for the expected decline.
Pepper
- U.S. total imports: $606.3 million
- Top countries imported from:
--- #1. Vietnam ($174 million, 28.7% of U.S. imports)
--- #2. India ($97 million, 16%)
--- #3. China ($85.8 million, 14.1%)
--- #4. Mexico ($68.6 million, 11.3%)
--- #5. Brazil ($41.4 million, 6.8%)
Vietnam supplies the United States with more pepper than does any other country. However, Vietnamese producers have recently begun sounding the alarm that worldwide pepper supply outstrips demand, and many producers in the country are increasing pepper production, which will provide an even bigger inventory in coming years.
Pig meat
- U.S. total imports: $1.2 billion
- Top countries imported from:
--- #1. Canada ($717.9 million, 57.5% of U.S. imports)
--- #2. Poland ($189.2 million, 15.1%)
--- #3. Denmark ($110.4 million, 8.8%)
--- #4. Mexico ($64.5 million, 5.2%)
--- #5. United Kingdom ($51.3 million, 4.1%)
Canadian bacon and other pork products account for most U.S. pork imports. But all is not well for Canadian pork producers, with China recently deciding to block Canadian pork imports. The move set off a global chain reaction in pork trading, and has rocked Canadian producers, who are unsure if they will make up the loss of business elsewhere.
Pineapples
- U.S. total imports: $622.6 million
- Top countries imported from:
--- #1. Costa Rica ($537.3 million, 86.3% of U.S. imports)
--- #2. Mexico ($32.6 million, 5.2%)
--- #3. Honduras ($29.2 million, 4.7%)
--- #4. Guatemala ($9.1 million, 1.5%)
--- #5. Thailand ($7.1 million, 1.1%)
The United States imports the vast majority of its pineapples from Costa Rica, but pineapples weren’t always an international affair for our country. As recently as 1991, the state of Hawaii provided almost half the pineapples in U.S. markets. But the decline of the pineapple industry on the island because of competition from lower-priced land and labor abroad has shifted the supply, with Costa Rica now providing most Americans with their pineapples.
Pure olive oil
- U.S. total imports: $1.5 billion
- Top countries imported from:
--- #1. Italy ($537.4 million, 36.3% of U.S. imports)
--- #2. Spain ($503.8 million, 34%)
--- #3. Tunisia ($180.3 million, 12.2%)
--- #4. Turkey ($102.3 million, 6.9%)
--- #5. Greece ($50.7 million, 3.4%)
Business is booming in olive oil exports from Italy to the United States. But industry experts warn that political and policy developments could imperil the relationship, with proposed tariffs threatening to cut exports by nearly half, and raise prices on the remaining imports.
Raw sugar
- U.S. total imports: $1.6 billion
- Top countries imported from:
--- #1. Mexico ($657.5 million, 41.2% of U.S. imports)
--- #2. Brazil ($198.2 million, 12.4%)
--- #3. Guatemala ($126.4 million, 7.9%)
--- #4. Dominican Republic ($99.1 million, 6.2%)
--- #5. Colombia ($86.1 million, 5.4%)
The United States gets most of its sugar from Mexico, making particularly important a recent bilateral sugar trade agreement both countries signed. The agreement came after what the CEO of one major sugar producer called "a decade of traumatic trade" in sugar between the two countries—which both sides now say the agreement has helped smooth over.
Rice
- U.S. total imports: $903.4 million
- Top countries imported from:
--- #1. Thailand ($540.2 million, 59.8% of U.S. imports)
--- #2. India ($210.2 million, 23.3%)
--- #3. Pakistan ($31.5 million, 3.5%)
--- #4. China ($28.8 million, 3.2%)
--- #5. Brazil ($22.4 million, 2.5%)
America’s receives its largest amount of rice from Thailand, the second-largest rice producer globally. Thailand aims to export 9.5 million tons of rice in 2019. The country is battling competition from Vietnam and India, both of which are trying to increase their own rice production.
Sheep and goat meat
- U.S. total imports: $1 billion
- Top countries imported from:
--- #1. Australia ($709.3 million, 70.5% of U.S. imports)
--- #2. New Zealand ($285.6 million, 28.4%)
--- #3. Chile ($3.5 million, 0.3%)
--- #4. Iceland ($3.3 million, 0.3%)
--- #5. Mexico ($2.3 million, 0.2%)
Australia may dominate the supply of sheep and goat meat in the United States, but challenging conditions in Australia imperil the industry. Dry climate conditions have thinned the supply available for export, which led to a 29% global export decline in 2018 from the preceding year.
Soybeans
- U.S. total imports: $318 million
- Top countries imported from:
--- #1. Canada ($86.2 million, 27.1% of U.S. imports)
--- #2. India ($77.4 million, 24.4%)
--- #3. Kazakhstan ($44.7 million, 14%)
--- #4. Argentina ($34.6 million, 10.9%)
--- #5. Ukraine ($27.7 million, 8.7%)
Canada and India may supply most American soybeans, but the country has stiff competition from domestic soy production in the American heartland. American producers have typically supplied China with many of their crops, but an escalating trade war between the United States and China has resulted in a new market opportunity for India with China.
Spices: ginger, saffron, turmeric, etc.
- U.S. total imports: $282.5 million
- Top countries imported from:
--- #1. China ($74.1 million, 26.2% of U.S. imports)
--- #2. India ($49.5 million, 17.5%)
--- #3. Turkey ($23.6 million, 8.4%)
--- #4. Spain ($21.7 million, 7.7%)
--- #5. Peru ($20.4 million, 7.2%)
China supplies the United States with more spices than any other country. Indeed, the high-end health food emporium Whole Foods doesn’t stock much inventory from China, but some of the only items that it does import from the country are spices, including garlic powder, ginger, cayenne, and cinnamon.
Tea
- U.S. total imports: $466.9 million
- Top countries imported from:
--- #1. China ($90 million, 19.3% of U.S. imports)
--- #2. Argentina ($66.8 million, 14.3%)
--- #3. Japan ($62 million, 13.3%)
--- #4. India ($49.3 million, 10.5%)
--- #5. Sri Lanka ($41.4 million, 8.9%)
China supplies Americans with more tea than any other country and is also the world's number #1 tea exporter by value. The country exports about $1.6 billion worth of tea a year, with the United States receiving about 6% of China's export supply.
Vanilla beans
- U.S. total imports: $622.4 million
- Top countries imported from:
--- #1. Madagascar ($519.8 million, 83.5% of U.S. imports)
--- #2. Indonesia ($62.3 million, 10%)
--- #3. India ($19.4 million, 3.1%)
--- #4. Uganda ($9.8 million, 1.6%)
--- #5. Papua New Guinea ($8.1 million, 1.3%)
The climate in Madagascar is perfectly conducive to vanilla bean production, which has resulted in the country’s dominance in vanilla bean production and export. The bean is considered a luxury crop and reached peak prices in 2017 of $635 per kilo.
You may also like: States with the most farmland


