Where America sends its corn and 20 other agricultural exports
Where America sends its corn and 20 other agricultural exports
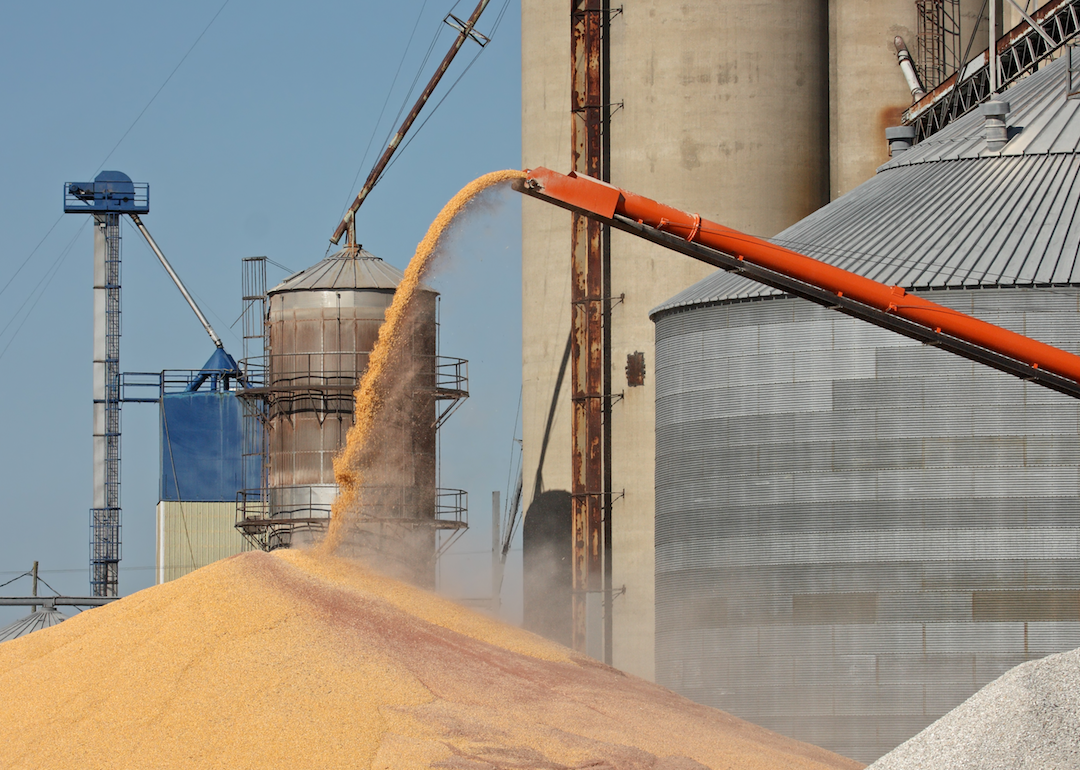
America is classically imagined as a land of farmers, dating back to the founding father Thomas Jefferson's evocation of the "yeoman farmer" growing productive crops across America's landscape.
And while some of these crops stay right at home in the U.S., feeding Americans in home kitchens, supermarkets, and restaurants across the country, another major source of revenue for American farmers is in exports. Countries around the world rely on American farmers and crops to fill the agricultural gaps in their own countries, counting on American topography and specialization to import food and material that they cannot as easily produce in their own countries. The U.S. expected to export $137 billion in agriculture exports in 2019.
Some American exports are unsurprising to anyone with a passing knowledge of the agricultural landscape here. Wheat, corn, and cattle are all major players in the U.S. agricultural industry and have major lobbies in Washington D.C. by which they work to ensure open markets for goods abroad.
Other crops that feature prominently in American exports may be less classically American but no less important. Among these are sunflower seeds, which have found a significant market from America to Ukraine, and cherries, of which South Korea is the largest buyer. Others are less surprising when you consider the form in which they leave the country: Many American peanut exports, for example, are actually peanut butter.
Political developments have an enormous impact on the health of various crop exports to different countries. Recent trade disputes with China, for example, have put a damper on some American exports to the country; in some cases, losses in the Chinese market have been compensated for by other Asian buyers, primarily Japan and South Korea.
Stacker compiled a gallery of 21 agriculture exports using data from the U.S. Census Bureau. Total exports and country totals are from 2018. Click through to see 21 American crop exports and their top destination countries.
You may also like: 50 fascinating facts about farming in America
Apples, fresh
- U.S. total exports: $1 billion
- Top countries exported to:
--- #1. Mexico ($283.9 million, 27.9% of U.S. exports)
--- #2. Canada ($164 million, 16.1%)
--- #3. India ($158.1 million, 15.6%)
--- #4. Taiwan ($58.8 million, 5.8%)
--- #5. Vietnam ($51.1 million, 5%)
They say there’s nothing as American as apple pie. So it’s no surprise the country exports $1 billion dollars of apples per year. Recent tariff pullbacks in Mexico have come as a welcome move to the U.S. apple industry, which faced the possibility that tariffs would imperil business in Mexico.
Beef, fresh or chilled
- U.S. total exports: $3.7 billion
- Top countries exported to:
--- #1. Japan ($1.2 billion, 32.4% of U.S. exports)
--- #2. Mexico ($744.7 million, 20.2%)
--- #3. Canada ($528.5 million, 14.3%)
--- #4. Korea, South ($525.1 million, 14.2%)
--- #5. Taiwan ($302.6 million, 8.2%)
Japan is the #1 one destination for exported American beef, and that designation is only set to grow. The country recently ended a longstanding prohibition on the import of some American beef, namely that of beef over 30 months old. The prior ban, begun in 2005, was enacted to prevent mad cow disease.
Beef, frozen
- U.S. total exports: $3.6 billion
- Top countries exported to:
--- #1. Korea, South ($1.1 billion, 31.8% of U.S. exports)
--- #2. Hong Kong ($819.8 million, 22.8%)
--- #3. Japan ($559.1 million, 15.6%)
--- #4. Taiwan ($249.4 million, 6.9%)
--- #5. Mexico ($88.3 million, 2.5%)
South Korea’s role as the United States’ top frozen beef buyer has little to do with America’s escalating trade tensions with China. Instead, a free-trade agreement, in which South Korea began phasing out tariffs on beef imports, has helped the industry skyrocket in the years since the agreement was initiated in 2012.
Birds' eggs, in shell
- U.S. total exports: $457.3 million
- Top countries exported to:
--- #1. Mexico ($153.1 million, 33.5% of U.S. exports)
--- #2. Canada ($106.2 million, 23.2%)
--- #3. Hong Kong ($43.3 million, 9.5%)
--- #4. Brazil ($29.2 million, 6.4%)
--- #5. Jamaica ($25.8 million, 5.6%)
Brazil and the U.S. are the two leading poultry export nations in the world. Egg exports have surged in recent years, reaching double-digit growth in many year-over-year reports.
Cheese and curd
- U.S. total exports: $1.5 billion
- Top countries exported to:
--- #1. Mexico ($387.8 million, 26.4% of U.S. exports)
--- #2. Korea, South ($220.4 million, 15%)
--- #3. Japan ($151.2 million, 10.3%)
--- #4. Australia ($90.9 million, 6.2%)
--- #5. China ($56.9 million, 3.9%)
With Mexico positioned as the biggest client for American cheese, any tariffs threatened as part of a trade war could have a devastating effect on the industry. Indeed, cheese producers are concerned that escalating trade tensions may induce Mexico to impose tariffs, threatening a major market.
Cherries, fresh, nesoi
- U.S. total exports: $500.5 million
- Top countries exported to:
--- #1. Korea, South ($126.6 million, 25.3% of U.S. exports)
--- #2. Canada ($120.8 million, 24.1%)
--- #3. China ($81.8 million, 16.4%)
--- #4. Taiwan ($49.5 million, 9.9%)
--- #5. Hong Kong ($35.1 million, 7%)
As China and the U.S. have grown increasingly hostile with one another over trade agreements, the American cherry industry has shifted its focus to exports to other Asian nations.The results of that are already being seen: In 2017, cherries accounted for more than half of the $226 million in U.S. exports of fresh fruit to mainland china. By 2018, that number was well below $100 million.
Corn (maize)
- U.S. total exports: $12.9 billion
- Top countries exported to:
--- #1. Mexico ($3.1 billion, 24.1% of U.S. exports)
--- #2. Japan ($2.8 billion, 21.8%)
--- #3. Korea, South ($1.4 billion, 10.6%)
--- #4. Colombia ($930.2 million, 7.2%)
--- #5. Taiwan ($606.8 million, 4.7%)
Recent trade disagreements between the U.S. and Mexico have reached such a pitch that other countries have been speculating on how to fill a prospective gap. Argentina, for one, has said it is prepared to step in to send more corn to Mexico should political strife cause a shortfall.
Cotton, including yarn and woven fabric thereof
- U.S. total exports: $8.4 billion
- Top countries exported to:
--- #1. Vietnam ($1.3 billion, 16% of U.S. exports)
--- #2. China ($948.7 million, 11.3%)
--- #3. Mexico ($788.8 million, 9.4%)
--- #4. Turkey ($684.4 million, 8.2%)
--- #5. Honduras ($622.1 million, 7.4%)
American cotton exports have fallen overall, but not in Vietnam. Foreign direct investment in the southeast Asian nation has boosted cotton import and consumption to a record level—a boon for the industry in America.
Grain sorghum
- U.S. total exports: $815.6 million
- Top countries exported to:
--- #1. China ($521.3 million, 63.9% of U.S. exports)
--- #2. Japan ($68.1 million, 8.3%)
--- #3. Mexico ($61.6 million, 7.6%)
--- #4. Spain ($55.9 million, 6.9%)
--- #5. Sudan ($31.9 million, 3.9%)
China is by far the largest consumer of American grain sorghum, a feed used for livestock. As such an important market, people in the industry has been concerned by tariff prices on imports, which have fluctuated significantly in recent years.
Grapes, fresh or dried
- U.S. total exports: $1.2 billion
- Top countries exported to:
--- #1. Canada ($358.2 million, 29.6% of U.S. exports)
--- #2. Japan ($129.5 million, 10.7%)
--- #3. Mexico ($110.6 million, 9.2%)
--- #4. Korea, South ($59.8 million, 4.9%)
--- #5. Taiwan ($53.9 million, 4.5%)
The U.S. is the third-largest exporter of grapes in the world, with exported grape value climbing by almost 2.3% between 2017 and 2018. Grapes are the most valuable U.S. fruit, with a total value of around $6 billion annually.
Live trees, plants, bulbs etc.; cut flowers etc.
- U.S. total exports: $460.2 million
- Top countries exported to:
--- #1. Canada ($232.4 million, 50.5% of U.S. exports)
--- #2. Mexico ($76 million, 16.5%)
--- #3. Netherlands ($57.7 million, 12.5%)
--- #4. Peru ($19.6 million, 4.3%)
--- #5. Bahamas ($8.5 million, 1.8%)
Canada may be the #1 destination for American trees, but that statistic hides a surprising fact. Canada actually exports one of the most popular trees in the world: the Christmas tree. What does it import in return? None other than fake Christmas trees.
Milk and cream, not concentrated or sweetened
- U.S. total exports: $107.6 million
- Top countries exported to:
--- #1. Taiwan ($32.6 million, 30.3% of U.S. exports)
--- #2. Mexico ($25.5 million, 23.7%)
--- #3. Canada ($21.1 million, 19.6%)
--- #4. Dominican Republic ($6.2 million, 5.8%)
--- #5. United Arab Emirates ($3.8 million, 3.5%)
The increase in milk exports to Taiwan has accounted for a significant percentage of the increase in American milk shipments globally, up 9% in 2018 alone. Sales to the Caribbean also rose that year, while exports to Canada slumped by 2%.
Peanuts (ground-nuts), raw
- U.S. total exports: $454.1 million
- Top countries exported to:
--- #1. Mexico ($112 million, 24.7% of U.S. exports)
--- #2. Canada ($109.1 million, 24%)
--- #3. Netherlands ($70.7 million, 15.6%)
--- #4. China ($38.3 million, 8.4%)
--- #5. Japan ($25.1 million, 5.5%)
The format many of the nuts being sent to Mexico couldn’t be more American: Many of the exports take the form of peanut butter. In 2016–2017, the U.S. exported no less than 1,889 metric tons to Mexico.
Pork
- U.S. total exports: $4.6 billion
- Top countries exported to:
--- #1. Japan ($1.5 billion, 33.4% of U.S. exports)
--- #2. Mexico ($1 billion, 22%)
--- #3. Korea, South ($595.3 million, 12.9%)
--- #4. Canada ($339.8 million, 7.4%)
--- #5. Colombia ($200.2 million, 4.4%)
Japan is set to become an even more welcoming destination for American pork. August 2019 trade agreements have dropped a 38.5% tariff on American pork, meaning even more pork producers will have an incentive to sell their goods in Japan.
Raw hides & skins of bovine or equine animals
- U.S. total exports: $1.1 billion
- Top countries exported to:
--- #1. China ($585.7 million, 53% of U.S. exports)
--- #2. Korea, South ($191.4 million, 17.3%)
--- #3. Mexico ($120 million, 10.9%)
--- #4. Thailand ($97.9 million, 8.9%)
--- #5. Taiwan ($23.6 million, 2.1%)
Recent political developments may imperil trade between China and the U.S., casting uncertainty over China's role as the #1 importer of U.S. raw animal hides exports. The escalating trade dispute between the two countries has included hides of animals as part of hiked tariffs on various American animal product imports.
Rice
- U.S. total exports: $1.7 billion
- Top countries exported to:
--- #1. Mexico ($268.2 million, 15.9% of U.S. exports)
--- #2. Japan ($232.1 million, 13.7%)
--- #3. Haiti ($206.5 million, 12.2%)
--- #4. Canada ($183.3 million, 10.8%)
--- #5. Korea, South ($88.9 million, 5.3%)
Per capita consumption of rice in Mexico is a whopping 16 pounds per person, making it no surprise that the country is the top destination for American rice. While the population in Mexico has climbed by 22% in the last 15 years, rice consumption ballooned by 43%.
Soybean oil & its fractions, not chemically modified
- U.S. total exports: $874.5 million
- Top countries exported to:
--- #1. Korea, South ($209.2 million, 23.9% of U.S. exports)
--- #2. Mexico ($127.8 million, 14.6%)
--- #3. Dominican Republic ($107 million, 12.2%)
--- #4. Colombia ($100 million, 11.4%)
--- #5. Peru ($69.6 million, 8%)
American soybean oil exports to South Korea have steadily grown in recent years. Between 2015 and 2016 alone, the share of soybean oil in South Korea coming from the United States jumped from 23% to 45%.
Soybeans
- U.S. total exports: $17.2 billion
- Top countries exported to:
--- #1. China ($3.1 billion, 18.2% of U.S. exports)
--- #2. Mexico ($1.8 billion, 10.7%)
--- #3. Netherlands ($1.3 billion, 7.4%)
--- #4. Egypt ($1.2 billion, 6.8%)
--- #5. Indonesia ($1 billion, 5.9%)
Recent trade disputes imperiled Chinese dominance in the American soybean export market. As Chinese tariffs have hit soybean farmers hard, they are increasingly looking to alternative and emerging markets, from Egypt to Pakistan.
Sunflower seeds
- U.S. total exports: $382.3 million
- Top countries exported to:
--- #1. Ukraine ($102.1 million, 26.7% of U.S. exports)
--- #2. Austria ($87.9 million, 23%)
--- #3. France ($43.2 million, 11.3%)
--- #4. Russia ($38 million, 9.9%)
--- #5. Spain ($26.4 million, 6.9%)
Ukraine is the top destination for American sunflower seeds. A steady rise in demand over the past decade has been a boon for the farmers of sunflower crops, and the higher price of sunflower seeds compared to other crops has helped their profit margins.
Tobacco, unmanufactured
- U.S. total exports: $1.1 billion
- Top countries exported to:
--- #1. Switzerland ($233.6 million, 21.9% of U.S. exports)
--- #2. China ($157.9 million, 14.8%)
--- #3. Dominican Republic ($94.8 million, 8.9%)
--- #4. Mexico ($91.4 million, 8.6%)
--- #5. Indonesia ($71.3 million, 6.7%)
Switzerland may be the top destination for American tobacco, but this is far from a sign of the Swiss lighting up. Instead, Swiss cigarette production companies are focusing on Africa as a market for their goods, and exporting mass quantities of cigarettes made with the raw imported American tobacco.
Wheat and meslin
- U.S. total exports: $5.5 billion
- Top countries exported to:
--- #1. Japan ($718.8 million, 13.2% of U.S. exports)
--- #2. Mexico ($662.7 million, 12.1%)
--- #3. Philippines ($642.7 million, 11.8%)
--- #4. Korea, South ($367.6 million, 6.7%)
--- #5. Taiwan ($268.5 million, 4.9%)
Japan has stepped up to fill the gap in American wheat exports left by Chinese tariffs on American grains, including wheat. Japanese imports of American wheat increased by double-digits in recent years.
You may also like: 50 fascinating facts about farming in America


