Here are the most common times for fatal car accidents
Despite significant drops in traffic during the first years of the COVID-19 pandemic, the number of motor vehicle fatalities in the U.S. did not decrease.
In 2020, 38,824 people died in traffic incidents: a nearly 7% increase over 2019. It was also the highest number of vehicular deaths since 2007.
This figure becomes even more sobering when you consider that the overall number of reported crashes actually fell by 22% during the same time period. In other words, fewer car accidents were more deadly with a higher percentage of crashes resulting in at least one death. The National Highway Traffic Safety Administration estimates that nearly half of all fatal crashes in 2020 were the result of one of several common denominators: excess speed, impaired driving, or failure to use a safety belt.
Staver Injury Law Firm collected data from the National Highway Traffic Safety Administration’s 2020 Fatality Analysis Reporting System to determine when a fatal car crash most commonly occurs on each day of the week. To be included in the data, the collision had to take place within the United States (including Washington D.C. and Puerto Rico); must have occurred on a roadway open to the public; and had a fatality related to it within 30 days of the incident, as fatal car accidents do not always cause death on impact.
Like many federal agencies, NHTSA’s statistical reporting on various traffic and road safety-related numbers is not released until up to 12 months after the end of a reporting period (which is typically annually or biannually). Therefore, the agency’s May 17, 2022, preliminary estimate of 2021 traffic fatality numbers is not included in this data analysis. This preliminary report estimates that 42,915 people died in traffic collisions last year, an increase of more than 10% since 2020.
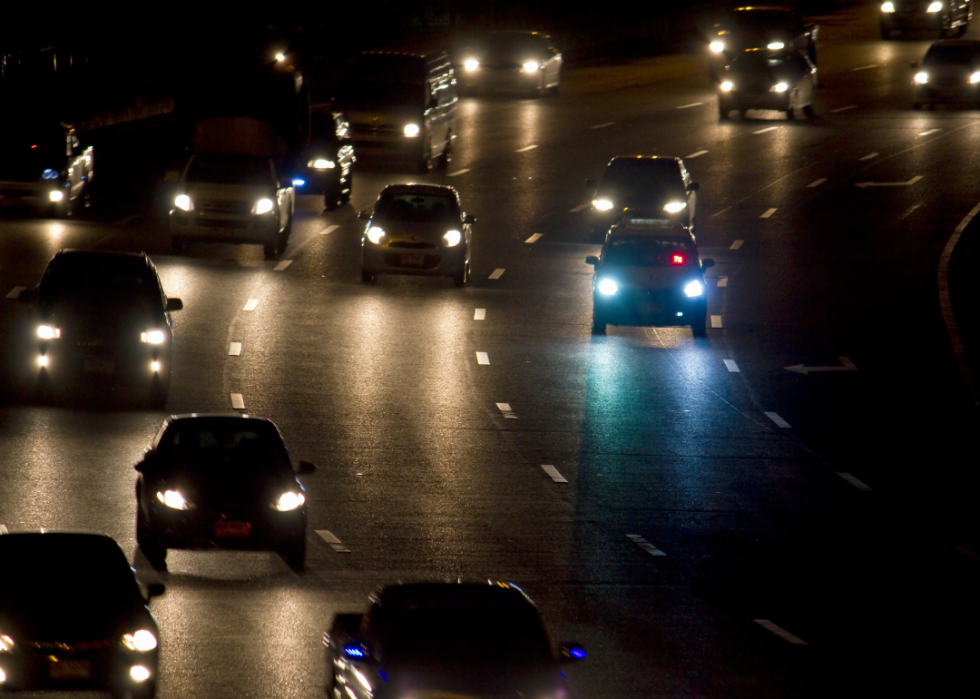
One factor not often taken into account when looking into traffic deaths is the time of day in which they occur. Many might assume nighttime driving is more deadly due to lower visibility and an increased likelihood of sleep-deprived, distracted, or drunk driving. But data reveals that this is not always the case; a more significant risk factor can be the day of the week on which an incident occurs.