Stacker Studio

History of the housing market over the last 50 years

Written by:
October 23, 2020
H. Armstrong Roberts/ClassicStock // Getty Images

This story originally appeared on The Simple Dollar and was produced and distributed in partnership with Stacker Studio.

History of the housing market over the past 50 years

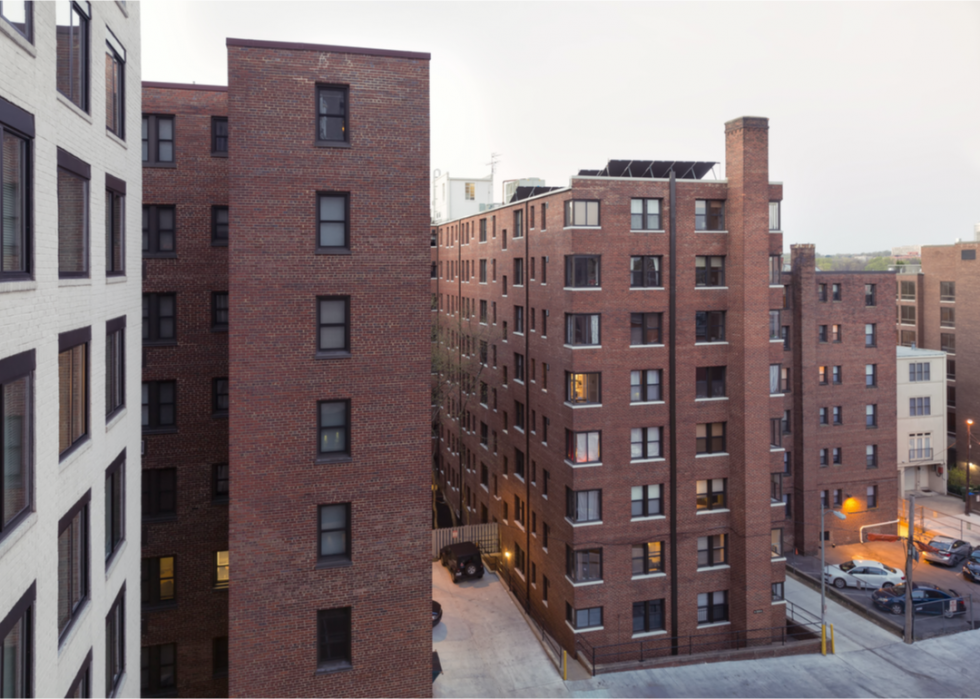
Stay-at-home orders during the pandemic have forced many people to rethink their living situation. Small apartments have stopped being cozy and are feeling more like claustrophobic places to quarantine for months on end, driving some 22% of U.S. adults to relocate, or at least know someone else who has, according to the Pew Research Center. 

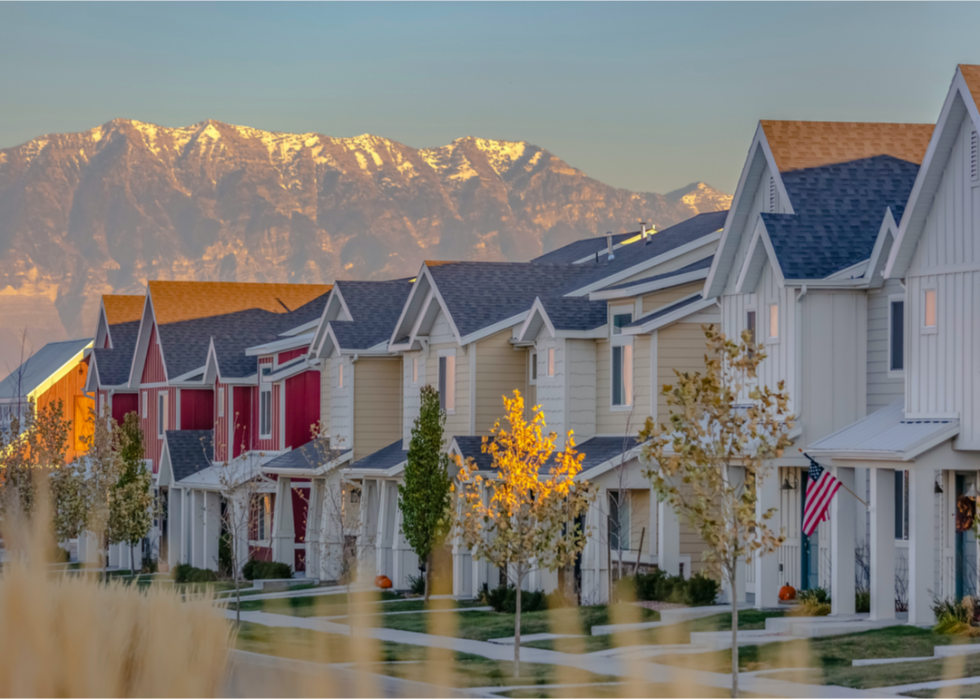
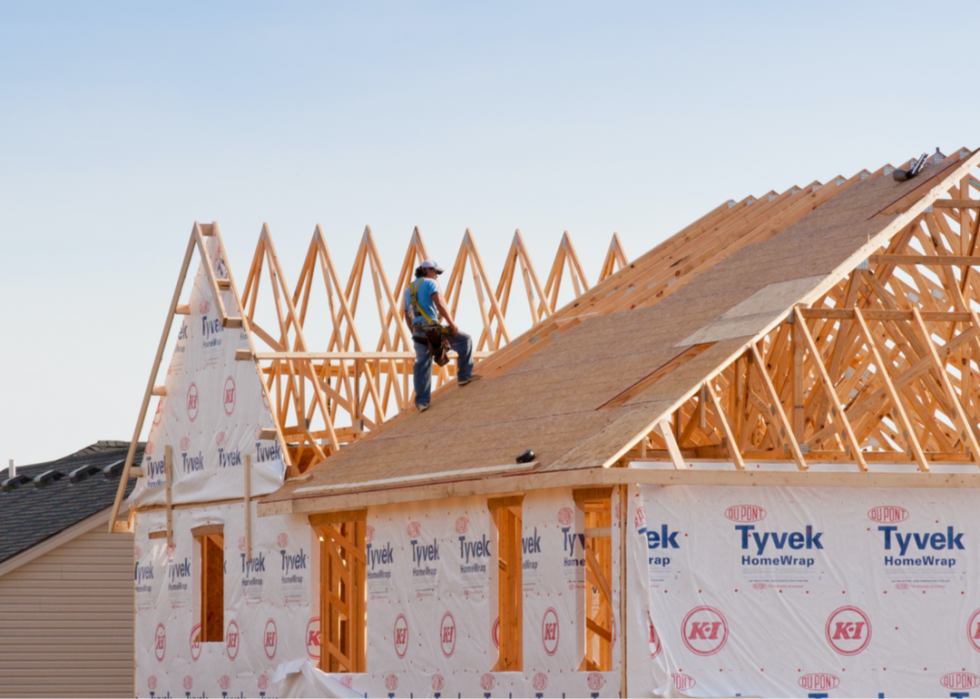
What’s more, the COVID-19 crisis made many people realize they wanted more control over the place they lived—so larger numbers of Americans pursued homeownership. Data from the Census Bureau shows that the homeownership rate climbed to 67.9% in the second quarter of 2020, a whopping 4 percentage-point boost from where things stood a year earlier. The rates of homeownership in the United States are now poised to rival what was seen before the subprime mortgage crisis of 2007.

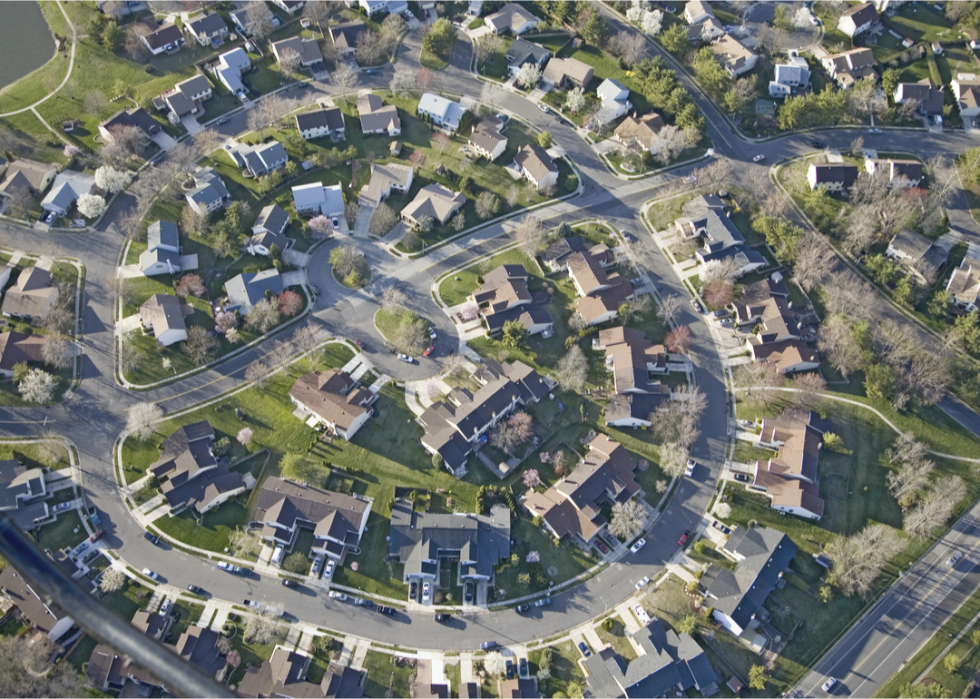
The uncertain circumstances created by the pandemic mean that no one can predict for sure how real estate trends will look for the rest of this year and the subsequent decade. However, taking a look at what the housing market has done over the past 50 years can give potential homebuyers a deeper understanding of what may come. So, The Simple Dollar compiled historical housing data from the Federal Reserve Economic Data (FRED) that included housing sales price, housing starts, homeownership rates, and housing price-to-rent ratio, and inflation adjustments from the Federal Reserve Bank of Minneapolis. 

The Simple Dollar also looked at news reports, academic papers, government documents, and real estate trade publications to gain a deeper analysis of what happened in the U.S. housing market every year since 1971—from the creation of subsidized housing programs and fair mortgage lending practices to the financial crisis and the recovery over the next decade.

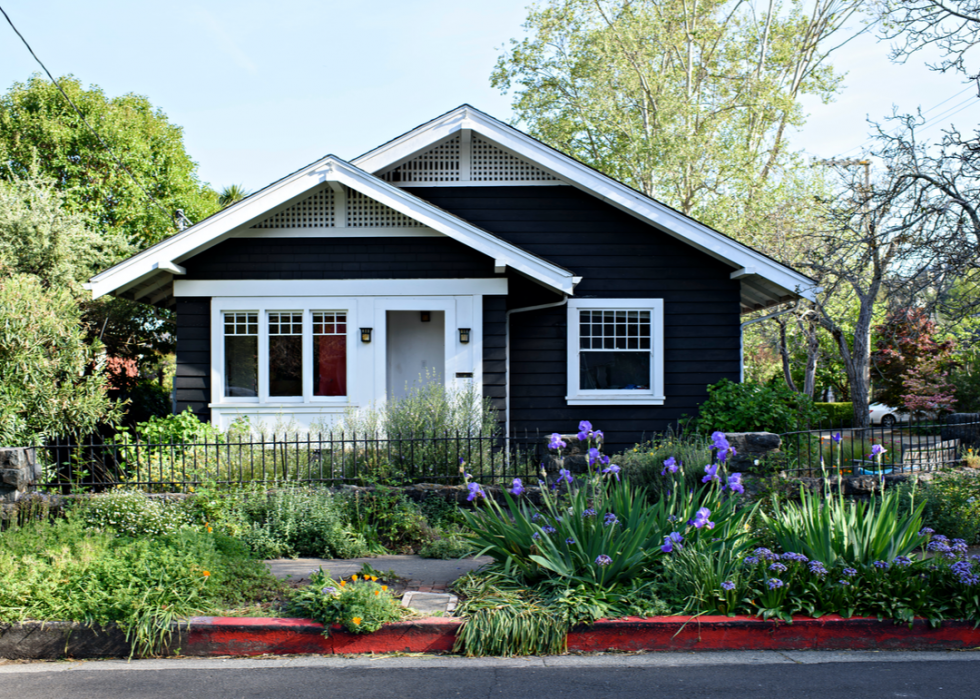
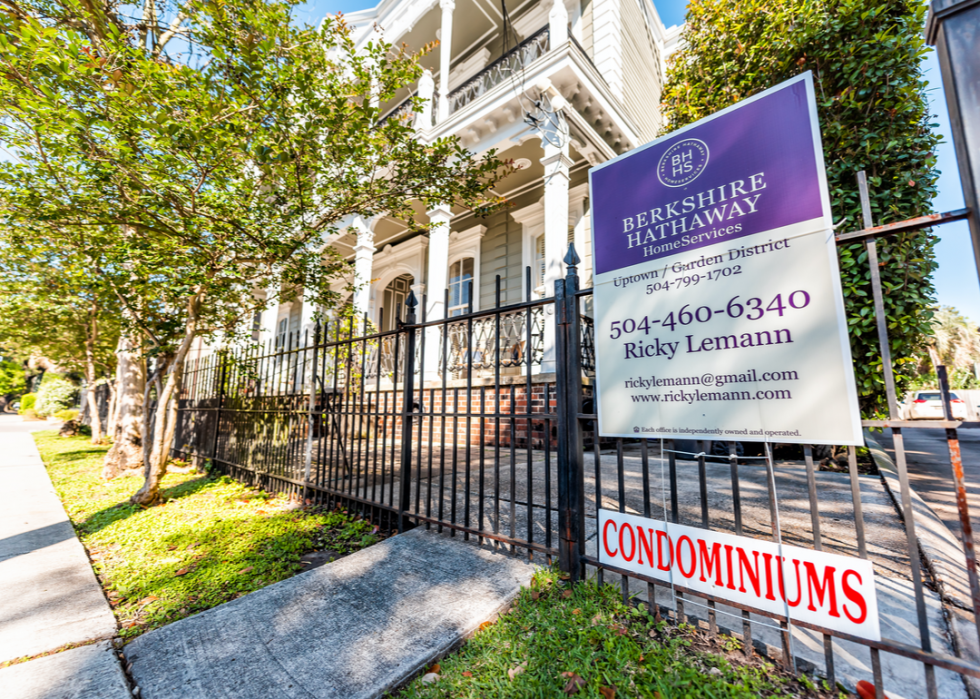
Thinking of buying your first home and ditching the renter life for good? Click through to learn more about how real estate, mortgages, and homeownership have changed throughout the last five decades.


1 / 50
Bill Peters/The Denver Post // Getty Images

1971

- Inflation-adjusted average home sales price: $177,412 (+1% compared to previous year)
- Housing starts: 2 million units (+41.9% compared to previous year)
- Homeownership rate: 64.3%
- Housing price-to-rent ratio: not available

Freddie Mac began keeping track of 30-year fixed-rate mortgage rates in 1971. The data would help give policymakers, economists, and everyday Americans a deeper understanding of the housing market.

2 / 50
H. Armstrong Roberts/ClassicStock // Getty Images

1972

- Inflation-adjusted average home sales price: $183,976 (+3.7% compared to previous year)
- Housing starts: 2.4 million units (+16% compared to previous year)
- Homeownership rate: 64.4%
- Housing price-to-rent ratio: not available

The year 1972 was a record for housing starts—an economic indicator that tracks the start of construction on new privately owned homes. Construction began on some 2.4 million homes that year, according to the Federal Reserve Bank of St. Louis.

3 / 50
R. Krubner/ClassicStock // Getty Images

1973

- Inflation-adjusted average home sales price: $202,141 (+9.9% compared to previous year)
- Housing starts: 2 million units (-13.4% compared to previous year)
- Homeownership rate: 64.5%
- Housing price-to-rent ratio: not available

President Richard Nixon announced a temporary end to approvals of subsidized housing programs beginning in January 1973. The moratorium lasted until mid-1974.

4 / 50
Camerique/ClassicStock // Getty Images

1974

- Inflation-adjusted average home sales price: $200,852 (-0.6% compared to previous year)
- Housing starts: 1.3 million units (-34.8% compared to previous year)
- Homeownership rate: 64.7%
- Housing price-to-rent ratio: not available

Congress passed the Equal Credit Opportunity Act in 1974, which helped open up home financing opportunities to more people. The law prevents creditors from discriminating against potential borrowers based on protected qualities such as their race, religion, sex, age, or marital status.

5 / 50
R. Krubner/ClassicStock // Getty Images

1975

- Inflation-adjusted average home sales price: $202,112 (+0.6% compared to previous year)
- Housing starts: 1.2 million units (-12.9% compared to previous year)
- Homeownership rate: 64.6%
- Housing price-to-rent ratio: 1.05x

The Emergency Homeowners’ Relief Act of 1975 allowed Housing and Urban Development to make mortgage relief payments for homeowners experiencing financial distress. It was aimed at fending off widespread mortgage defaults during an adverse time in the economy.


6 / 50
H. Abernathy/ClassicStock // Getty Images

1976

- Inflation-adjusted average home sales price: $215,929 (+6.8% compared to previous year)
- Housing starts: 1.5 million units (+32.4% compared to previous year)
- Homeownership rate: 64.7%
- Housing price-to-rent ratio: 1.07x

The early 1970s battered the residential construction industry in the United States, according to The New York Times. Things began turning around between 1975 and 1976, though, putting housing starts on the upswing through 1978, according to data from the Federal Reserve Bank of St. Louis.

7 / 50
Joe Sohm/Visions of America/Universal Images Group // Getty Images

1977

- Inflation-adjusted average home sales price: $229,328 (+6.2% compared to previous year)
- Housing starts: 2 million units (+27.8% compared to previous year)
- Homeownership rate: 64.8%
- Housing price-to-rent ratio: 1.13x

Congress enacted the Community Reinvestment Act in 1977. The law required the Federal Reserve and financial regulators to encourage banks and lenders to “meet the credit needs of the communities in which they do business, including low- and moderate-income neighborhoods.” It effectively helped ban “redlining,” a practice of refusing to extend mortgages in certain neighborhoods, usually places with low-income communities or large numbers of people of color.

8 / 50
H. Armstrong Roberts/ClassicStock // Getty Images

1978

- Inflation-adjusted average home sales price: $245,896 (+7.2% compared to previous year)
- Housing starts: 2 million units (+2% compared to previous year)
- Homeownership rate: 65%
- Housing price-to-rent ratio: 1.21x

In 1978, the federal government banned the use of lead paint for consumer use in homes due to health hazards it presented. Federal law now requires people selling homes built before 1978 to provide buyers with information about the presence of lead paint on the property.

9 / 50
Joel W. Rogers/Corbis // Getty Images

1979

- Inflation-adjusted average home sales price: $253,235 (+3% compared to previous year)
- Housing starts: 1.7 million units (-14.2% compared to previous year)
- Homeownership rate: 65.2%
- Housing price-to-rent ratio: 1.28x

The federal government ended its Experimental Housing Allowance Program in 1979. Since 1973, it had provided millions in cash assistance to thousands of families in 12 cities across the United States to help them cover market-rate housing, instead of relying on the construction of new public housing projects. 


10 / 50
H. Armstrong Roberts/ClassicStock // Getty Images

1980

- Inflation-adjusted average home sales price: $237,003 (-6.4% compared to previous year)
- Housing starts: 1.3 million units (-24.3% compared to previous year)
- Homeownership rate: 65.6%
- Housing price-to-rent ratio: 1.27x

Mortgage rates hit an all-time high in 1981 after the Federal Reserve increased the federal funds rate. That year, the highest rate on a 30-year fixed-rate mortgage was 18.63%, according to data from Freddie Mac’s Primary Mortgage Market Survey.


11 / 50
L Barnwell // Shutterstock

1981

- Inflation-adjusted average home sales price: $233,970 (-1.3% compared to previous year)
- Housing starts: 1.1 million units (-15.7% compared to previous year)
- Homeownership rate: 65.4%
- Housing price-to-rent ratio: 1.23x

The early 1980s marked the beginning of a shift from homeownership to renting among Americans between the 20–34 and 35–64. However, statistics from the U.S. Census and the American Community Survey show that this time period would include a rise in the rates of homeownership among people age 65 and up—a trend that would largely continue through 2017.

12 / 50
Barbara Alper // Getty Images

1982

- Inflation-adjusted average home sales price: $222,181 (-5% compared to previous year)
- Housing starts: 1.1 million units (-3.6% compared to previous year)
- Homeownership rate: 64.8%
- Housing price-to-rent ratio: 1.18x

In 1982, sales of existing homes dropped to their lowest point in the 20-year period from 1976 to 1996, according to data from the National Association of Realtors. The decline in sales was largely driven by sky-high mortgage rates of 17%–18% around that time, according to Mark J. Perry of the American Enterprise Institute.

13 / 50
Bill Nation/Sygma // Getty Images

1983

- Inflation-adjusted average home sales price: $230,477 (+3.7% compared to previous year)
- Housing starts: 1.7 million units (+61.3% compared to previous year)
- Homeownership rate: 64.7%
- Housing price-to-rent ratio: 1.16x

The Section 8 housing program added a voucher option in 1983. This measure allows the federal government to provide housing assistance to people in need, such as low-income families and people with disabilities, through vouchers paid directly to landlords.

14 / 50
Robert Alexander // Getty Images

1984

- Inflation-adjusted average home sales price: $240,073 (+4.2% compared to previous year)
- Housing starts: 1.8 million units (+3.6% compared to previous year)
- Homeownership rate: 64.5%
- Housing price-to-rent ratio: 1.15x

In 1984, the U.S. Census Bureau began recording reports of the percentage of families who “could afford to purchase a modestly priced home in the state where they lived,” according to the Partnership for Strong Communities. That year, buying a home was affordable for 60.4% of families in the U.S.

15 / 50
Anthony John Coletti/Construction Photography/Avalon // Getty Images

1985

- Inflation-adjusted average home sales price: $239,600 (-0.2% compared to previous year)
- Housing starts: 1.7 million units (-1.4% compared to previous year)
- Homeownership rate: 63.9%
- Housing price-to-rent ratio: 1.14x

A new type of housing began to take off in 1985: assisted living. Before that year, the main type of housing, besides private homes, available to older adults were either nursing homes or philanthropic organizations, according to Keren Brown Wilson of The Gerontologist.


16 / 50
C. Shelton/ClassicStock // Getty Images

1986

- Inflation-adjusted average home sales price: $261,474 (+9.1% compared to previous year)
- Housing starts: 1.8 million units (+4% compared to previous year)
- Homeownership rate: 63.8%
- Housing price-to-rent ratio: 1.15x

The Tax Reform Act of 1986 nixed the deduction of interest paid on nearly all types of consumer debt except mortgages. That, in turn, drove people to take out second mortgages and home equity lines of credit to finance other purchases, says William A. Dowling of Savannah State University.

17 / 50
R. Krubner/ClassicStock // Getty Images

1987

- Inflation-adjusted average home sales price: $287,156 (+9.8% compared to previous year)
- Housing starts: 1.6 million units (-10% compared to previous year)
- Homeownership rate: 64%
- Housing price-to-rent ratio: 1.17x

In 1987, Congress passed the Housing and Community Development Act, which created the Nehemiah Housing Opportunity Grants program. It would make federal grants available to nonprofits to then loan money to low-income families for the purchase of a home through an approved program.

18 / 50
Barbara Alper // Getty Images

1988

- Inflation-adjusted average home sales price: $299,686 (+4.4% compared to previous year)
- Housing starts: 1.5 million units (-8.7% compared to previous year)
- Homeownership rate: 63.8%
- Housing price-to-rent ratio: 1.19x

The Harvard Joint Center for Housing Studies released its first State of the Nation’s Housing report in 1988, which “provided a measuring stick for changes in the home and rental market in the United States,” according to Patrick Sisson of Curbed. It has continued to be published annually.

19 / 50
H. Armstrong Roberts/ClassicStock // Getty Images

1989

- Inflation-adjusted average home sales price: $305,448 (+1.9% compared to previous year)
- Housing starts: 1.4 million units (-7.1% compared to previous year)
- Homeownership rate: 63.9%
- Housing price-to-rent ratio: 1.21x

The Fair Housing Amendments Act became effective in 1989. It extended the protections of the Civil Rights Act of 1968, which make it illegal to discriminate against potential mortgage borrowers for certain reasons, like race and sex, to families with children and people with disabilities.

20 / 50
rekandshoot // Shutterstock

1990

- Inflation-adjusted average home sales price: $291,649 (-4.5% compared to previous year)
- Housing starts: 1.2 million units (-12.9% compared to previous year)
- Homeownership rate: 64%
- Housing price-to-rent ratio: 1.19x

The National Affordable Housing Act was passed in 1990. It established the HOME block grant program, which gives money to states and localities to create affordable housing options for low-income families.


21 / 50
Tim Boyle // Getty Images

1991

- Inflation-adjusted average home sales price: $276,492 (-5.2% compared to previous year)
- Housing starts: 1 million units (-16.2% compared to previous year)
- Homeownership rate: 64.1%
- Housing price-to-rent ratio: 1.17x

One of the largest year-over-year drops in home prices occurred in April 1991. That month, home prices dropped 6.3% compared with the previous year, according to a report from S&P Case/Shiller analyzed by Les Christie of CNN Money.

22 / 50
Spiroview Inc // Shutterstock

1992

- Inflation-adjusted average home sales price: $263,674 (-4.6% compared to previous year)
- Housing starts: 1.2 million units (+19.1% compared to previous year)
- Homeownership rate: 64.2%
- Housing price-to-rent ratio: 1.18x

The Federal Housing Enterprises Financial Safety and Soundness Act began requiring Fannie Mae and Freddie Mac to provide more support to borrowers in underserved areas, as well as those in low-income brackets, in 1992. The law also led to the creation of the Office of Federal Housing Enterprise Oversight.

23 / 50
J. Irwin/ClassicStock // Getty Images

1993

- Inflation-adjusted average home sales price: $260,964 (-1% compared to previous year)
- Housing starts: 1.3 million units (+7.5% compared to previous year)
- Homeownership rate: 64.5%
- Housing price-to-rent ratio: 1.18x

The median age of first-time homebuyers increased to 32 in 1993. It was the oldest median age of people buying their first home up to that point in history, according to National Association of Realtors data that dates back to 1981.

24 / 50
W. Metzen/ClassicStock // Getty Images

1994

- Inflation-adjusted average home sales price: $266,009 (+1.9% compared to previous year)
- Housing starts: 1.4 million units (+12% compared to previous year)
- Homeownership rate: 64%
- Housing price-to-rent ratio: 1.18x

The federal government put out the Policy Statement on Discrimination in Lending in 1994. It provided more details about what constitutes lending discrimination for mortgages and other types of financing in regard to race, gender, religion, and other protected statuses.

25 / 50
Joseph Sohm // Shutterstock

1995

- Inflation-adjusted average home sales price: $264,676 (-0.5% compared to previous year)
- Housing starts: 1.4 million units (-5.9% compared to previous year)
- Homeownership rate: 64.8%
- Housing price-to-rent ratio: 1.19x

The U.S. Department of Housing and Urban Development gave affordable-housing credit to Fannie Mae and Freddie Mac for purchasing subprime securities, in an effort to help borrowers who didn’t meet the qualifications for conventional mortgages. These subprime securities contained loans to low-income people, notes Carol D. Leonnig of The Washington Post.


26 / 50
Anne Cusack/Los Angeles Times // Getty Images

1996

- Inflation-adjusted average home sales price: $269,756 (+1.9% compared to previous year)
- Housing starts: 1.5 million units (+7.9% compared to previous year)
- Homeownership rate: 65.4%
- Housing price-to-rent ratio: 1.19x

The National Fair Housing Alliance began collecting data on housing discrimination complaints in 1996. From that year until 2018, more than 500,000 complaints were processed.

27 / 50
Jason Finn // Shutterstock

1997

- Inflation-adjusted average home sales price: $278,601 (+3.3% compared to previous year)
- Housing starts: 1.5 million units (+0.4% compared to previous year)
- Homeownership rate: 65.7%
- Housing price-to-rent ratio: 1.20x

Congress enacted a new Taxpayer Relief Act in 1997. The law created tax exemptions on the capital gains from the sale of private homes of up to $250,000 for single taxpayers and $500,000 for married couples who file taxes together.

28 / 50
Drop of Light // Shutterstock

1998

- Inflation-adjusted average home sales price: $284,172 (+2% compared to previous year)
- Housing starts: 1.6 million units (+9.9% compared to previous year)
- Homeownership rate: 66.3%
- Housing price-to-rent ratio: 1.22x

President Bill Clinton signed the Quality Housing and Work Responsibility Act of 1998 into law on Oct. 21 of this year. It overhauled the management of public housing and streamlined the Section 8 voucher program, reports Casey J. Dawkins of Virginia Polytechnic Institute and State University.

29 / 50
rekandshoot // Shutterstock

1999

- Inflation-adjusted average home sales price: $298,790 (+5.1% compared to previous year)
- Housing starts: 1.6 million units (+1.6% compared to previous year)
- Homeownership rate: 66.8%
- Housing price-to-rent ratio: 1.24x

Fannie Mae relaxed credit requirements on mortgage applications in 1999. While it would eliminate a barrier faced by more African Americans than their white counterparts, the measure failed to make home ownership more equitable among people of different races, according to the National Association of Realtors.

30 / 50
Lucy Autrey Wilson // Shutterstock

2000

- Inflation-adjusted average home sales price: $304,962 (+2.1% compared to previous year)
- Housing starts: 1.6 million units (-4.5% compared to previous year)
- Homeownership rate: 67.4%
- Housing price-to-rent ratio: 1.28x

Congress passed the American Homeownership and Economic Opportunity Act in late 2000. The law contained incentives to boost homeownership among older adults and people with disabilities, and allow low-income people to use housing assistance funds to buy homes, among other housing provisions, notes the American Land Title Association.


31 / 50
Susan Law Cain // Shutterstock

2001

- Inflation-adjusted average home sales price: $304,718 (-0.1% compared to previous year)
- Housing starts: 1.6 million units (+1.8% compared to previous year)
- Homeownership rate: 67.8%
- Housing price-to-rent ratio: 1.31x

Falling mortgage rates led to an influx of homeowners refinancing their mortgages in the early 2000s. Between 2000 and 2003, the number of refinance loans climbed from 2.5 million to more than 15 million, reports the Department of Housing and Urban Development.

32 / 50
1599686sv // Shutterstock

2002

- Inflation-adjusted average home sales price: $322,219 (+5.7% compared to previous year)
- Housing starts: 1.7 million units (+6.8% compared to previous year)
- Homeownership rate: 67.9%
- Housing price-to-rent ratio: 1.34x

President George W. Bush designated June as National Homeownership Month in 2002. Celebrated annually, the monthlong event would help draw attention to issues surrounding homeownership and raise awareness about the finances involved with purchasing and maintaining a home.

33 / 50
Joseph Sohm // Shutterstock

2003

- Inflation-adjusted average home sales price: $339,845 (+5.5% compared to previous year)
- Housing starts: 1.9 million units (+8.4% compared to previous year)
- Homeownership rate: 68.3%
- Housing price-to-rent ratio: 1.39x

Rates on 30-year fixed-rate mortgages dropped to historically low rates in 2003, falling to 5.61% in mid-March of that year. By that time in 2003, the rates on these types of mortgages had already set five record lows, reports CNN.

34 / 50
zimmytws // Shutterstock

2004

- Inflation-adjusted average home sales price: $368,356 (+8.4% compared to previous year)
- Housing starts: 1.9 million units (+5.2% compared to previous year)
- Homeownership rate: 69%
- Housing price-to-rent ratio: 1.48x

The rate of homeownership among Black Americans hit a historical high of 49.7% in mid-2004, according to Census data. It would remain at similar levels for the next two years.

35 / 50
Andy Dean Photography // Shutterstock

2005

- Inflation-adjusted average home sales price: $381,357 (+3.5% compared to previous year)
- Housing starts: 2.1 million units (+6.3% compared to previous year)
- Homeownership rate: 68.9%
- Housing price-to-rent ratio: 1.60x

The United States was experiencing a housing bubble in 2005; from 2000 to 2005, home sales almost doubled. Lenders issued mortgages to people who wouldn't normally qualify and allowed for higher payments than homebuyers could actually afford. 


36 / 50
Photography by Ace // Shutterstock

2006

- Inflation-adjusted average home sales price: $385,453 (+1.1% compared to previous year)
- Housing starts: 1.8 million units (-12.6% compared to previous year)
- Homeownership rate: 68.8%
- Housing price-to-rent ratio: 1.65x

By 2006, subprime mortgages comprised 20% of the entire mortgage market—it was just 8% in 2003. Those loans would lead to the financial crisis in the coming years.

37 / 50
Joseph Sohm // Shutterstock

2007

- Inflation-adjusted average home sales price: $382,132 (-0.9% compared to previous year)
- Housing starts: 1.3 million units (-25.9% compared to previous year)
- Homeownership rate: 68.2%
- Housing price-to-rent ratio: 1.60x

In the nine months leading up to August 2007, around 120 mortgage lenders closed or declared bankruptcy, according to Lehman Brothers via Jenny Anderson and Vikas Bajaj of The New York Times. That month, Lehman Brothers, “a leader in packaging subprime mortgages into securities,” announced it would close a home lending unit and let go of 1,200 workers.

38 / 50
Terrance Emerson // Shutterstock

2008

- Inflation-adjusted average home sales price: $343,319 (-10.2% compared to previous year)
- Housing starts: .9 million units (-32.9% compared to previous year)
- Homeownership rate: 67.8%
- Housing price-to-rent ratio: 1.47x

Amid the 2008 housing crisis, foreclosure filings skyrocketed by more than 81%, according to a RealtyTrac report cited by Les Christie of CNN Money. That year, one in every 54 U.S. households got a foreclosure notice.

39 / 50
robophobic // Shutterstock

2009

- Inflation-adjusted average home sales price: $321,085 (-6.5% compared to previous year)
- Housing starts: .6 million units (-38.4% compared to previous year)
- Homeownership rate: 67.4%
- Housing price-to-rent ratio: 1.35x

RealtyTrac’s Year-end 2009 Foreclosure Market Report found that the United States had more than 3.9 million foreclosure filings that year. That figure represented a 21% jump in properties with foreclosure filings from 2008, and a 120% surge from 2007.

40 / 50
FotosForTheFuture // Shutterstock

2010

- Inflation-adjusted average home sales price: $318,922 (-0.7% compared to previous year)
- Housing starts: .6 million units (+5.7% compared to previous year)
- Homeownership rate: 66.9%
- Housing price-to-rent ratio: 1.29x

Congress passed the Dodd-Frank Wall Street Reform and Consumer Protection Act in 2010. The law included new regulations on mortgage lenders and parts of the financial system that caused the financial crisis in 2008. It led to the creation of the Consumer Financial Protection Bureau, which was responsible for protecting consumers by making sure financial service providers are acting fairly. 


41 / 50
Irina Mos // Shutterstock

2011

- Inflation-adjusted average home sales price: $300,837 (-5.7% compared to previous year)
- Housing starts: .6 million units (+4.5% compared to previous year)
- Homeownership rate: 66.2%
- Housing price-to-rent ratio: 1.22x

In 2011, the median age of all homebuyers in the U.S. was 45—a historic high, according to National Association of Realtors data that extends back to 1981. The record would once again be broken in 2019, when 47 became the median age of homebuyers.

42 / 50
Kara Grubis // Shutterstock

2012

- Inflation-adjusted average home sales price: $320,989 (+6.7% compared to previous year)
- Housing starts: .8 million units (+28.1% compared to previous year)
- Homeownership rate: 65.5%
- Housing price-to-rent ratio: 1.19x

Mortgage rates dropped to an all-time low in November 2012, according to data from Freddie Mac’s Primary Mortgage Market Survey. It found that the lowest rate a borrower could get on a 30-year fixed-rate mortgage was 3.31% that month.

43 / 50
trekandshoot // Shutterstock

2013

- Inflation-adjusted average home sales price: $352,987 (+10% compared to previous year)
- Housing starts: .9 million units (+18.4% compared to previous year)
- Homeownership rate: 65.1%
- Housing price-to-rent ratio: 1.20x

The year 2013 marked a rebound in the average sales price of U.S. homes to levels that matched those before the financial crisis. The housing market had been struggling since late 2007.

44 / 50
Sundry Photography // Shutterstock

2014

- Inflation-adjusted average home sales price: $373,179 (+5.7% compared to previous year)
- Housing starts: 1 million units (+7.8% compared to previous year)
- Homeownership rate: 64.5%
- Housing price-to-rent ratio: 1.22x

The proportion of homes sold to first-time buyers dropped to its lowest point in more than two decades in 2014, according to data from the National Association of Realtors. The government revised regulations on mortgage lenders at the end of that year and created low down payment programs that could help first-time homebuyers in the future.

45 / 50
Joseph Sohm // Shutterstock

2015

- Inflation-adjusted average home sales price: $378,102 (+1.3% compared to previous year)
- Housing starts: 1.1 million units (+10.6% compared to previous year)
- Homeownership rate: 63.7%
- Housing price-to-rent ratio: 1.24x

The average size of single-family homes in the United States peaked at 2,802 square feet in 2015, according to National Association of Home Builders data. Average square footage for homes would begin to decline through at least 2019.


46 / 50
TierneyMJ // Shutterstock

2016

- Inflation-adjusted average home sales price: $383,177 (+1.3% compared to previous year)
- Housing starts: 1.2 million units (+6.3% compared to previous year)
- Homeownership rate: 63.4%
- Housing price-to-rent ratio: 1.26x

In 2016, an investigation by ProPublica uncovered a practice at Facebook that allowed advertisers to prevent housing ads from appearing in the feeds of users based on race and ethnicity. Civil rights groups and the National Fair Housing Alliance pursued legal action against the practice, and three years later, the social media giant finally ended it, according to Michela Zonta of the Center for American Progress.

47 / 50
JPL Designs // Shutterstock

2017

- Inflation-adjusted average home sales price: $397,634 (+3.8% compared to previous year)
- Housing starts: 1.2 million units (+2.6% compared to previous year)
- Homeownership rate: 63.9%
- Housing price-to-rent ratio: 1.29x

The housing market was “robust” in 2017, according to data from Zillow. It may have been spurred by a new tax law, set to kick in the following year, that would reduce certain benefits of homeownership, such as “a cap on state and local tax deductions” and a drop in the limit of eligible debt for a deduction in mortgage interest, reports Bloomberg.

48 / 50
Kristi Blokhin // Shutterstock

2018

- Inflation-adjusted average home sales price: $389,482 (-2.1% compared to previous year)
- Housing starts: 1.2 million units (+3.4% compared to previous year)
- Homeownership rate: 64.4%
- Housing price-to-rent ratio: 1.32x

Homeownership rates among single Americans climbed to a historical high of 38.4% in 2018, according to Census Bureau data analyzed by Haus. The rate was less than 20% as of 2000.

49 / 50
Artazum // Shutterstock

2019

- Inflation-adjusted average home sales price: $379,875 (-2.5% compared to previous year)
- Housing starts: 1.3 million units (+3.8% compared to previous year)
- Homeownership rate: 64.6%
- Housing price-to-rent ratio: 1.34x

Hedge fund manager Ken Griffin closed on a $238 million home in New York City in 2019. The 24,000-square-foot apartment is the most expensive home ever sold in the United States, reports CNN's Tony Marco.

50 / 50
1000Photography // Shutterstock

2020

- Inflation-adjusted average home sales price: $375,850 (-1.1% compared to previous year)
- Housing starts: 1.3 million units (-2.4% compared to previous year)
- Homeownership rate: 67.9%
- Housing price-to-rent ratio: 1.34x

The COVID-19 pandemic has thrown the U.S. housing market through a loop in 2020. Mortgage rates have plummeted, while sellers are getting top dollar for their homes, according to Dima Williams of Forbes. In the second quarter of 2020 compared to the same quarter a year before, housing demand went up to 40% from being down 41%, reports Norada Real Estate Investments.


Trending Now