What the housing market looks like in every state
This story originally appeared on Sundae and was produced and distributed in partnership with Stacker Studio.
What the housing market looks like in every state
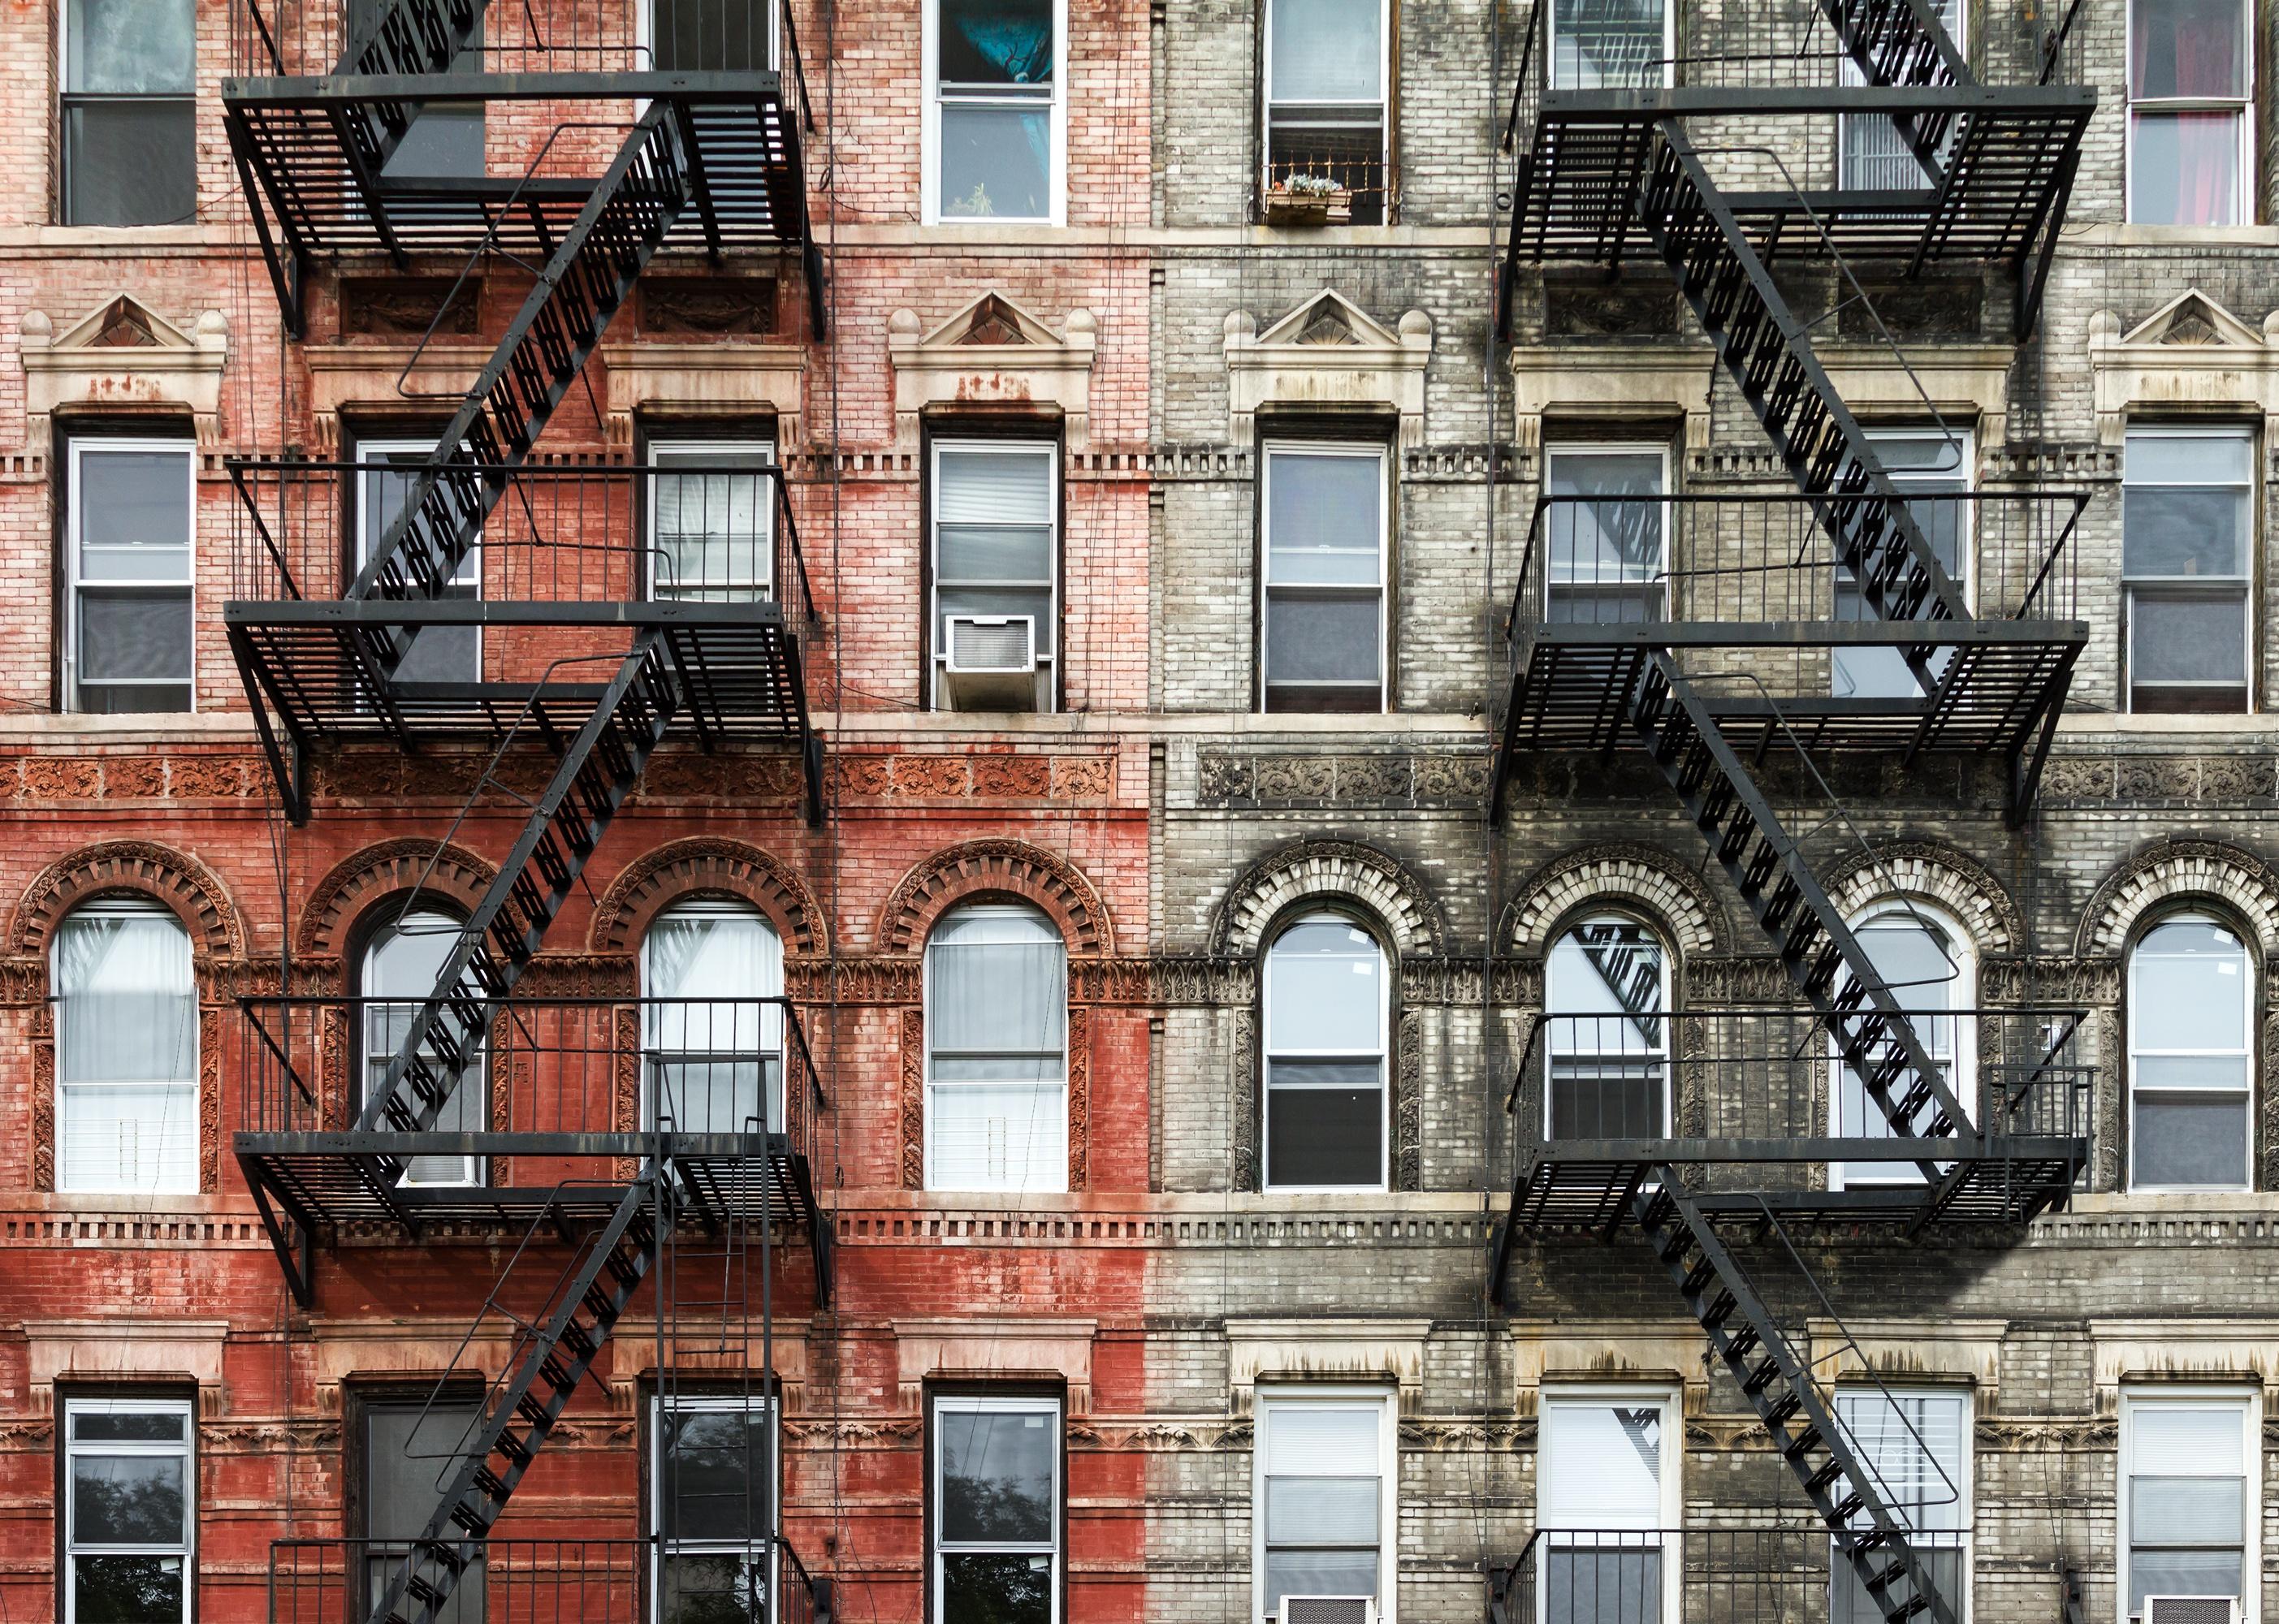
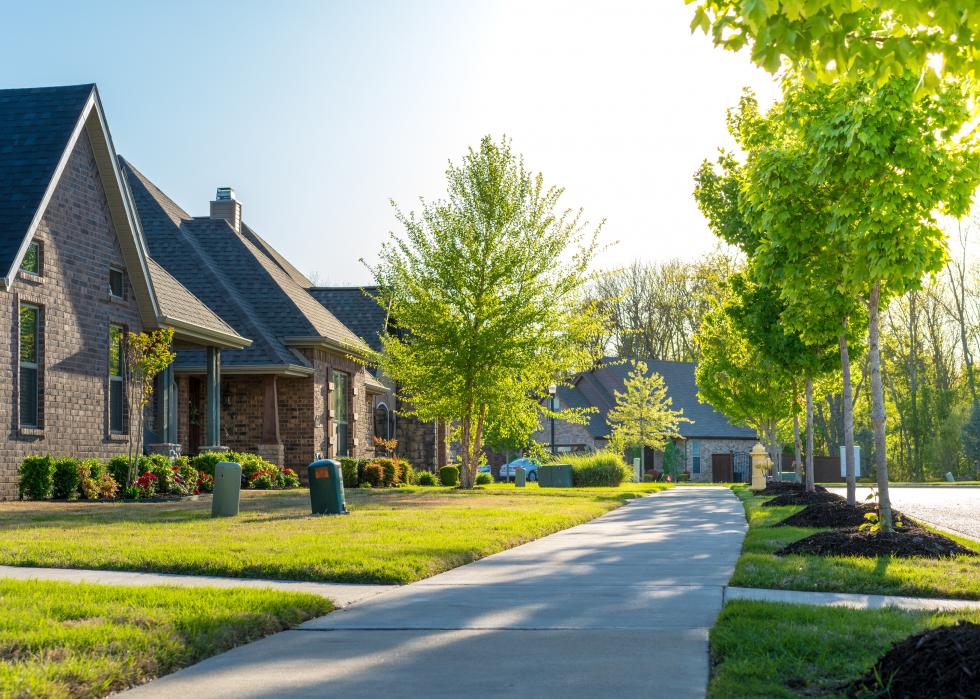
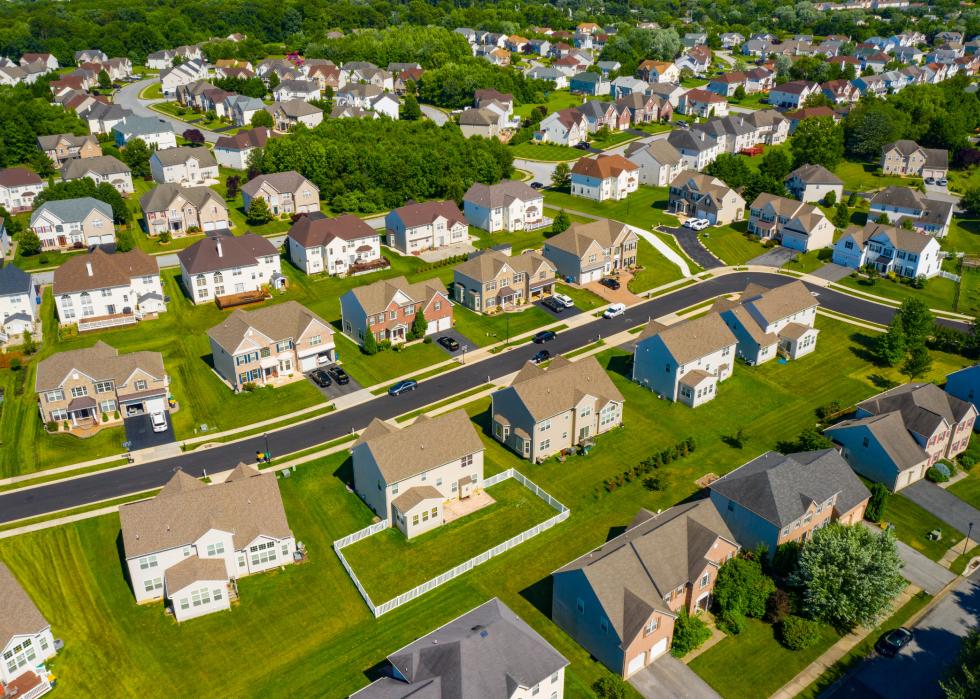
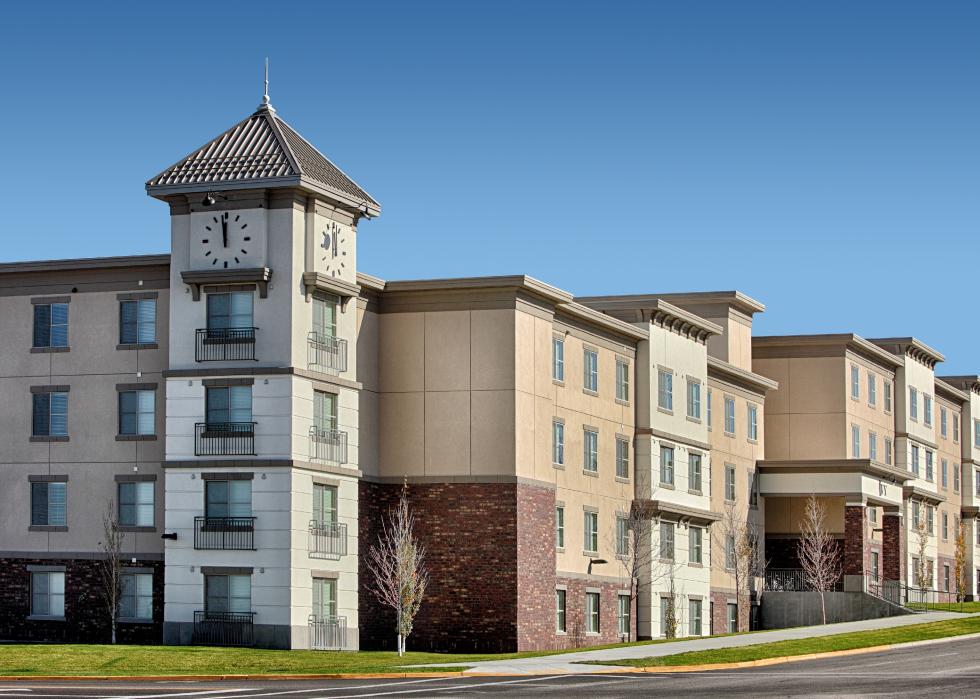
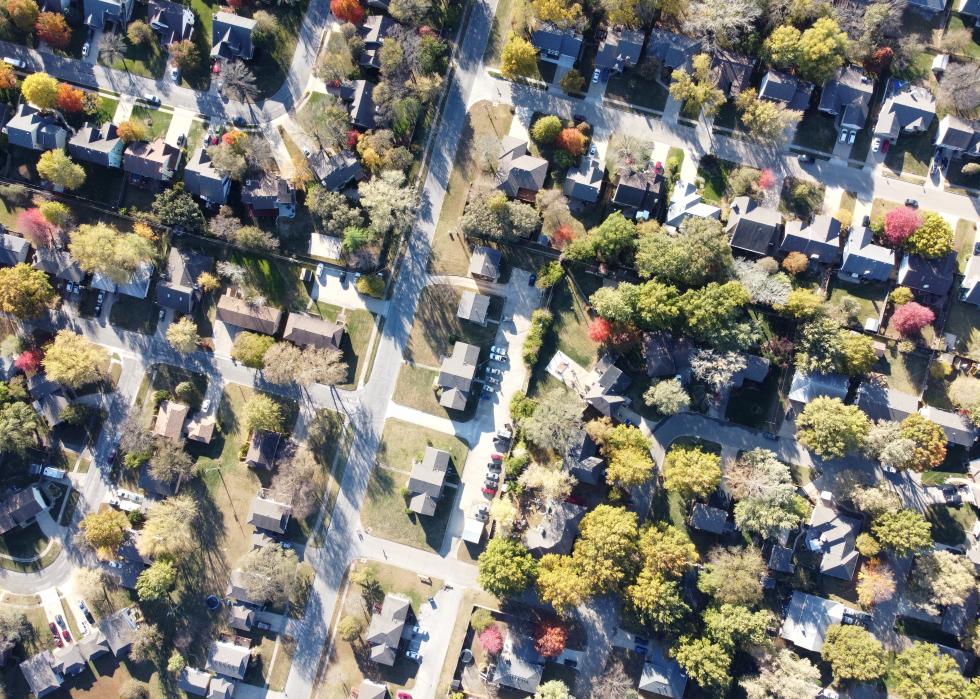
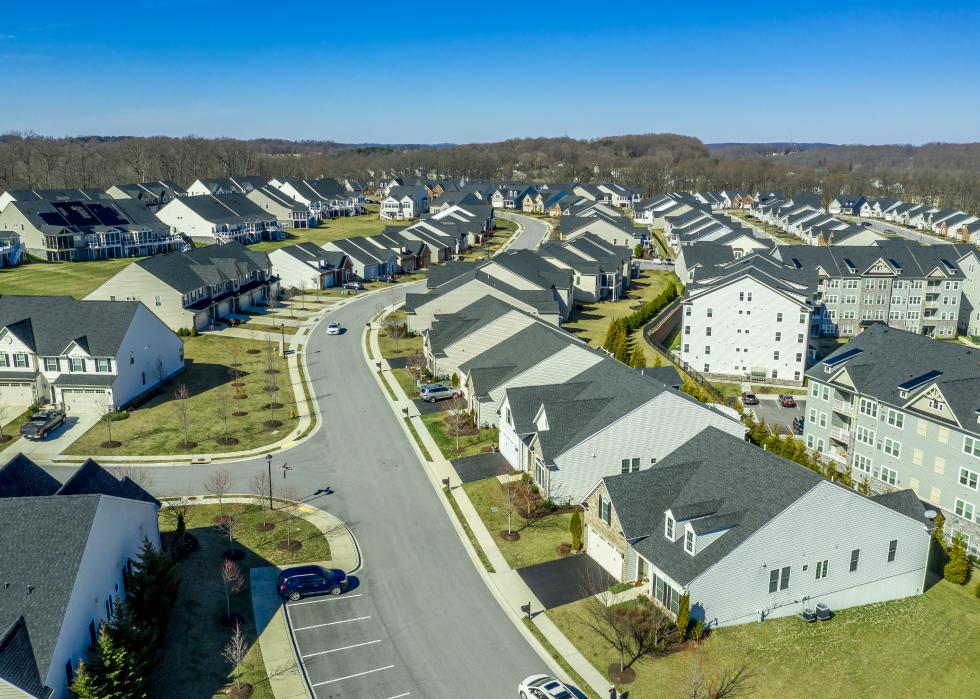
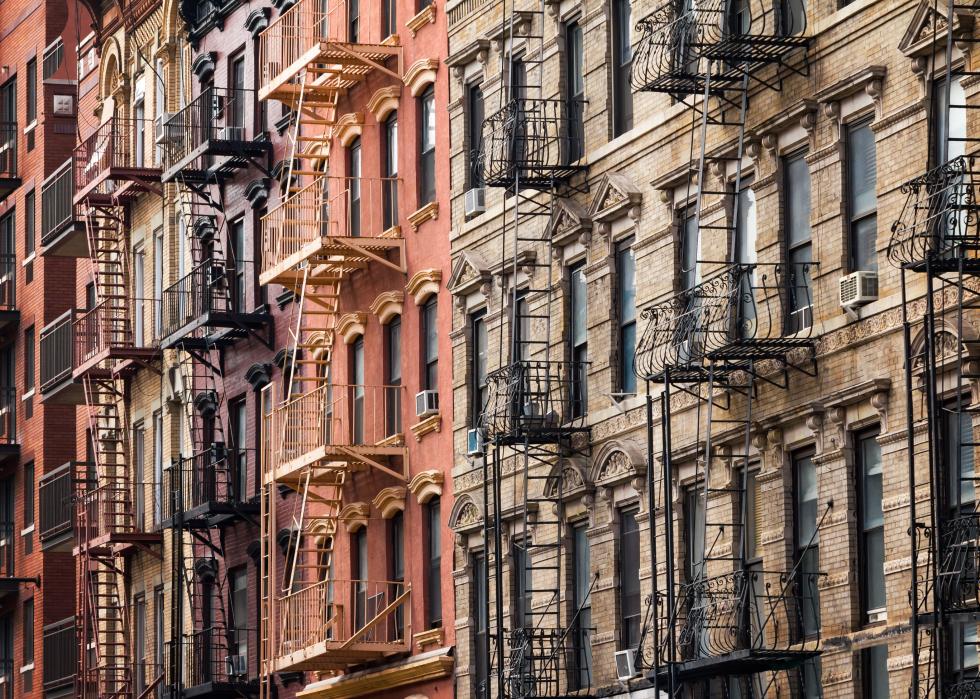
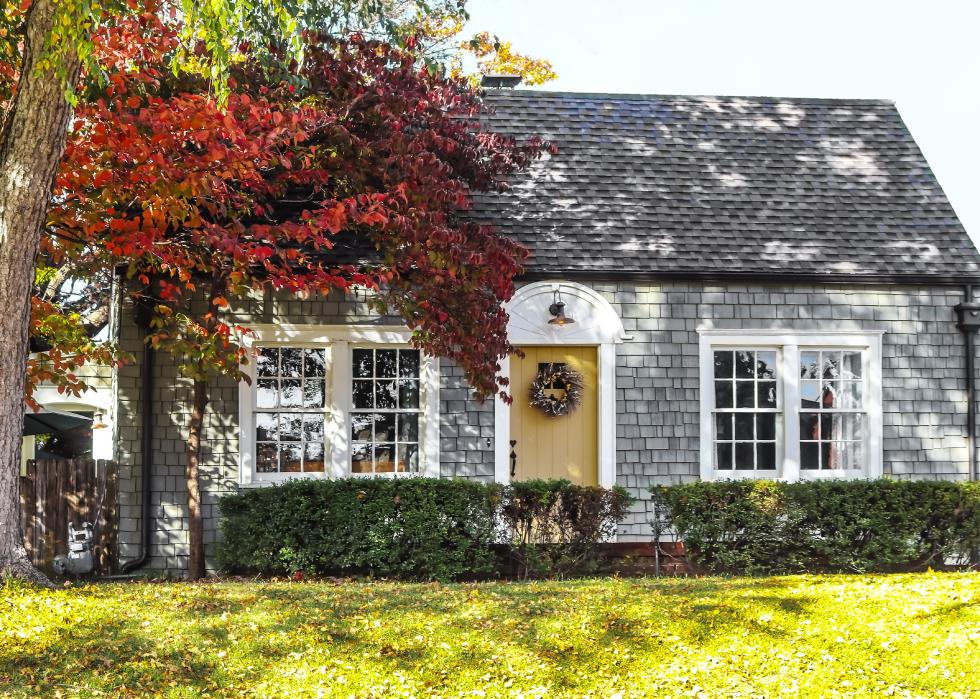
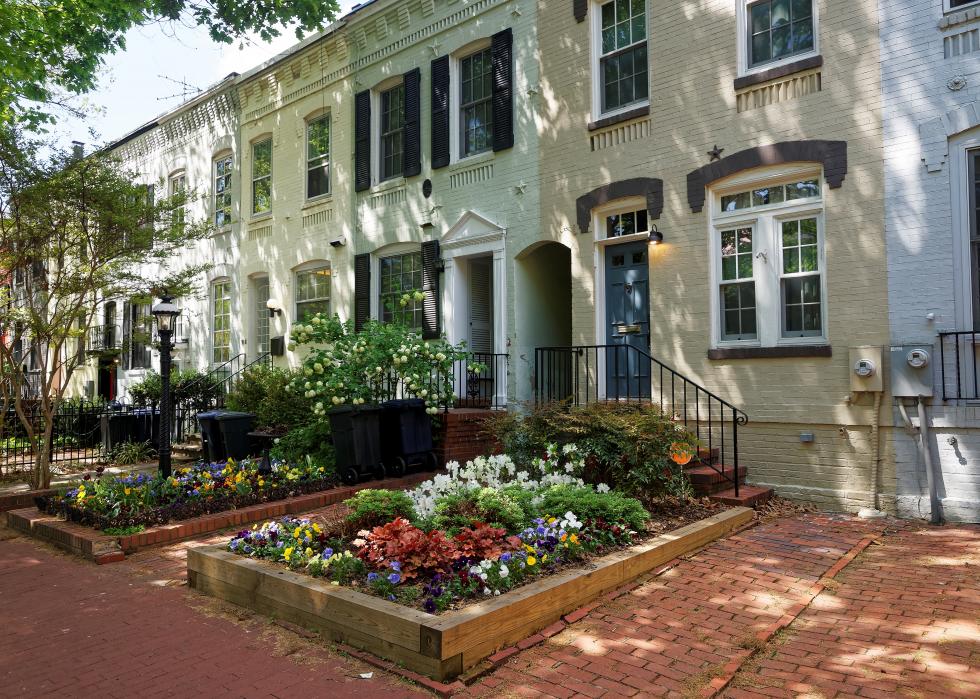
At the start of the coronavirus pandemic, no one could have predicted what would happen with the housing market. Typically, in a recession, home prices fall and people stay in their homes. The opposite occurred in the fall of 2020. As more and more office workers were given the green light to work remotely, some for an indefinite time period, and mortgage interest rates hit an all-time low, real estate sales spiked in almost every region of the country.
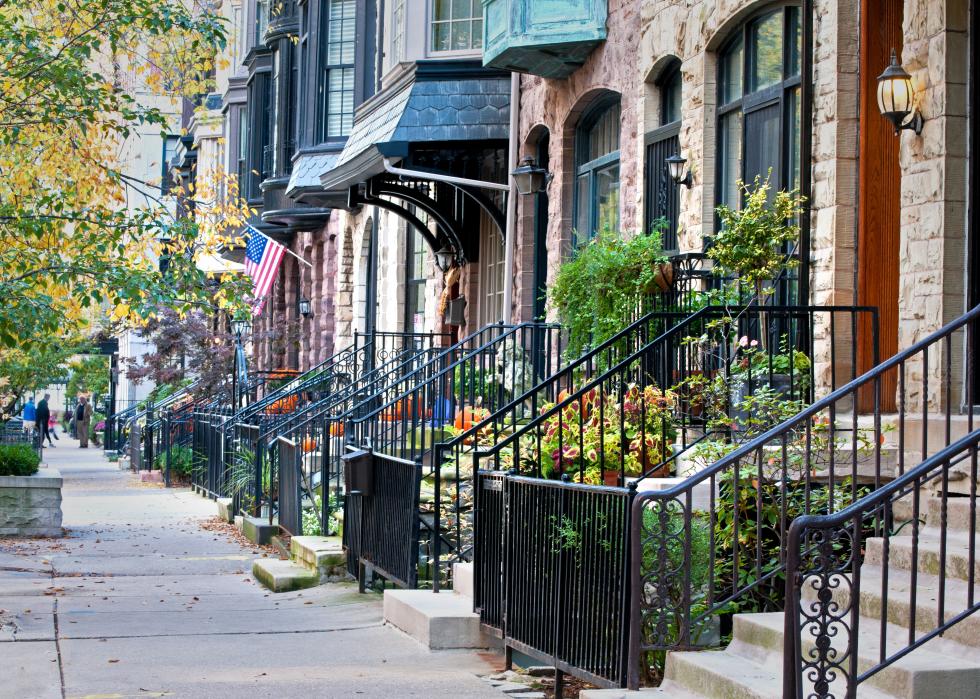
It turns out that people working from home don’t want to do so from a studio apartment in the middle of a big city rife with COVID-19. Instead, they’d rather move somewhere with room to roam and perhaps space for a home office. After all, during the pandemic, people are doing nearly everything from home, including homeschooling their children.
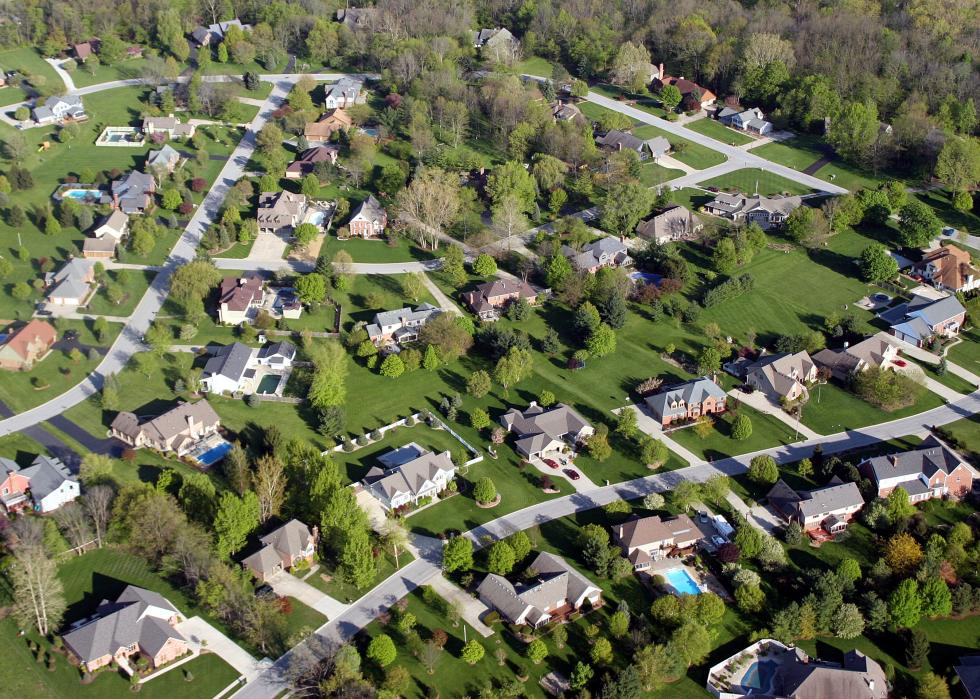
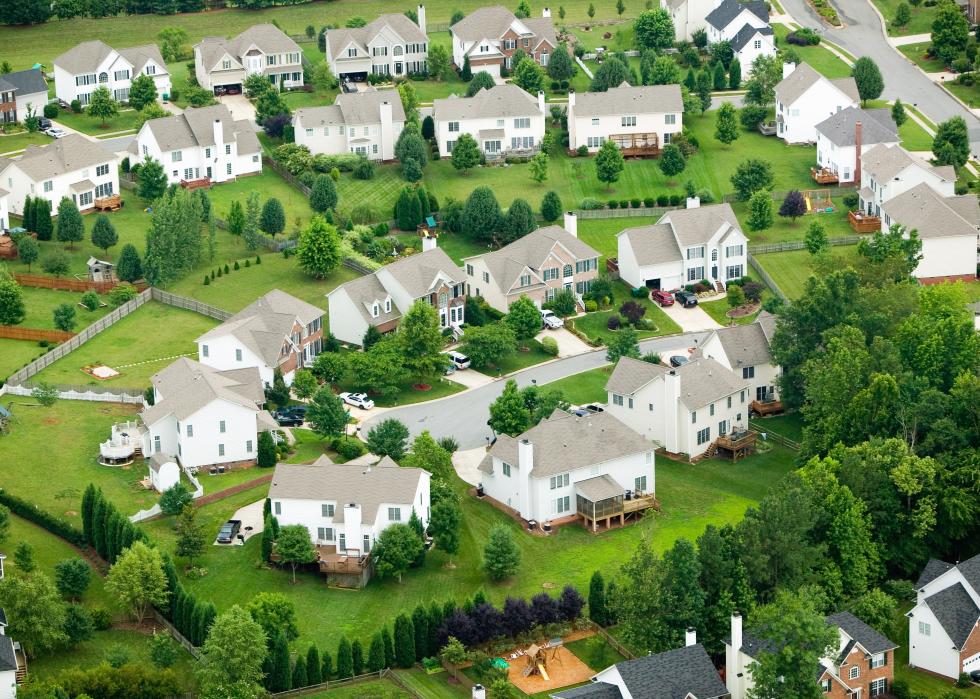
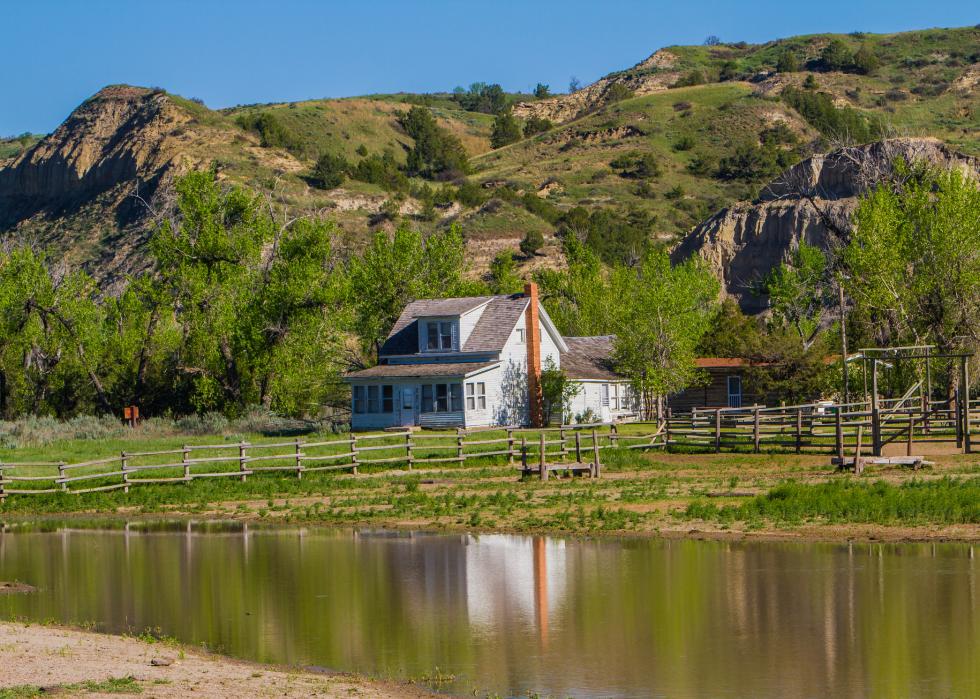
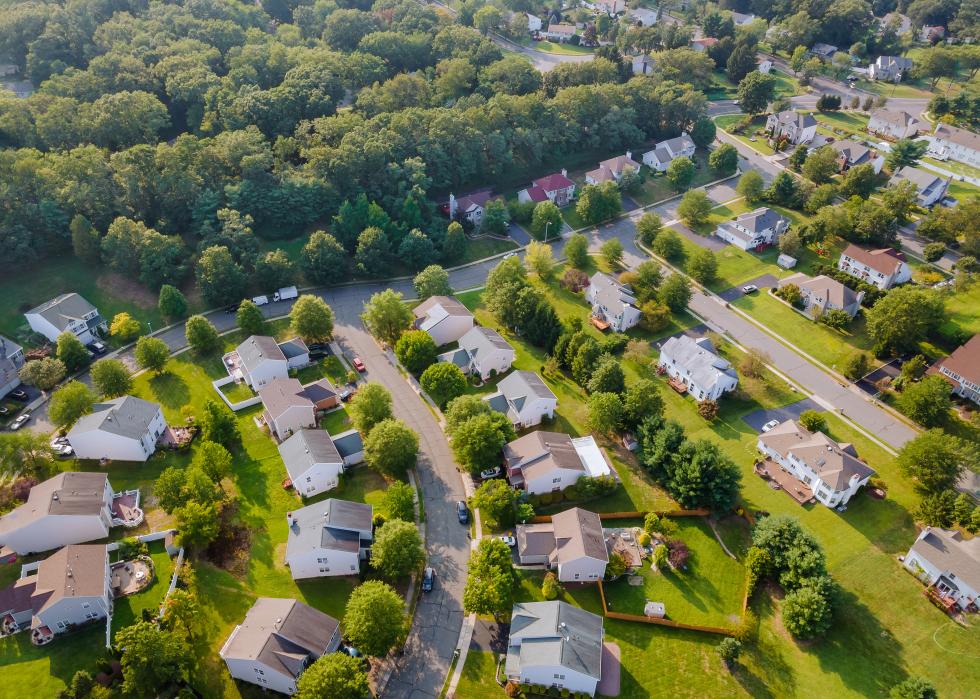
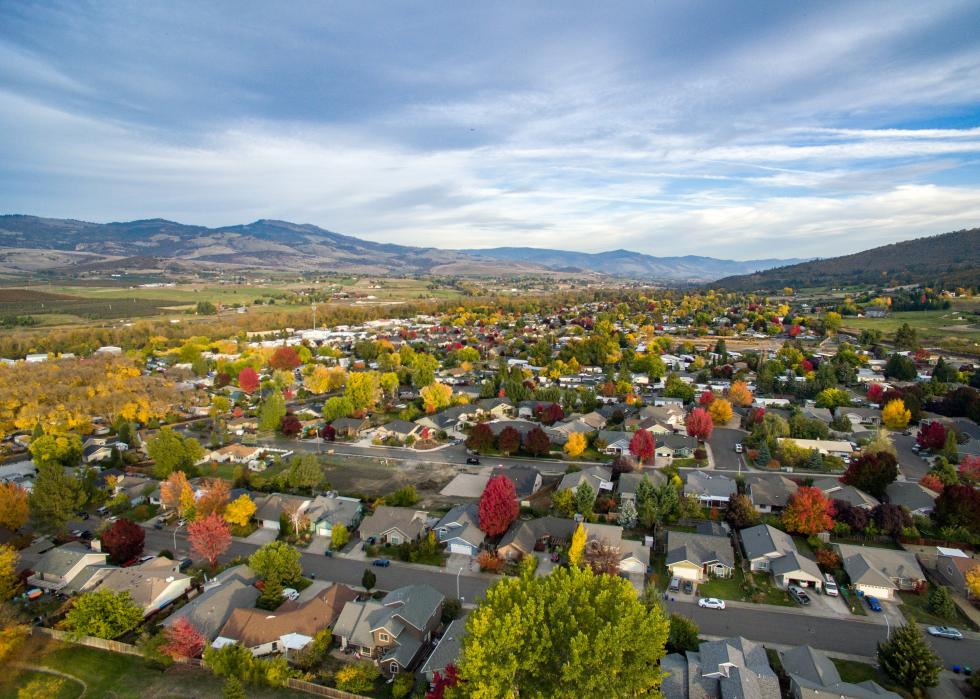
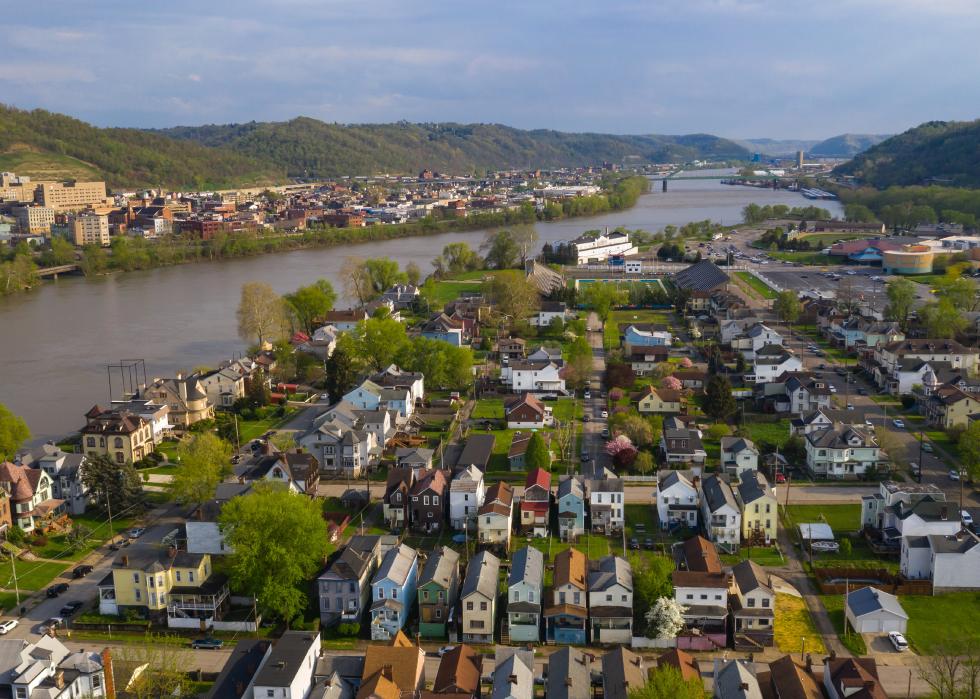
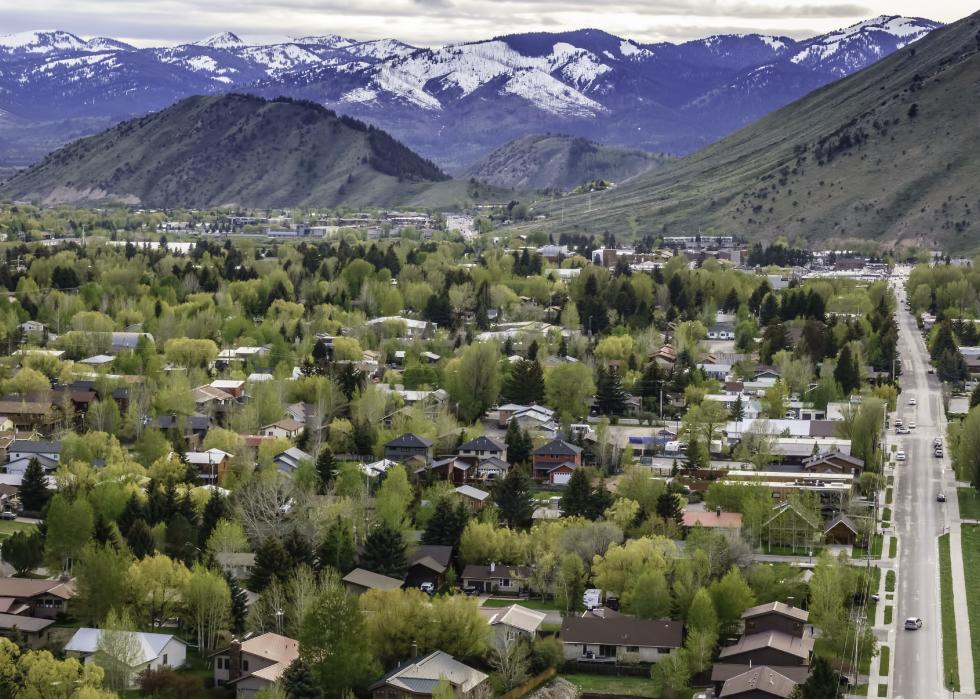
All of these factors gave rise to something called “Zoom Towns” in 2020. Without the need to commute, small towns featuring larger homes for less money were suddenly the hot—and safer—place for prospective homebuyers. Because of this, sleepy, rural towns suddenly got an influx of out-of-state buyers, many of whom were ready to purchase homes sight unseen and with cash in hand. Out-of-towners and a lack of new inventory due to a slowdown in new construction led to more competition for less homes, driving up prices and causing bidding wars across the U.S. But how long will this housing boom last, and which states are feeling its effects the most?
Sundae used data from the U.S. Census Bureau's 2019 American Community Survey 1-Year Estimates (released in December 2020) and its own 2021 internal data on current housing market trends to compile a list of statistics that show what the housing market looks like in every state. These stats cover what types of homes exist in every state, how many people are owning or renting homes, the value of homes, and how many homes have been on the market over the past couple of months (it's important to note that some of this data is constantly changing due to the pandemic).
As we move further into 2021, the Federal Housing Administration (FHA) has extended its eviction and foreclosure moratorium once again, this time until the end of February. The moratorium helps those who are unable to pay their mortgages due to the pandemic, allowing for deferment or reduction in mortgage payments. Time will tell if the end of this program will land thousands of homes on the market in 2021. Until then, buyers and sellers can benefit from the current real estate markets across the country.
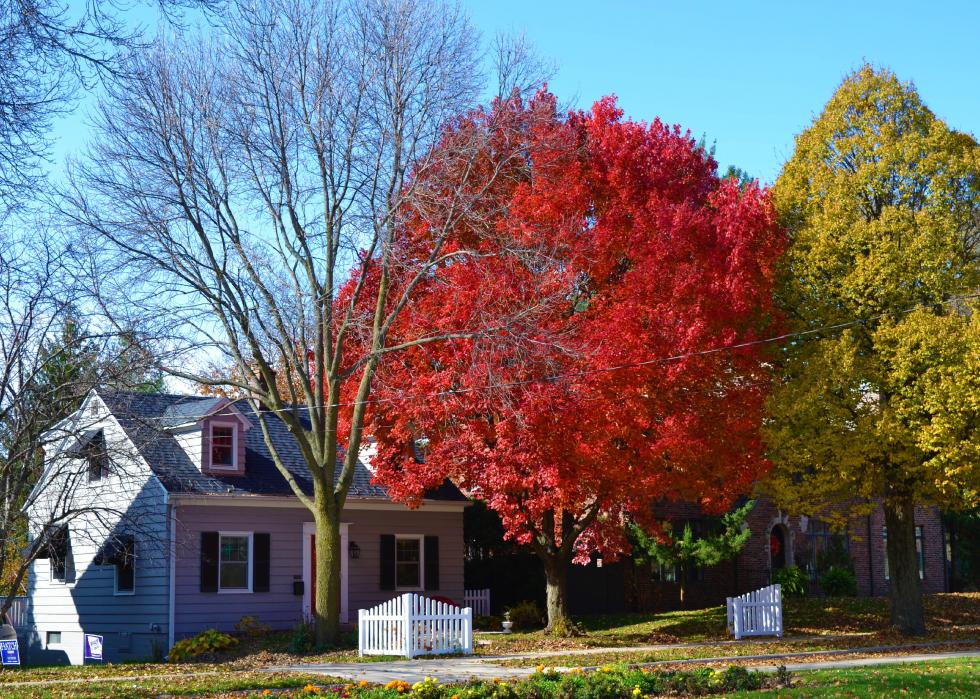
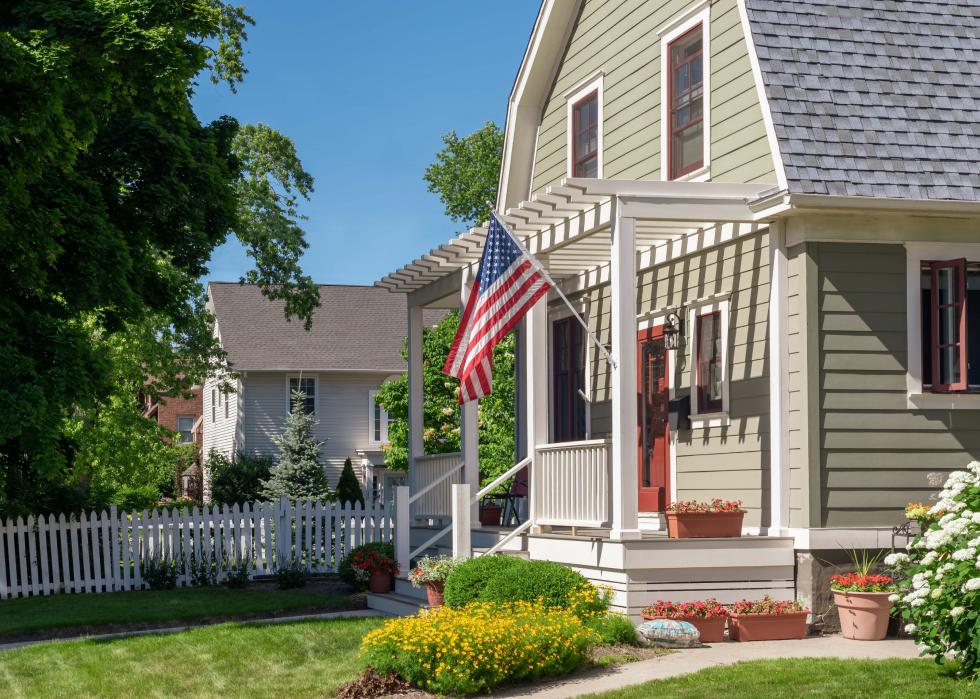
Read on to see how your own state’s housing market has fared over the past year.
Alabama
- Total housing units: 2,284,922
--- Occupied housing units: 1,897,576 (68.8% owner-occupied, 31.2% renter-occupied)
--- Vacant housing units: 387,346 (1.4% homeowner vacancy rate, 9.7% rental vacancy rate)
- Median rooms per house: 5.7
- Bedrooms: 1.4% no bedrooms, 6.5% one bedroom, 22.5% two bedrooms, 49.1% three bedrooms, 16.7% four bedrooms, 3.9% five bedrooms
- Average household size: 2.5
- Median gross rent: $807
- Median homeowner cost: $1,172 (with mortgage), $362 (without mortgage)
- Average days homes are on the market: 73 (36,913 homes currently)
- Current median listing price of homes in Alabama: $192,900 (9.0% less than 2020, 4.3% greater than 2019)
Low interest rates, affordable home prices, and smaller cities attracted buyers to Alabama during 2020. With sales going up, inventory has shrunk, making Alabama a seller’s market and causing a slight rise in home prices overall.
Alaska
- Total housing units: 319,867
--- Occupied housing units: 252,199 (64.7% owner-occupied, 35.3% renter-occupied)
--- Vacant housing units: 67,668 (1.7% homeowner vacancy rate, 9.2% rental vacancy rate)
- Median rooms per house: 4.8
- Bedrooms: 7.6% no bedrooms, 13.0% one bedroom, 26.0% two bedrooms, 34.2% three bedrooms, 16.0% four bedrooms, 3.3% five bedrooms
- Average household size: 2.8
- Median gross rent: $1,201
- Median homeowner cost: $1,882 (with mortgage), $577 (without mortgage)
- Average days homes are on the market: 81 (5,593 homes currently)
- Current median listing price of homes in Alaska: $299,900 (39.5% less than 2020, 3.8% greater than 2019)
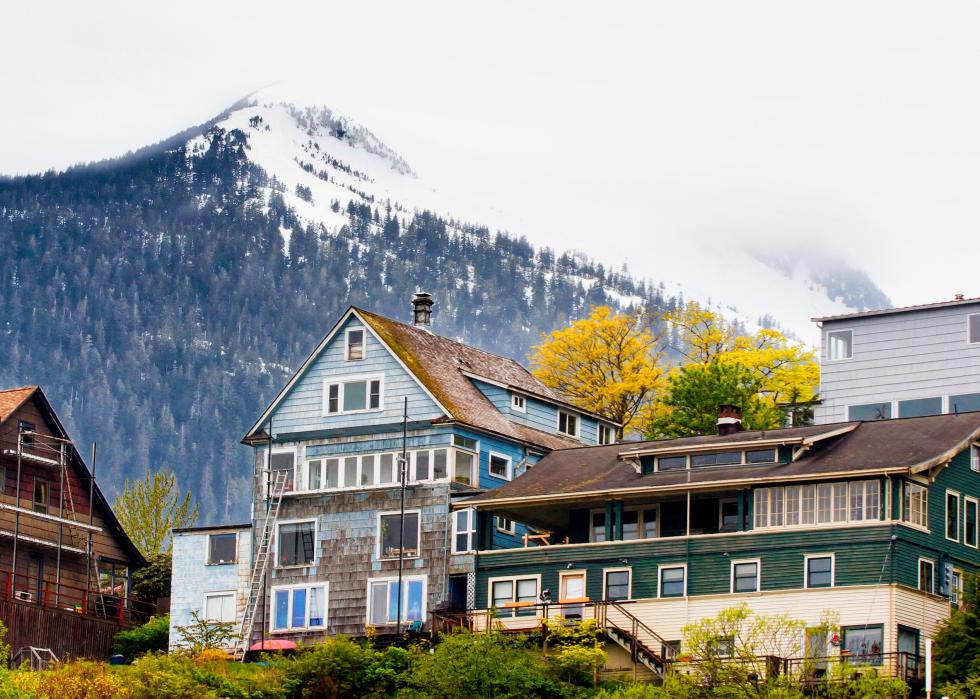
The price for a home in Alaska has continued to rise due to low inventory and low interest rates in 2020. Alaskans have also taken advantage of low interest rates by refinancing, downsizing, and switching from a 30-year to a 15-year mortgage.
Arizona
- Total housing units: 3,076,048
--- Occupied housing units: 2,670,441 (65.3% owner-occupied, 34.7% renter-occupied)
--- Vacant housing units: 405,607 (1.5% homeowner vacancy rate, 5.3% rental vacancy rate)
- Median rooms per house: 5.3
- Bedrooms: 2.9% no bedrooms, 11.3% one bedroom, 26.6% two bedrooms, 36.9% three bedrooms, 18.0% four bedrooms, 4.2% five bedrooms
- Average household size: 2.7
- Median gross rent: $1,101
- Median homeowner cost: $1,457 (with mortgage), $421 (without mortgage)
- Average days homes are on the market: 62 (118,639 homes currently)
- Current median listing price of homes in Arizona: $284,900 (9.8% less than 2020, 5.5% greater than 2019)
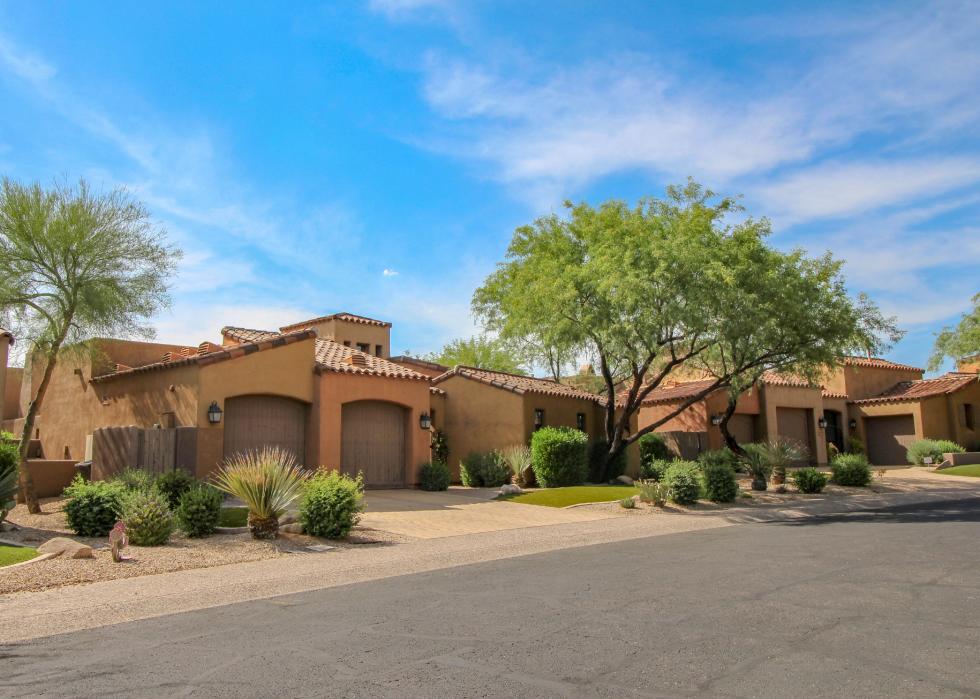
Home sales in the Phoenix-Mesa-Scottsdale area of Arizona have risen steadily in 2020 due to high demand and low interest rates. Experts forecast that home prices and sales will continue to go up in 2021, despite the possibility of heightened interest rates and lending institutions requiring higher credit scores in a volatile economy.
Arkansas
- Total housing units: 1,389,159
--- Occupied housing units: 1,163,647 (65.5% owner-occupied, 34.5% renter-occupied)
--- Vacant housing units: 225,512 (1.9% homeowner vacancy rate, 7.4% rental vacancy rate)
- Median rooms per house: 5.4
- Bedrooms: 2.2% no bedrooms, 7.3% one bedroom, 26.0% two bedrooms, 49.0% three bedrooms, 13.1% four bedrooms, 2.4% five bedrooms
- Average household size: 2.5
- Median gross rent: $742
- Median homeowner cost: $1,094 (with mortgage), $348 (without mortgage)
- Average days homes are on the market: 76 (20,985 homes currently)
- Current median listing price of homes in Arkansas: $179,900 (7.7% less than 2020, 1.1% greater than 2019)
Going into 2020, Arkansas already had a low inventory of homes. When people started moving from big cities to more rural towns to work remotely during the pandemic, prices grew quickly, and available houses spent much less time on the market. In Arkansas, not only are first-time buyers jumping in to purchase, but vacation homebuyers are also staking claims on properties in the Ozark Mountains and Hot Springs.
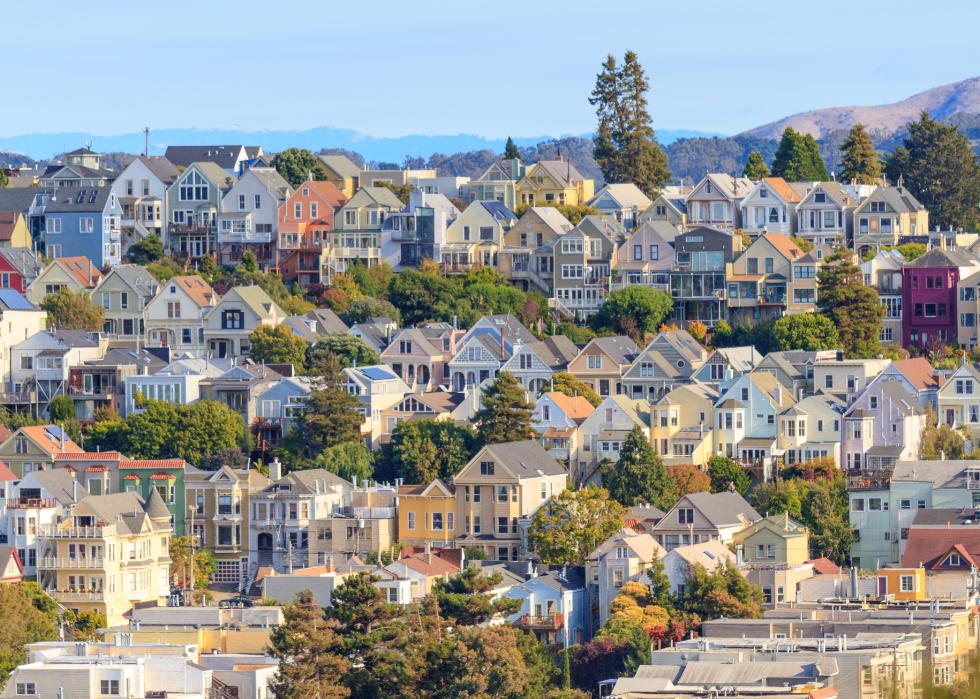
California
- Total housing units: 14,367,012
--- Occupied housing units: 13,157,873 (54.9% owner-occupied, 45.1% renter-occupied)
--- Vacant housing units: 1,209,139 (1.2% homeowner vacancy rate, 4.1% rental vacancy rate)
- Median rooms per house: 5.0
- Bedrooms: 4.5% no bedrooms, 13.8% one bedroom, 27.1% two bedrooms, 33.2% three bedrooms, 17.1% four bedrooms, 4.3% five bedrooms
- Average household size: 2.9
- Median gross rent: $1,614
- Median homeowner cost: $2,421 (with mortgage), $622 (without mortgage)
- Average days homes are on the market: 66 (308,867 homes currently)
- Current median listing price of homes in California: $525,000 (7.9% less than 2020, 5.0% greater than 2019)
While prices across California remained relatively stable through 2020, the main issue appears to be inventory. Experts point out that the number of listings available in most California counties is the lowest since 2004. Once consumers are ready to return to normal buying, there may be a severe shortage of homes available.
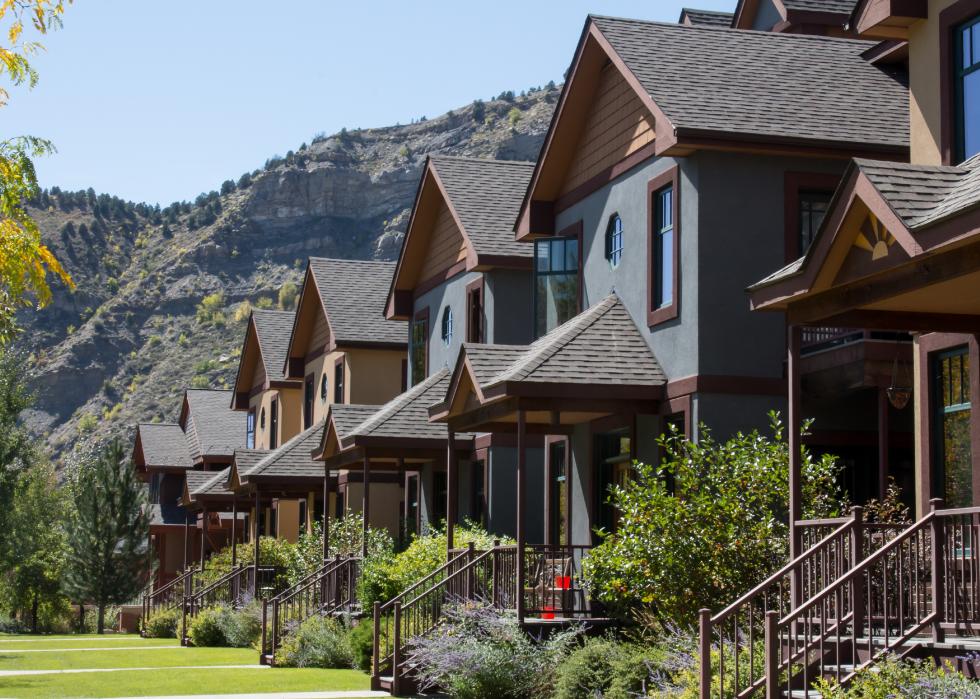
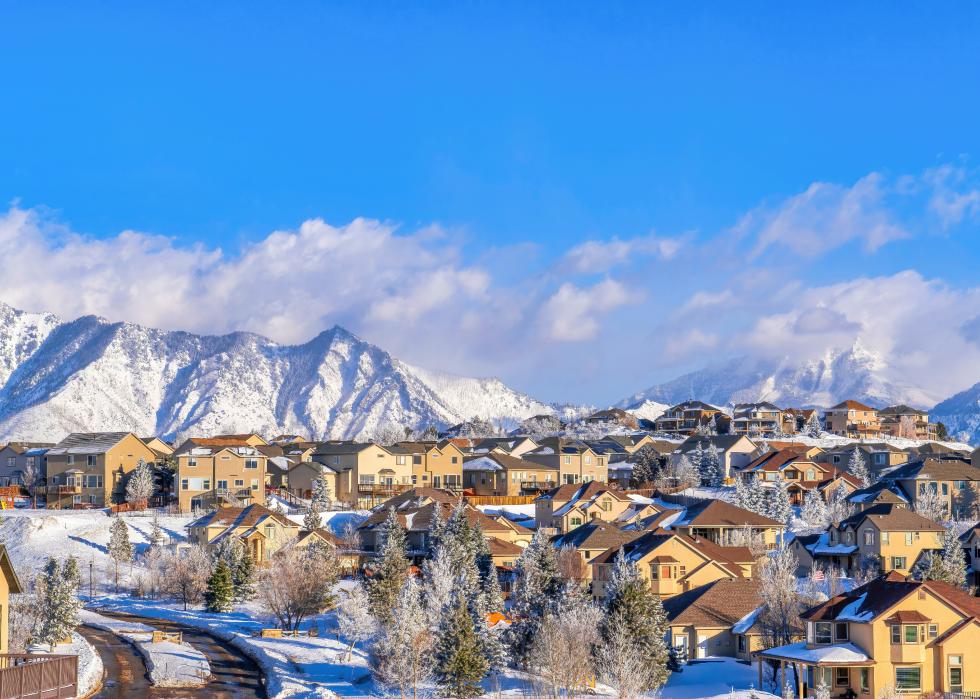
Colorado
- Total housing units: 2,464,109
--- Occupied housing units: 2,235,103 (65.9% owner-occupied, 34.1% renter-occupied)
--- Vacant housing units: 229,006 (1.0% homeowner vacancy rate, 4.6% rental vacancy rate)
- Median rooms per house: 5.7
- Bedrooms: 2.3% no bedrooms, 11.8% one bedroom, 24.3% two bedrooms, 33.0% three bedrooms, 19.8% four bedrooms, 8.7% five bedrooms
- Average household size: 2.5
- Median gross rent: $1,369
- Median homeowner cost: $1,845 (with mortgage), $495 (without mortgage)
- Average days homes are on the market: 65 (93,894 homes currently)
- Current median listing price of homes in Colorado: $385,000 (6.1% less than 2020, 4.2% greater than 2019)
In Colorado, there were more buyers than there were houses in 2020, causing home prices to increase exponentially. Record-low home inventory, fewer days on the market, and homes selling at or above asking price are no longer unusual for the Centennial State.
Connecticut
- Total housing units: 1,524,959
--- Occupied housing units: 1,377,166 (65.0% owner-occupied, 35.0% renter-occupied)
--- Vacant housing units: 147,793 (1.5% homeowner vacancy rate, 6.4% rental vacancy rate)
- Median rooms per house: 5.6
- Bedrooms: 2.2% no bedrooms, 13.0% one bedroom, 27.1% two bedrooms, 35.7% three bedrooms, 17.4% four bedrooms, 4.6% five bedrooms
- Average household size: 2.5
- Median gross rent: $1,177
- Median homeowner cost: $2,087 (with mortgage), $912 (without mortgage)
- Average days homes are on the market: 81 (32,604 homes currently)
- Current median listing price of homes in Connecticut: $262,900 (9.0% less than 2020, 9.6% greater than 2019)
Despite the pandemic, homes in Connecticut’s pricier neighborhoods benefited from a sales boom in 2020, due in part to New Yorkers moving to the state. Experts predict that the trend will continue in 2021 as city residents set their sights on new homes in the suburbs.
Delaware
- Total housing units: 443,764
--- Occupied housing units: 376,239 (70.3% owner-occupied, 29.7% renter-occupied)
--- Vacant housing units: 67,525 (1.8% homeowner vacancy rate, 6.6% rental vacancy rate)
- Median rooms per house: 6.2
- Bedrooms: 1.3% no bedrooms, 7.1% one bedroom, 20.1% two bedrooms, 45.5% three bedrooms, 21.7% four bedrooms, 4.4% five bedrooms
- Average household size: 2.5
- Median gross rent: $1,116
- Median homeowner cost: $1,557 (with mortgage), $463 (without mortgage)
- Average days homes are on the market: 84 (6,778 homes currently)
- Current median listing price of homes in Delaware: $259,900 (10.3% less than 2020, 4.0% greater than 2019)
The price per square foot for the average Delaware home has increased about 25% since last year, with the average home receiving three offers before it sells. Delaware’s central location, tax advantages, and semi-affordable real estate has baby boomers eyeing the state, but prices will continue to increase as demand for homes goes up.
Florida
- Total housing units: 9,674,053
--- Occupied housing units: 7,905,832 (66.2% owner-occupied, 33.8% renter-occupied)
--- Vacant housing units: 1,768,221 (2.3% homeowner vacancy rate, 8.7% rental vacancy rate)
- Median rooms per house: 5.1
- Bedrooms: 2.1% no bedrooms, 10.2% one bedroom, 32.5% two bedrooms, 38.3% three bedrooms, 14.0% four bedrooms, 2.9% five bedrooms
- Average household size: 2.7
- Median gross rent: $1,238
- Median homeowner cost: $1,530 (with mortgage), $512 (without mortgage)
- Average days homes are on the market: 83 (301,333 homes currently)
- Current median listing price of homes in Florida: $250,000 (10.7% less than 2020, 2.5% greater than 2019)
Those looking to escape cold weather and state income taxes in 2020 were flocking to Florida, according to realtors in the Sunshine State. Sales in 2020 were 24% higher than the year prior, with the median home sale price increasing 17%.
Georgia
- Total housing units: 4,378,350
--- Occupied housing units: 3,852,714 (64.1% owner-occupied, 35.9% renter-occupied)
--- Vacant housing units: 525,636 (1.9% homeowner vacancy rate, 7.3% rental vacancy rate)
- Median rooms per house: 5.9
- Bedrooms: 1.6% no bedrooms, 7.7% one bedroom, 21.5% two bedrooms, 42.2% three bedrooms, 19.7% four bedrooms, 7.3% five bedrooms
- Average household size: 2.7
- Median gross rent: $1,049
- Median homeowner cost: $1,450 (with mortgage), $431 (without mortgage)
- Average days homes are on the market: 71 (102,977 homes currently)
- Current median listing price of homes in Georgia: $240,000 (7.7% less than 2020, 4.3% greater than 2019)
Coupled with an above-average population growth, home values in Georgia—and more specifically, Atlanta—are continuing to rise as demand for available homes grows. With a median home value under $200,000, Georgia is attractive for first-time homebuyers and those interested in lowering mortgage costs in 2021.
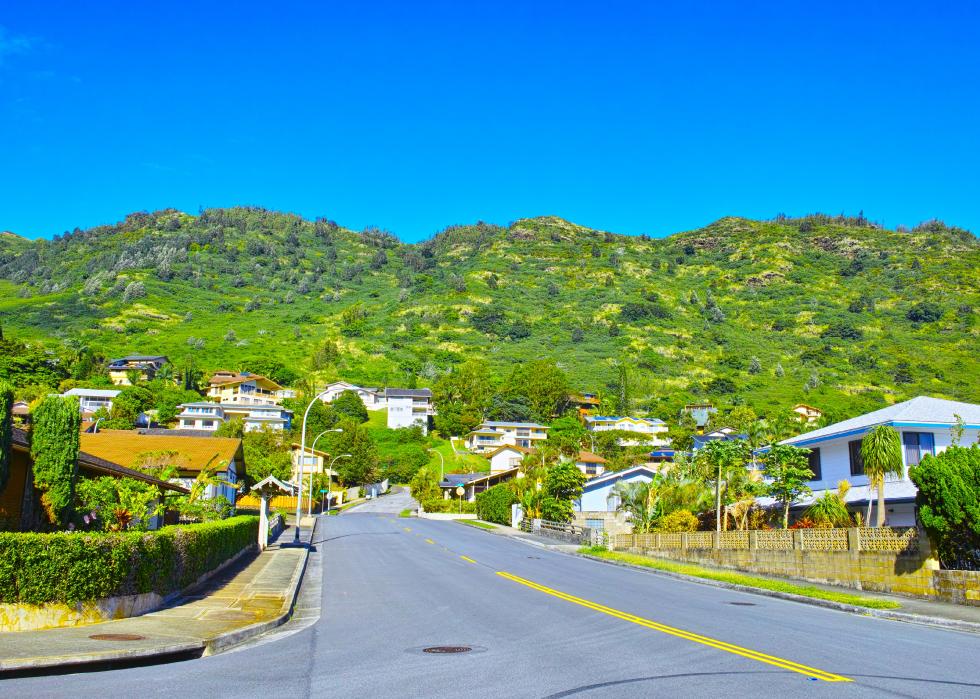
Hawaii
- Total housing units: 550,328
--- Occupied housing units: 465,299 (60.2% owner-occupied, 39.8% renter-occupied)
--- Vacant housing units: 85,029 (1.4% homeowner vacancy rate, 8.8% rental vacancy rate)
- Median rooms per house: 4.6
- Bedrooms: 6.3% no bedrooms, 12.3% one bedroom, 26.4% two bedrooms, 34.7% three bedrooms, 15.2% four bedrooms, 5.1% five bedrooms
- Average household size: 3.0
- Median gross rent: $1,651
- Median homeowner cost: $2,472 (with mortgage), $542 (without mortgage)
- Average days homes are on the market: 88 (8,402 homes currently)
- Current median listing price of homes in Hawaii: $599,000 (6.4% less than 2020, 5.1% greater than 2019)
With many landlords in Hawaii concerned about renters who haven’t been paying due to a moratorium on evictions during the pandemic, those selling homes in Hawaii are happy with the market. Homebuyers are regularly offering over asking price in order to call Hawaii home. Interest rates are lower, so even though prices may be higher, buyers end up paying less for their monthly mortgages.
Idaho
- Total housing units: 751,113
--- Occupied housing units: 655,859 (71.6% owner-occupied, 28.4% renter-occupied)
--- Vacant housing units: 95,254 (1.3% homeowner vacancy rate, 4.0% rental vacancy rate)
- Median rooms per house: 5.8
- Bedrooms: 1.8% no bedrooms, 6.3% one bedroom, 23.0% two bedrooms, 40.5% three bedrooms, 20.0% four bedrooms, 8.5% five bedrooms
- Average household size: 2.7
- Median gross rent: $880
- Median homeowner cost: $1,306 (with mortgage), $380 (without mortgage)
- Average days homes are on the market: 64 (25,967 homes currently)
- Current median listing price of homes in Idaho: $288,900 (15.0% less than 2020, 5.1% greater than 2019)
In 2020, several counties in Idaho broke median home price records. Some areas saw homes sell in four-to-five days, and inventory was so low that only hundreds of houses were available, instead of the typical thousands. The outlook isn’t as rosy for new Idaho buyers in 2021, as mortgage rates are predicted to increase along with home prices.
Illinois
- Total housing units: 5,388,210
--- Occupied housing units: 4,866,006 (66.0% owner-occupied, 34.0% renter-occupied)
--- Vacant housing units: 522,204 (1.7% homeowner vacancy rate, 5.7% rental vacancy rate)
- Median rooms per house: 5.6
- Bedrooms: 2.8% no bedrooms, 11.6% one bedroom, 28.4% two bedrooms, 36.4% three bedrooms, 16.4% four bedrooms, 4.4% five bedrooms
- Average household size: 2.5
- Median gross rent: $1,020
- Median homeowner cost: $1,688 (with mortgage), $641 (without mortgage)
- Average days homes are on the market: 95 (100,878 homes currently)
- Current median listing price of homes in Illinois: $219,000 (8.7% less than 2020, 10.9% greater than 2019)
Single-family homes and condos remain the most popular buys for those looking to settle down in Illinois. The number of homes sold statewide increased 35% between 2019 and 2020, while the statewide median home price increased 17%. The median price of a home in Chicago increased 15% to $315,000.
Indiana
- Total housing units: 2,921,115
--- Occupied housing units: 2,597,765 (69.3% owner-occupied, 30.7% renter-occupied)
--- Vacant housing units: 323,350 (1.3% homeowner vacancy rate, 6.9% rental vacancy rate)
- Median rooms per house: 5.8
- Bedrooms: 1.5% no bedrooms, 9.0% one bedroom, 25.4% two bedrooms, 43.8% three bedrooms, 16.4% four bedrooms, 4.0% five bedrooms
- Average household size: 2.5
- Median gross rent: $840
- Median homeowner cost: $1,146 (with mortgage), $416 (without mortgage)
- Average days homes are on the market: 70 (61,595 homes currently)
- Current median listing price of homes in Indiana: $179,900 (6.3% less than 2020, 4.0% greater than 2019)
Homes have been selling so fast in Indiana that there’s less than a month’s worth of inventory on the market—some homes are selling within hours of listing. The Hoosier State is also seeing more people staying in place with a refinance, while typical renters are looking to purchase instead of rent.
Iowa
- Total housing units: 1,418,600
--- Occupied housing units: 1,287,221 (70.5% owner-occupied, 29.5% renter-occupied)
--- Vacant housing units: 131,379 (1.4% homeowner vacancy rate, 6.2% rental vacancy rate)
- Median rooms per house: 5.9
- Bedrooms: 1.9% no bedrooms, 8.9% one bedroom, 27.6% two bedrooms, 38.4% three bedrooms, 17.7% four bedrooms, 5.5% five bedrooms
- Average household size: 2.4
- Median gross rent: $808
- Median homeowner cost: $1,266 (with mortgage), $503 (without mortgage)
- Average days homes are on the market: 81 (17,261 homes currently)
- Current median listing price of homes in Iowa: $178,000 (6.3% less than 2020, 4.8% greater than 2019)
Realtors in Des Moines are seeing an increase in upsizing of homes. Homeowners who purchased homes in the last few years are already buying bigger ones now that the interest rates are lower. Tech companies in the city have also attracted a younger, first-time buyer who may be influenced by parents to purchase a home.
Kansas
- Total housing units: 1,288,430
--- Occupied housing units: 1,138,329 (66.5% owner-occupied, 33.5% renter-occupied)
--- Vacant housing units: 150,101 (1.8% homeowner vacancy rate, 7.8% rental vacancy rate)
- Median rooms per house: 6.0
- Bedrooms: 2.1% no bedrooms, 9.1% one bedroom, 26.1% two bedrooms, 36.7% three bedrooms, 19.2% four bedrooms, 6.9% five bedrooms
- Average household size: 2.5
- Median gross rent: $862
- Median homeowner cost: $1,387 (with mortgage), $513 (without mortgage)
- Average days homes are on the market: 65 (20,532 homes currently)
- Current median listing price of homes in Kansas: $225,000 (8.2% less than 2020, 2.3% greater than 2019)
Demand for Kansas real estate is strong, but experts predict that home sales will decline in 2021 due to higher unemployment and lower inventory throughout the state. Meanwhile, home prices will continue to increase, and new home construction will strive to bring more homes onto the market in the coming years.
Kentucky
- Total housing units: 2,006,335
--- Occupied housing units: 1,748,732 (67.0% owner-occupied, 33.0% renter-occupied)
--- Vacant housing units: 257,603 (1.6% homeowner vacancy rate, 6.4% rental vacancy rate)
- Median rooms per house: 5.6
- Bedrooms: 1.6% no bedrooms, 8.4% one bedroom, 26.4% two bedrooms, 44.6% three bedrooms, 15.0% four bedrooms, 4.0% five bedrooms
- Average household size: 2.5
- Median gross rent: $773
- Median homeowner cost: $1,179 (with mortgage), $372 (without mortgage)
- Average days homes are on the market: 75 (21,941 homes currently)
- Current median listing price of homes in Kentucky: $189,900 (7.4% less than 2020, 5.6% greater than 2019)
Record-low home inventory currently exists in Kentucky, with a statewide average home price of $224,195. While foreclosures and short sales were also down significantly for 2020, the future is uncertain since programs to extend mortgage forbearance are set to expire soon.
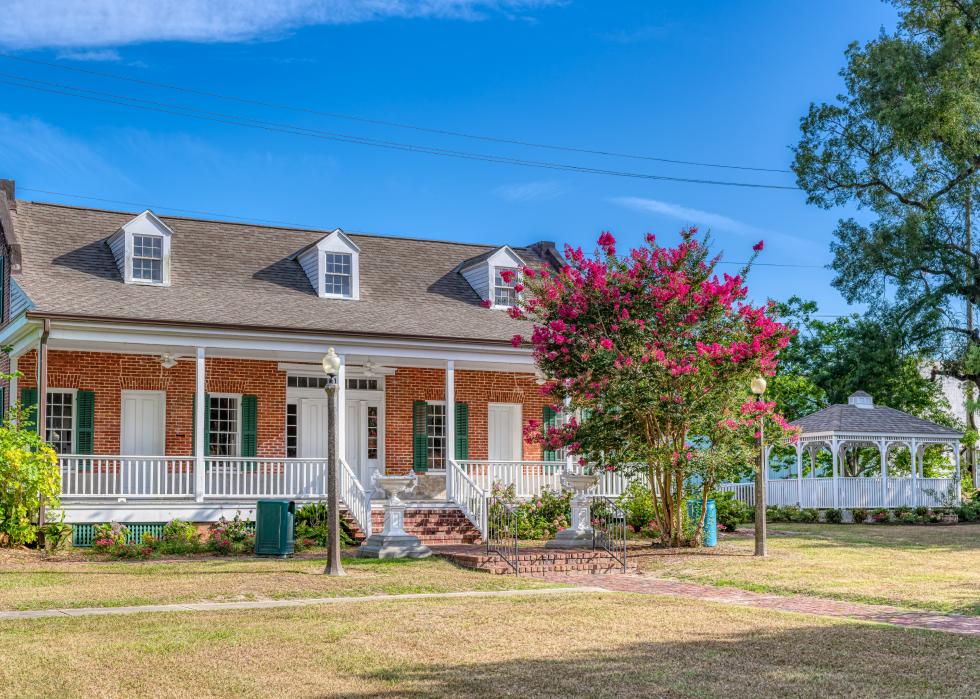
Louisiana
- Total housing units: 2,089,824
--- Occupied housing units: 1,741,076 (66.5% owner-occupied, 33.5% renter-occupied)
--- Vacant housing units: 348,748 (1.9% homeowner vacancy rate, 8.3% rental vacancy rate)
- Median rooms per house: 5.4
- Bedrooms: 1.5% no bedrooms, 8.6% one bedroom, 24.0% two bedrooms, 48.4% three bedrooms, 15.2% four bedrooms, 2.3% five bedrooms
- Average household size: 2.6
- Median gross rent: $866
- Median homeowner cost: $1,279 (with mortgage), $342 (without mortgage)
- Average days homes are on the market: 80 (23,942 homes currently)
- Current median listing price of homes in Louisiana: $207,500 (7.8% less than 2020, 3.8% greater than 2019)
Homebuyers are migrating to some populated areas of Louisiana (Acadiana and Lafayette Parish both broke records for real estate sales in 2020). However, there also appear to be areas of Louisiana that residents are actively leaving due to hurricane damage and the threat of future effects of climate change.
Maine
- Total housing units: 750,964
--- Occupied housing units: 573,618 (72.2% owner-occupied, 27.8% renter-occupied)
--- Vacant housing units: 177,346 (1.6% homeowner vacancy rate, 5.0% rental vacancy rate)
- Median rooms per house: 5.4
- Bedrooms: 2.8% no bedrooms, 11.6% one bedroom, 29.5% two bedrooms, 38.7% three bedrooms, 13.4% four bedrooms, 4.0% five bedrooms
- Average household size: 2.3
- Median gross rent: $870
- Median homeowner cost: $1,387 (with mortgage), $510 (without mortgage)
- Average days homes are on the market: 75 (8,563 homes currently)
- Current median listing price of homes in Maine: $250,000 (10.4% less than 2020, 4.2% greater than 2019)
Home sales in Maine increased by about 27% between October 2019 and 2020, with 25% of new homes purchased by out-of-state buyers. In Maine, an average home can sell for between $180,000 and $250,000, with multiple offers on each sale.
Maryland
- Total housing units: 2,470,307
--- Occupied housing units: 2,226,767 (66.8% owner-occupied, 33.2% renter-occupied)
--- Vacant housing units: 243,540 (1.4% homeowner vacancy rate, 6.3% rental vacancy rate)
- Median rooms per house: 6.2
- Bedrooms: 2.0% no bedrooms, 10.1% one bedroom, 21.6% two bedrooms, 36.2% three bedrooms, 21.9% four bedrooms, 8.1% five bedrooms
- Average household size: 2.7
- Median gross rent: $1,401
- Median homeowner cost: $2,015 (with mortgage), $613 (without mortgage)
- Average days homes are on the market: 86 (54,001 homes currently)
- Current median listing price of homes in Maryland: $315,000 (8.7% less than 2020, 5.0% greater than 2019)
Sellers in Maryland are enjoying record-high prices and less time on the market once homes go up for sale. Some cities in Maryland, like Baltimore and Elkridge, have been faring better than others, with nearly 1,000 homes selling per month in some places.
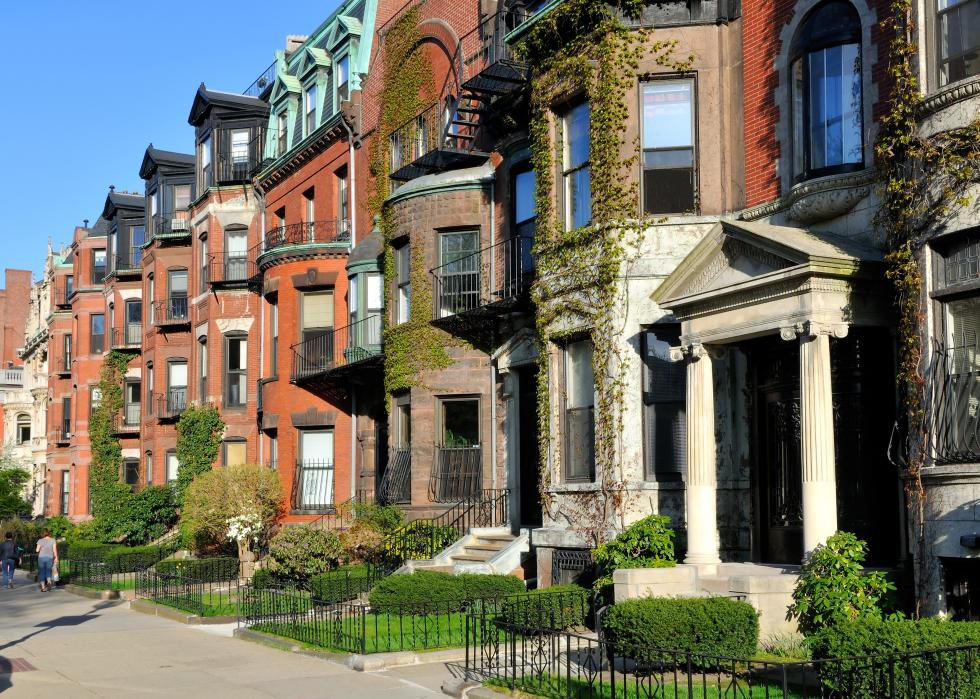
Massachusetts
- Total housing units: 2,928,818
--- Occupied housing units: 2,650,680 (62.2% owner-occupied, 37.8% renter-occupied)
--- Vacant housing units: 278,138 (1.1% homeowner vacancy rate, 3.1% rental vacancy rate)
- Median rooms per house: 5.5
- Bedrooms: 2.6% no bedrooms, 14.2% one bedroom, 27.7% two bedrooms, 34.6% three bedrooms, 16.5% four bedrooms, 4.4% five bedrooms
- Average household size: 2.5
- Median gross rent: $1,360
- Median homeowner cost: $2,276 (with mortgage), $828 (without mortgage)
- Average days homes are on the market: 75 (49,519 homes currently)
- Current median listing price of homes in Massachusetts: $419,900 (6.5% less than 2020, 5.2% greater than 2019)
Statewide home sales were up 1.5% over 2019’s tally in Massachusetts. With COVID vaccines being distributed and low interest rates still attainable, many experts are predicting a 2021 real estate market that’s even better than that of 2020.
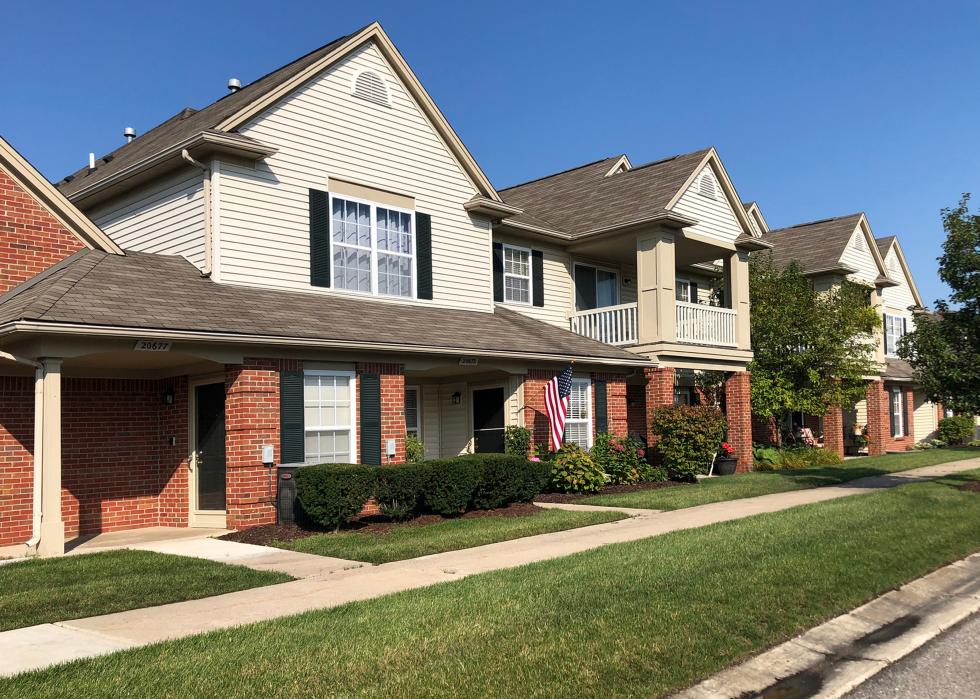
Michigan
- Total housing units: 4,629,605
--- Occupied housing units: 3,969,880 (71.6% owner-occupied, 28.4% renter-occupied)
--- Vacant housing units: 659,725 (1.4% homeowner vacancy rate, 5.6% rental vacancy rate)
- Median rooms per house: 5.8
- Bedrooms: 1.7% no bedrooms, 9.0% one bedroom, 25.2% two bedrooms, 43.8% three bedrooms, 16.5% four bedrooms, 3.9% five bedrooms
- Average household size: 2.5
- Median gross rent: $888
- Median homeowner cost: $1,285 (with mortgage), $487 (without mortgage)
- Average days homes are on the market: 83 (77,380 homes currently)
- Current median listing price of homes in Michigan: $189,900 (12.4% less than 2020, 6.1% greater than 2019)
Some Michiganders have been perfectly happy taking advantage of low interest rates and refinancing their homes this past year. Others are looking at their new work-life situations and realizing they can live somewhere larger and farther away from work now that they’re working remotely. Low inventory in Michigan means that buyers have to act fast if they see a home they like and want to purchase.
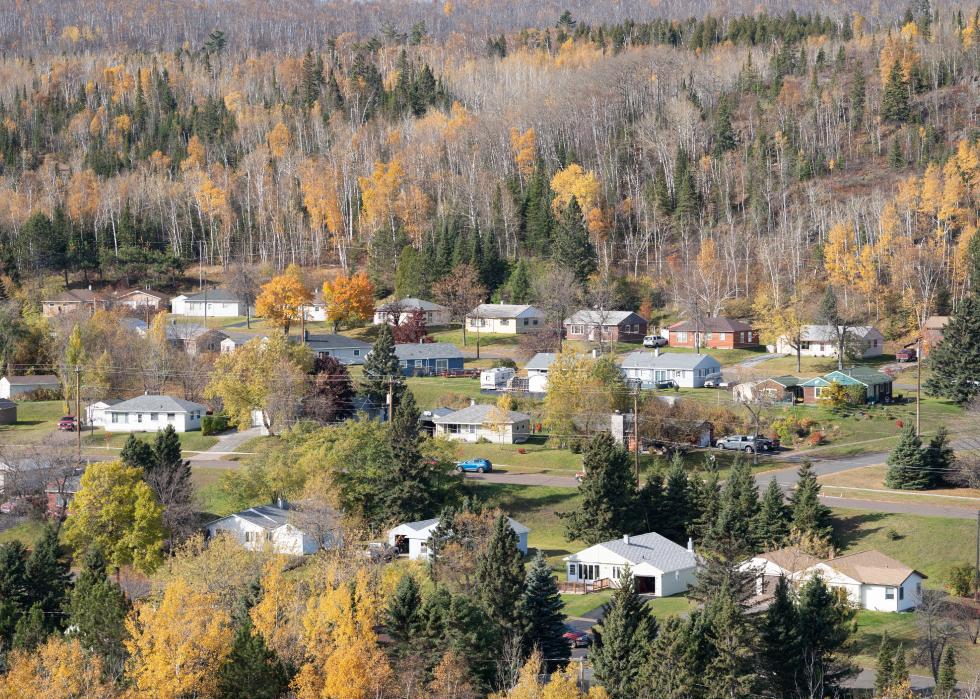
Minnesota
- Total housing units: 2,477,515
--- Occupied housing units: 2,222,568 (71.9% owner-occupied, 28.1% renter-occupied)
--- Vacant housing units: 254,947 (0.8% homeowner vacancy rate, 4.8% rental vacancy rate)
- Median rooms per house: 6.0
- Bedrooms: 2.4% no bedrooms, 11.5% one bedroom, 25.2% two bedrooms, 32.5% three bedrooms, 21.7% four bedrooms, 6.8% five bedrooms
- Average household size: 2.5
- Median gross rent: $1,016
- Median homeowner cost: $1,595 (with mortgage), $552 (without mortgage)
- Average days homes are on the market: 84 (54,742 homes currently)
- Current median listing price of homes in Minnesota: $255,000 (7.2% less than 2020, 4.1% greater than 2019)
Similar to the rest of the nation, Minnesota felt a dip in home sales at the start of the Spring 2020 lockdown, but sales quickly recovered. Fast sales, higher prices than ever, and limited quantities of homes are all driving the rush to purchase in the Twin Cities and around the state. First-time homebuyers may also qualify for loan assistance from the Minnesota Housing Finance Agency.
Mississippi
- Total housing units: 1,339,047
--- Occupied housing units: 1,100,229 (67.3% owner-occupied, 32.7% renter-occupied)
--- Vacant housing units: 238,818 (2.2% homeowner vacancy rate, 10.7% rental vacancy rate)
- Median rooms per house: 5.6
- Bedrooms: 1.8% no bedrooms, 5.7% one bedroom, 21.9% two bedrooms, 52.8% three bedrooms, 15.1% four bedrooms, 2.6% five bedrooms
- Average household size: 2.6
- Median gross rent: $777
- Median homeowner cost: $1,149 (with mortgage), $352 (without mortgage)
- Average days homes are on the market: 76 (6,132 homes currently)
- Current median listing price of homes in Mississippi: $187,500 (10.7% less than 2020, 3.0% greater than 2019)
Thanks to low prices, low cost of living, and low home inventory, buyers should already have pre-approval and be ready to pounce if they see a home they want in Mississippi. Homes under $200,000 have multiple offers, and at the start of 2021, there were just under 600 homes for sale in popular counties such as Hinds, Madison, and Rankin.
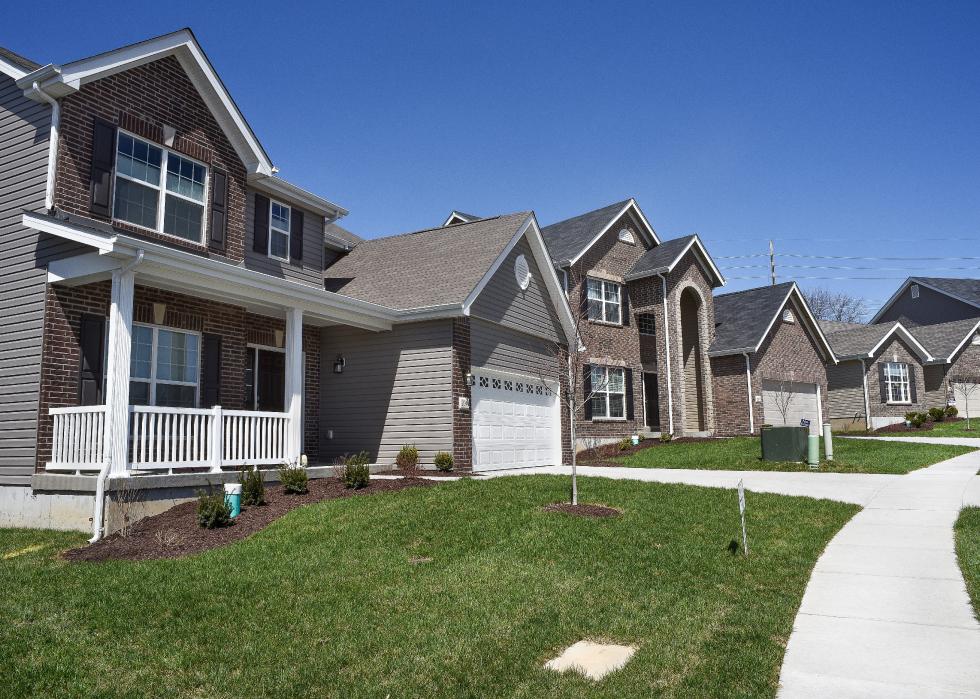
Missouri
- Total housing units: 2,819,334
--- Occupied housing units: 2,458,337 (67.1% owner-occupied, 32.9% renter-occupied)
--- Vacant housing units: 360,997 (1.4% homeowner vacancy rate, 5.1% rental vacancy rate)
- Median rooms per house: 5.6
- Bedrooms: 2.1% no bedrooms, 9.3% one bedroom, 27.2% two bedrooms, 41.2% three bedrooms, 16.0% four bedrooms, 4.2% five bedrooms
- Average household size: 2.4
- Median gross rent: $834
- Median homeowner cost: $1,271 (with mortgage), $446 (without mortgage)
- Average days homes are on the market: 70 (44,984 homes currently)
- Current median listing price of homes in Missouri: $185,000 (6.6% less than 2020, 2.8% greater than 2019)
St. Louis is said to have one of the best price-to-rent ratios for real estate investors. This could be why more international real estate investors made moves in the city during 2020, according to Global Investments. The median home price in St. Louis currently stands just under $132,000.
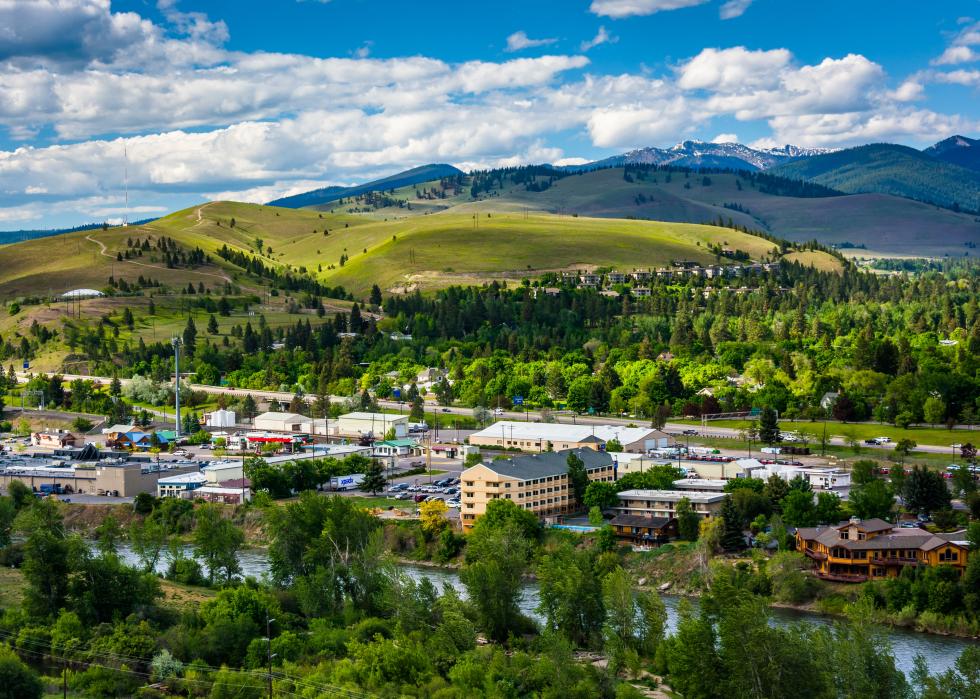
Montana
- Total housing units: 519,938
--- Occupied housing units: 437,651 (68.9% owner-occupied, 31.1% renter-occupied)
--- Vacant housing units: 82,287 (1.6% homeowner vacancy rate, 7.1% rental vacancy rate)
- Median rooms per house: 5.5
- Bedrooms: 3.0% no bedrooms, 9.9% one bedroom, 27.5% two bedrooms, 36.3% three bedrooms, 16.5% four bedrooms, 6.9% five bedrooms
- Average household size: 2.4
- Median gross rent: $831
- Median homeowner cost: $1,466 (with mortgage), $450 (without mortgage)
- Average days homes are on the market: 76 (9,096 homes currently)
- Current median listing price of homes in Montana: $267,900 (7.3% less than 2020, 5.1% greater than 2019)
High-end real estate buyers from California, Texas, and the East Coast have been flocking to Montana over the past year, gobbling up luxury properties that had been sitting on the market for months or even years before the pandemic hit. Wages brought from the city can purchase a large ranch in Montana, which is exactly what some buyers want.
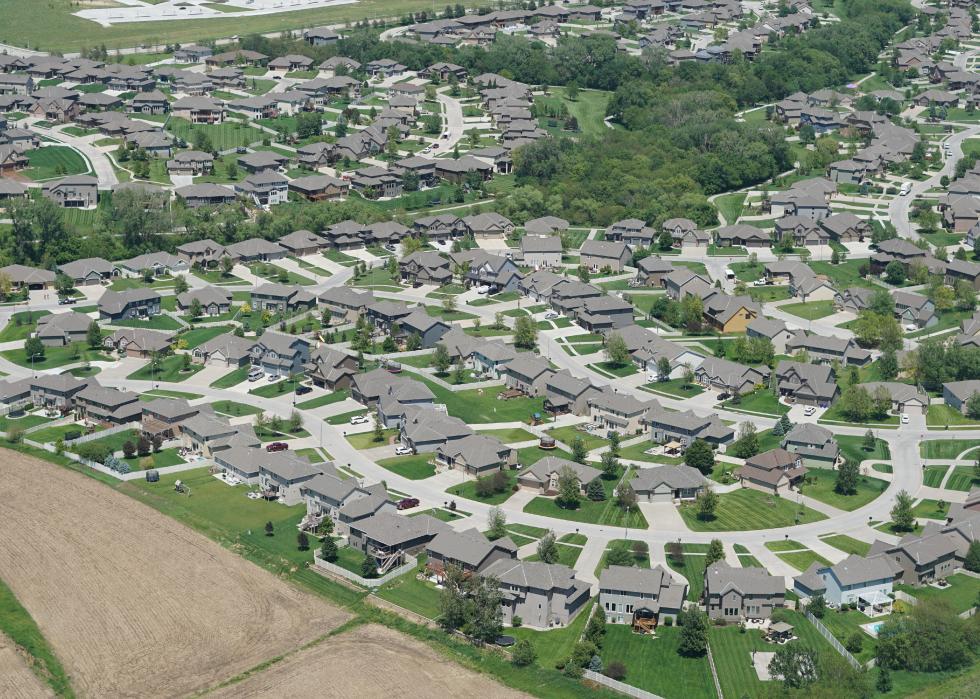
Nebraska
- Total housing units: 851,167
--- Occupied housing units: 771,444 (66.3% owner-occupied, 33.7% renter-occupied)
--- Vacant housing units: 79,723 (0.7% homeowner vacancy rate, 5.9% rental vacancy rate)
- Median rooms per house: 6.1
- Bedrooms: 1.6% no bedrooms, 10.9% one bedroom, 25.4% two bedrooms, 36.5% three bedrooms, 18.8% four bedrooms, 6.7% five bedrooms
- Average household size: 2.4
- Median gross rent: $859
- Median homeowner cost: $1,427 (with mortgage), $535 (without mortgage)
- Average days homes are on the market: 72 (13,141 homes currently)
- Current median listing price of homes in Nebraska: $199,999 (7.0% less than 2020, 2.6% greater than 2019)
With 39% of homes selling above list price and only a month’s worth of homes available at any one time, Nebraska had one of the most competitive real estate markets in 2020. Experts predict that the market will continue to grow in Nebraska as millennials purchase their first homes and properties are resold to take advantage of low interest rates.
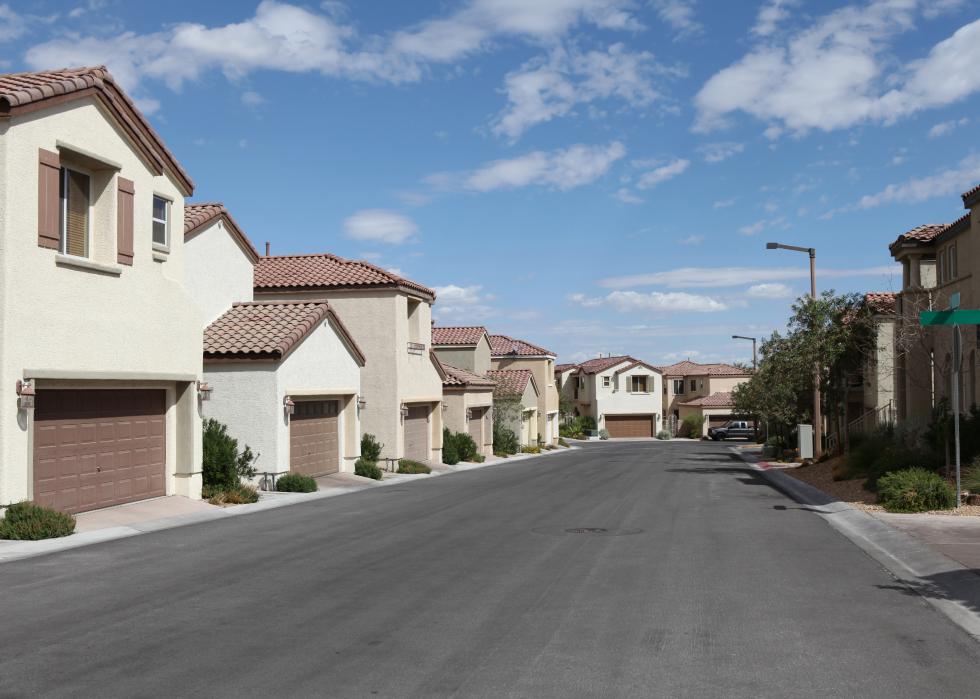
Nevada
- Total housing units: 1,285,681
--- Occupied housing units: 1,143,557 (56.6% owner-occupied, 43.4% renter-occupied)
--- Vacant housing units: 142,124 (1.6% homeowner vacancy rate, 7.6% rental vacancy rate)
- Median rooms per house: 5.1
- Bedrooms: 3.4% no bedrooms, 10.3% one bedroom, 26.0% two bedrooms, 37.4% three bedrooms, 18.2% four bedrooms, 4.7% five bedrooms
- Average household size: 2.7
- Median gross rent: $1,168
- Median homeowner cost: $1,589 (with mortgage), $423 (without mortgage)
- Average days homes are on the market: 69 (43,579 homes currently)
- Current median listing price of homes in Nevada: $309,500 (6.2% less than 2020, 3.2% greater than 2019)
Las Vegas saw an influx of Southern Californians after the initial lockdown in Spring 2020. While some older sellers in Nevada may have waited to sell due to fears of buyers touring their homes and spreading the coronavirus, once they are vaccinated, more homes may come onto the market.
New Hampshire
- Total housing units: 642,298
--- Occupied housing units: 541,396 (71.0% owner-occupied, 29.0% renter-occupied)
--- Vacant housing units: 100,902 (0.8% homeowner vacancy rate, 4.5% rental vacancy rate)
- Median rooms per house: 5.5
- Bedrooms: 2.7% no bedrooms, 11.0% one bedroom, 30.7% two bedrooms, 37.1% three bedrooms, 15.1% four bedrooms, 3.5% five bedrooms
- Average household size: 2.4
- Median gross rent: $1,147
- Median homeowner cost: $1,963 (with mortgage), $819 (without mortgage)
- Average days homes are on the market: 70 (11,464 homes currently)
- Current median listing price of homes in New Hampshire: $299,900 (7.7% less than 2020, 3.8% greater than 2019)
Sales of homes in New Hampshire were 44% higher in November 2020 than in the year prior. Single-family homes had a median price of $351,000 that month. Affordability sunk, and bidding wars are now commonplace in the Granite State. In the state’s lowest-priced Coos County, prices increased 51%, forcing the median home price up to $136,000.
New Jersey
- Total housing units: 3,641,854
--- Occupied housing units: 3,286,264 (63.3% owner-occupied, 36.7% renter-occupied)
--- Vacant housing units: 355,590 (1.4% homeowner vacancy rate, 4.2% rental vacancy rate)
- Median rooms per house: 5.7
- Bedrooms: 3.0% no bedrooms, 14.0% one bedroom, 25.4% two bedrooms, 32.1% three bedrooms, 19.7% four bedrooms, 5.9% five bedrooms
- Average household size: 2.7
- Median gross rent: $1,376
- Median homeowner cost: $2,413 (with mortgage), $1,043 (without mortgage)
- Average days homes are on the market: 103 (64,645 homes currently)
- Current median listing price of homes in New Jersey: $329,900 (8.8% less than 2020, 3.1% greater than 2019)
In New Jersey, homebuyers leaving New York for a more relaxing way of life may expect they’ll be working remotely for the foreseeable future. In fact, some of the hottest markets in New Jersey—Sussex, Monmouth, and Cape May—do not have easy access to New York, according to NJ Monthly. Young families needing space for their kids to roam and millennials taking advantage of low interest rates comprise two more demographics moving into New Jersey suburbs this year.
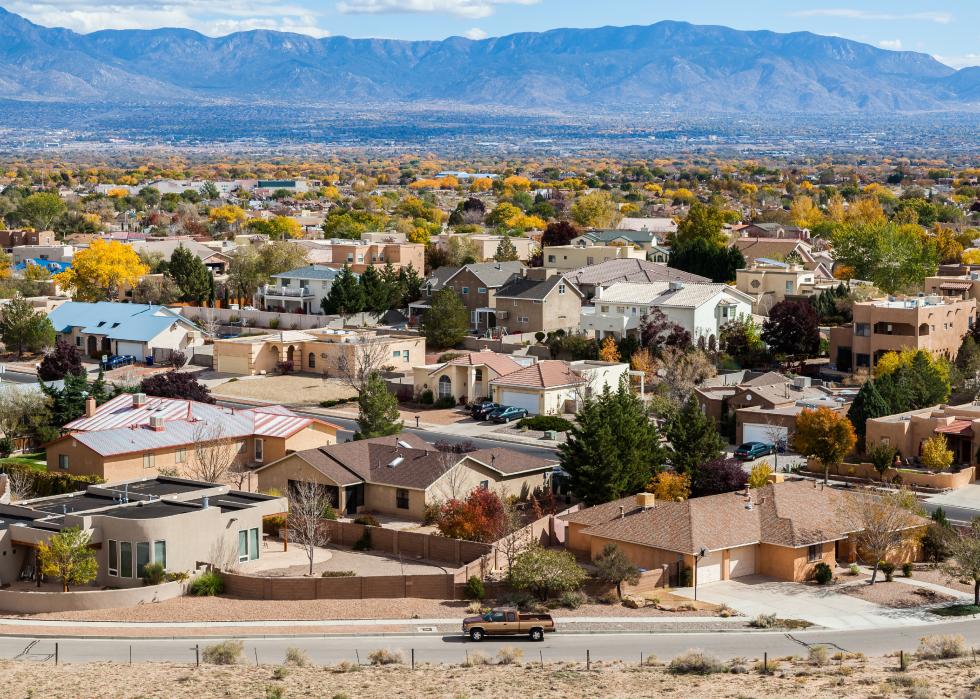
New Mexico
- Total housing units: 948,470
--- Occupied housing units: 793,420 (68.1% owner-occupied, 31.9% renter-occupied)
--- Vacant housing units: 155,050 (1.9% homeowner vacancy rate, 8.1% rental vacancy rate)
- Median rooms per house: 5.3
- Bedrooms: 3.0% no bedrooms, 8.4% one bedroom, 25.4% two bedrooms, 46.2% three bedrooms, 14.8% four bedrooms, 2.3% five bedrooms
- Average household size: 2.6
- Median gross rent: $847
- Median homeowner cost: $1,269 (with mortgage), $350 (without mortgage)
- Average days homes are on the market: 71 (16,115 homes currently)
- Current median listing price of homes in New Mexico: $219,900 (6.4% less than 2020, 3.7% greater than 2019)
As home sales and prices continue to rise in New Mexico, realtors are noticing buyers interested in multigenerational homes and sellers who are selling because they want something larger. Safety measures, such as virtual tours, masks, and social distancing, are in place to help buyers and sellers feel safe negotiating a home sale or purchase during stay-at-home orders.
New York
- Total housing units: 8,404,205
--- Occupied housing units: 7,446,812 (53.5% owner-occupied, 46.5% renter-occupied)
--- Vacant housing units: 957,393 (1.6% homeowner vacancy rate, 4.0% rental vacancy rate)
- Median rooms per house: 5.0
- Bedrooms: 4.9% no bedrooms, 18.6% one bedroom, 26.9% two bedrooms, 31.3% three bedrooms, 13.7% four bedrooms, 4.6% five bedrooms
- Average household size: 2.5
- Median gross rent: $1,309
- Median homeowner cost: $2,156 (with mortgage), $781 (without mortgage)
- Average days homes are on the market: 108 (48,990 homes currently)
- Current median listing price of homes in New York: $269,000 (20.9% less than 2020, 8.5% greater than 2019)
When COVID-19 hit, many people fled to the outer boroughs, feeling it was safer than living in Manhattan. This drove up the price of homes in Brooklyn and Queens and created a few deals for those willing to stick it out in the Big Apple, according to The New York Times. Sales of homes in New York’s suburbs hit a peak in 2020, but analysts say it may be leveling out now.
North Carolina
- Total housing units: 4,748,148
--- Occupied housing units: 4,046,348 (65.3% owner-occupied, 34.7% renter-occupied)
--- Vacant housing units: 701,800 (1.6% homeowner vacancy rate, 6.6% rental vacancy rate)
- Median rooms per house: 5.5
- Bedrooms: 1.6% no bedrooms, 6.8% one bedroom, 25.1% two bedrooms, 46.4% three bedrooms, 15.8% four bedrooms, 4.2% five bedrooms
- Average household size: 2.5
- Median gross rent: $931
- Median homeowner cost: $1,318 (with mortgage), $398 (without mortgage)
- Average days homes are on the market: 70 (102,523 homes currently)
- Current median listing price of homes in North Carolina: $235,000 (4.1% less than 2020, 4.4% greater than 2019)
In North Carolina’s Triangle region (Raleigh, Durham, Chapel Hill) and Charlotte, prices continue to rise to meet demand. As homebuilders struggle to keep up with rising material costs and resale homes sell for above asking price, the area will continue to be a seller’s market further into 2021, according to realtors.
North Dakota
- Total housing units: 379,974
--- Occupied housing units: 323,519 (61.3% owner-occupied, 38.7% renter-occupied)
--- Vacant housing units: 56,455 (2.6% homeowner vacancy rate, 8.0% rental vacancy rate)
- Median rooms per house: 5.6
- Bedrooms: 2.3% no bedrooms, 11.1% one bedroom, 29.3% two bedrooms, 30.4% three bedrooms, 18.6% four bedrooms, 8.3% five bedrooms
- Average household size: 2.3
- Median gross rent: $804
- Median homeowner cost: $1,430 (with mortgage), $489 (without mortgage)
- Average days homes are on the market: 88 (5,221 homes currently)
- Current median listing price of homes in North Dakota: $232,000 (1.5% less than 2020, 0.9% greater than 2019)
North Dakota realtors say they aren’t experiencing the same home shortage as other states. While buyers may not always get their first choice, there are still plenty of homes to choose from in The Mount Rushmore State. Median list prices haven’t risen as much as other cities, either—in places like Bismarck, the December 2019 median price of $245,000 rose only to $254,999 in December 2020.
Ohio
- Total housing units: 5,232,943
--- Occupied housing units: 4,730,340 (66.0% owner-occupied, 34.0% renter-occupied)
--- Vacant housing units: 502,603 (1.2% homeowner vacancy rate, 4.7% rental vacancy rate)
- Median rooms per house: 5.9
- Bedrooms: 1.7% no bedrooms, 9.5% one bedroom, 25.8% two bedrooms, 41.6% three bedrooms, 17.9% four bedrooms, 3.5% five bedrooms
- Average household size: 2.4
- Median gross rent: $813
- Median homeowner cost: $1,250 (with mortgage), $478 (without mortgage)
- Average days homes are on the market: 71 (103,185 homes currently)
- Current median listing price of homes in Ohio: $169,900 (5.6% less than 2020, 6.3% greater than 2019)
A worsening of the pandemic seems to correlate with the real estate market heating up across the nation, including in Ohio, where realtors say they haven’t seen sales numbers like 2020’s in years. Sales rose 16.5% over the past year, with Central Ohio purchasing nearly 20% more than in the previous year. Many sold for above asking price, and with fewer days on the market.
Oklahoma
- Total housing units: 1,749,520
--- Occupied housing units: 1,495,151 (65.5% owner-occupied, 34.5% renter-occupied)
--- Vacant housing units: 254,369 (1.9% homeowner vacancy rate, 8.0% rental vacancy rate)
- Median rooms per house: 5.5
- Bedrooms: 1.9% no bedrooms, 8.6% one bedroom, 23.3% two bedrooms, 49.2% three bedrooms, 14.7% four bedrooms, 2.3% five bedrooms
- Average household size: 2.6
- Median gross rent: $814
- Median homeowner cost: $1,231 (with mortgage), $403 (without mortgage)
- Average days homes are on the market: 74 (32,492 homes currently)
- Current median listing price of homes in Oklahoma: $175,000 (7.8% less than 2020, 4.8% greater than 2019)
Oklahoma is one of the most affordable real estate markets in the nation. Conversely, the state also has some of the highest insurance rates due to its reputation for tornado activity. Still, for those looking to find deals on real estate, the state offers homes with the acreage homebuyers are looking for, and at prices that are heightened but possibly less than those of neighboring states.
Oregon
- Total housing units: 1,808,482
--- Occupied housing units: 1,649,352 (62.9% owner-occupied, 37.1% renter-occupied)
--- Vacant housing units: 159,130 (1.3% homeowner vacancy rate, 4.0% rental vacancy rate)
- Median rooms per house: 5.3
- Bedrooms: 3.8% no bedrooms, 10.2% one bedroom, 27.0% two bedrooms, 40.8% three bedrooms, 14.8% four bedrooms, 3.5% five bedrooms
- Average household size: 2.5
- Median gross rent: $1,185
- Median homeowner cost: $1,750 (with mortgage), $557 (without mortgage)
- Average days homes are on the market: 64 (46,754 homes currently)
- Current median listing price of homes in Oregon: $375,000 (6.2% less than 2020, 5.6% greater than 2019)
Some Oregon residents—who may otherwise not have been looking for a home but found themselves needing to after fires raged through the state—are having a hard time. Prices are up and inventory is low, making it somewhat easier for out-of-state buyers to afford the homes that are steadily becoming too pricey for current Oregonians.
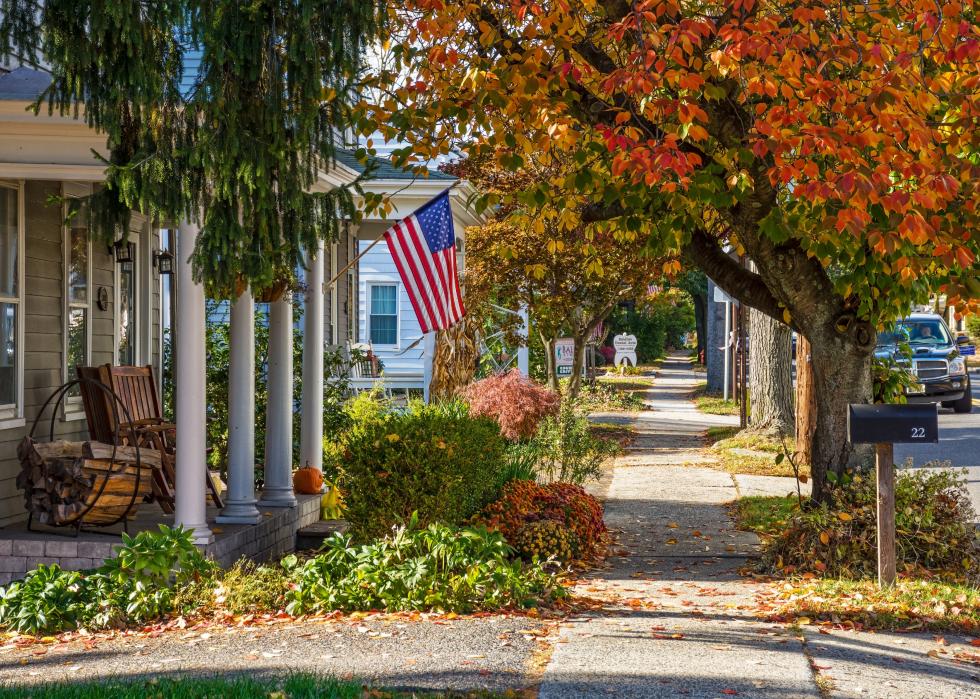
Pennsylvania
- Total housing units: 5,732,580
--- Occupied housing units: 5,119,249 (68.4% owner-occupied, 31.6% renter-occupied)
--- Vacant housing units: 613,331 (1.5% homeowner vacancy rate, 4.9% rental vacancy rate)
- Median rooms per house: 6.0
- Bedrooms: 2.2% no bedrooms, 10.5% one bedroom, 22.5% two bedrooms, 42.9% three bedrooms, 17.5% four bedrooms, 4.4% five bedrooms
- Average household size: 2.4
- Median gross rent: $951
- Median homeowner cost: $1,477 (with mortgage), $534 (without mortgage)
- Average days homes are on the market: 82 (86,280 homes currently)
- Current median listing price of homes in Pennsylvania: $215,000 (8.5% less than 2020, 4.9% greater than 2019)
Pennsylvania realtors are expecting a slow return to normalcy in the state’s real estate market, predicting that the spring and summer of 2021 will be busier than the fall months, which is the opposite of what happened in 2020. As older millennials purchase larger homes, their starter homes will free up inventory and be sold to new homebuyers this year.
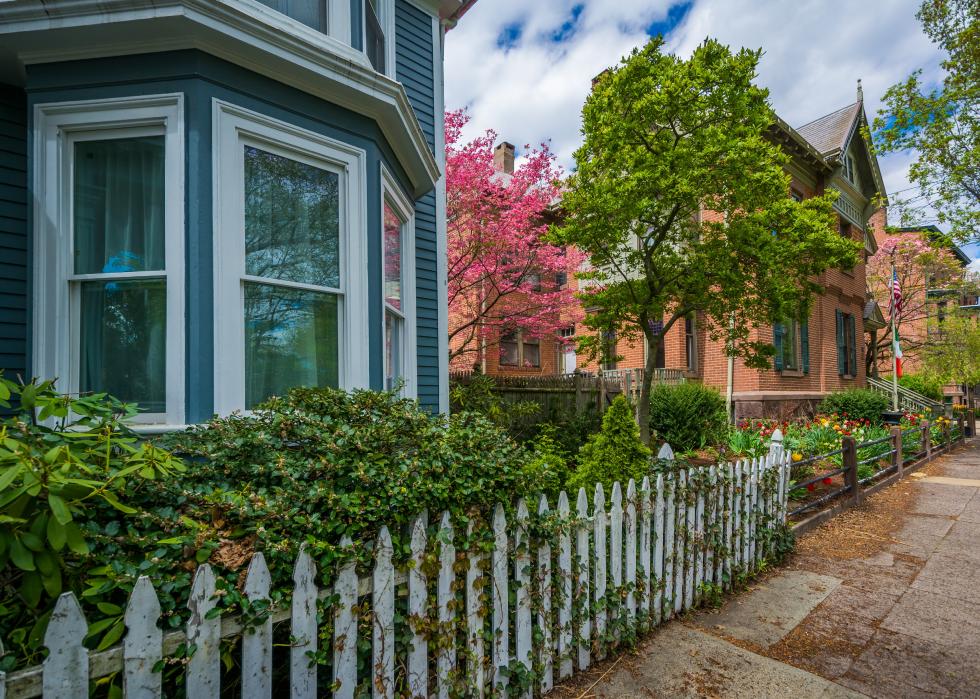
Rhode Island
- Total housing units: 470,177
--- Occupied housing units: 407,174 (61.7% owner-occupied, 38.3% renter-occupied)
--- Vacant housing units: 63,003 (1.2% homeowner vacancy rate, 7.0% rental vacancy rate)
- Median rooms per house: 5.3
- Bedrooms: 2.8% no bedrooms, 14.5% one bedroom, 30.1% two bedrooms, 37.6% three bedrooms, 12.0% four bedrooms, 3.0% five bedrooms
- Average household size: 2.5
- Median gross rent: $1,043
- Median homeowner cost: $1,837 (with mortgage), $736 (without mortgage)
- Average days homes are on the market: 75 (9,190 homes currently)
- Current median listing price of homes in Rhode Island: $289,900 (3.4% less than 2020, 0.0% greater than 2019)
Rhode Island was a real estate hot spot when the pandemic hit. Homebuyers escaping big cities like New York and Boston converged on Rhode Island suburbs, raising prices and gobbling up luxury properties. The median price for single-family homes in Rhode Island rose from $285,000 to $320,000 almost overnight. As is the case across the nation, people are looking for more space, so mansions in Rhode Island sold to mostly out-of-state buyers this past year.
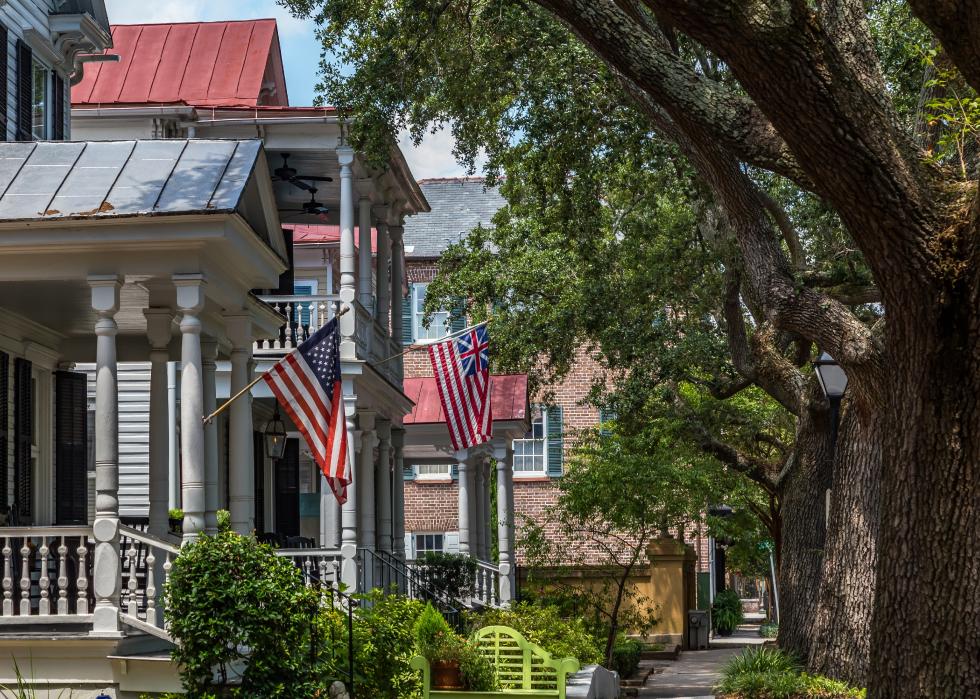
South Carolina
- Total housing units: 2,351,364
--- Occupied housing units: 1,975,915 (70.3% owner-occupied, 29.7% renter-occupied)
--- Vacant housing units: 375,449 (1.9% homeowner vacancy rate, 9.1% rental vacancy rate)
- Median rooms per house: 5.7
- Bedrooms: 1.8% no bedrooms, 5.4% one bedroom, 23.1% two bedrooms, 48.4% three bedrooms, 17.0% four bedrooms, 4.3% five bedrooms
- Average household size: 2.5
- Median gross rent: $922
- Median homeowner cost: $1,250 (with mortgage), $372 (without mortgage)
- Average days homes are on the market: 79 (54,142 homes currently)
- Current median listing price of homes in South Carolina: $224,000 (7.8% less than 2020, 4.2% greater than 2019)
First-time homebuyers and those wanting larger homes are no longer hesitating in South Carolina. Sales numbers are hitting records, and prices are rising to meet the increased demand, according to realtors. Areas like Hilton Head saw the largest price increases, while a slight price decrease was found in the Midlands, home to the state’s capital, Columbia.
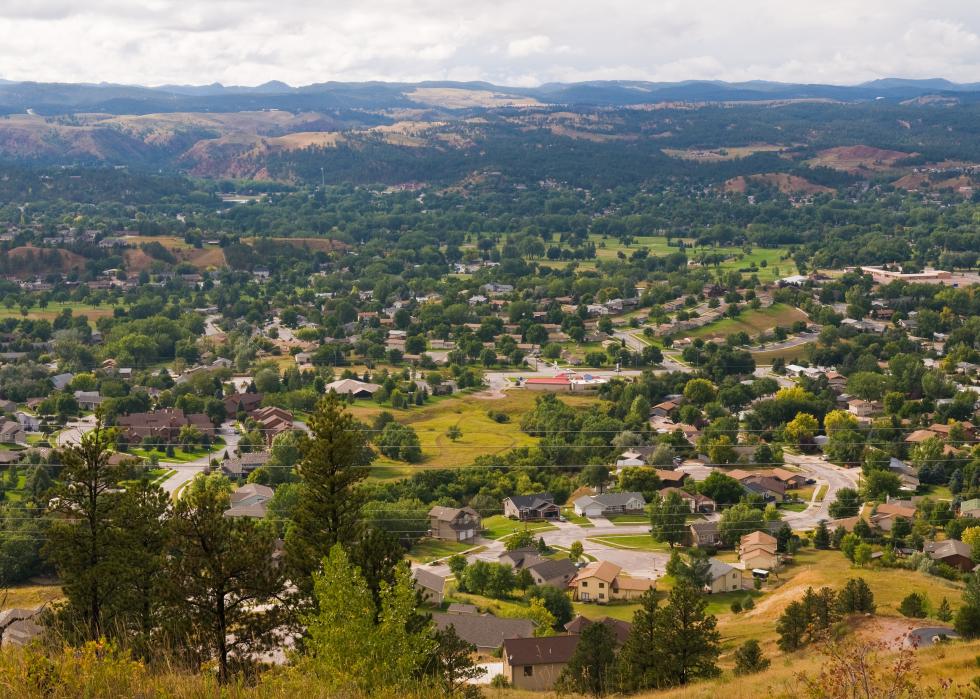
South Dakota
- Total housing units: 401,749
--- Occupied housing units: 353,799 (67.8% owner-occupied, 32.2% renter-occupied)
--- Vacant housing units: 47,950 (1.1% homeowner vacancy rate, 6.9% rental vacancy rate)
- Median rooms per house: 5.9
- Bedrooms: 1.8% no bedrooms, 10.0% one bedroom, 26.6% two bedrooms, 32.1% three bedrooms, 20.8% four bedrooms, 8.7% five bedrooms
- Average household size: 2.4
- Median gross rent: $769
- Median homeowner cost: $1,371 (with mortgage), $490 (without mortgage)
- Average days homes are on the market: 75 (1,389 homes currently)
- Current median listing price of homes in South Dakota: $214,900 (4.0% less than 2020, 6.1% less than 2019)
Politicians in South Dakota believe that homebuyers are flocking to the state because it allows residents more personal freedoms than other states when it comes to lockdowns and mask mandates. Homes in the state are indeed spending less time on the market and selling for higher prices. There’s no consensus as to whether it’s due to more freedoms.
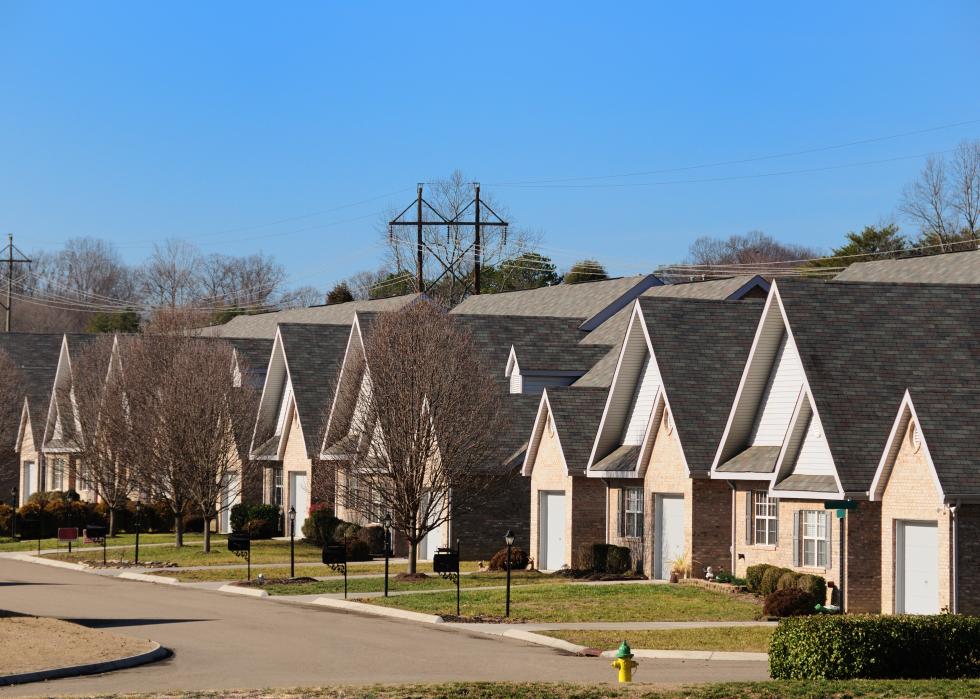
Tennessee
- Total housing units: 3,028,437
--- Occupied housing units: 2,654,737 (66.5% owner-occupied, 33.5% renter-occupied)
--- Vacant housing units: 373,700 (1.3% homeowner vacancy rate, 7.3% rental vacancy rate)
- Median rooms per house: 5.6
- Bedrooms: 1.5% no bedrooms, 7.8% one bedroom, 25.3% two bedrooms, 45.7% three bedrooms, 15.6% four bedrooms, 4.1% five bedrooms
- Average household size: 2.5
- Median gross rent: $904
- Median homeowner cost: $1,264 (with mortgage), $387 (without mortgage)
- Average days homes are on the market: 70 (66,021 homes currently)
- Current median listing price of homes in Tennessee: $224,900 (10.0% less than 2020, 4.3% greater than 2019)
As of October 2020, homes in Nashville were still selling for just under list price, which leaves a door open for homebuyers hungry to get into Tennessee. At the time, the average home was on the market for 40 days and sold for around 8% more than the previous year with a median price of around $335,000.
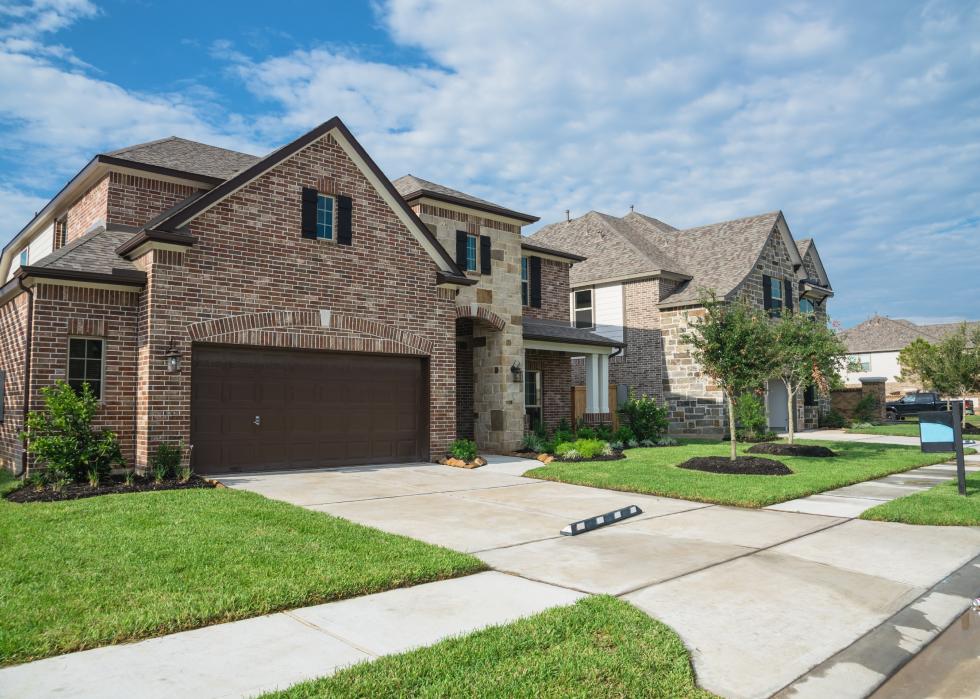
Texas
- Total housing units: 11,283,892
--- Occupied housing units: 9,985,126 (61.9% owner-occupied, 38.1% renter-occupied)
--- Vacant housing units: 1,298,766 (1.5% homeowner vacancy rate, 8.1% rental vacancy rate)
- Median rooms per house: 5.3
- Bedrooms: 2.3% no bedrooms, 12.9% one bedroom, 22.1% two bedrooms, 40.2% three bedrooms, 18.6% four bedrooms, 3.8% five bedrooms
- Average household size: 2.8
- Median gross rent: $1,091
- Median homeowner cost: $1,675 (with mortgage), $527 (without mortgage)
- Average days homes are on the market: 73 (238,334 homes currently)
- Current median listing price of homes in Texas: $247,990 (4.3% less than 2020, 4.0% greater than 2019)
Economic uncertainty may pose a threat to the glowing real estate picture currently seen in Texas. Experts report a leveling-off of sales between October and November 2020 but steady demand for affordable homes in the region. If construction projects can keep up with demand, 2021 may prove to be just as strong as the fall of 2020.
Utah
- Total housing units: 1,133,543
--- Occupied housing units: 1,023,855 (70.6% owner-occupied, 29.4% renter-occupied)
--- Vacant housing units: 109,688 (0.8% homeowner vacancy rate, 7.5% rental vacancy rate)
- Median rooms per house: 6.3
- Bedrooms: 1.9% no bedrooms, 7.4% one bedroom, 19.1% two bedrooms, 29.3% three bedrooms, 21.6% four bedrooms, 20.7% five bedrooms
- Average household size: 3.1
- Median gross rent: $1,098
- Median homeowner cost: $1,605 (with mortgage), $431 (without mortgage)
- Average days homes are on the market: 58 (35,903 homes currently)
- Current median listing price of homes in Utah: $329,900 (8.4% less than 2020, 3.4% greater than 2019)
With more people buying than listing homes in Utah, prices have gone up and bidding wars are the norm, according to realtors. Utah is still seen as an affordable place to live for now, so the state has a large influx of Californians and those from other surrounding states snapping up available properties.
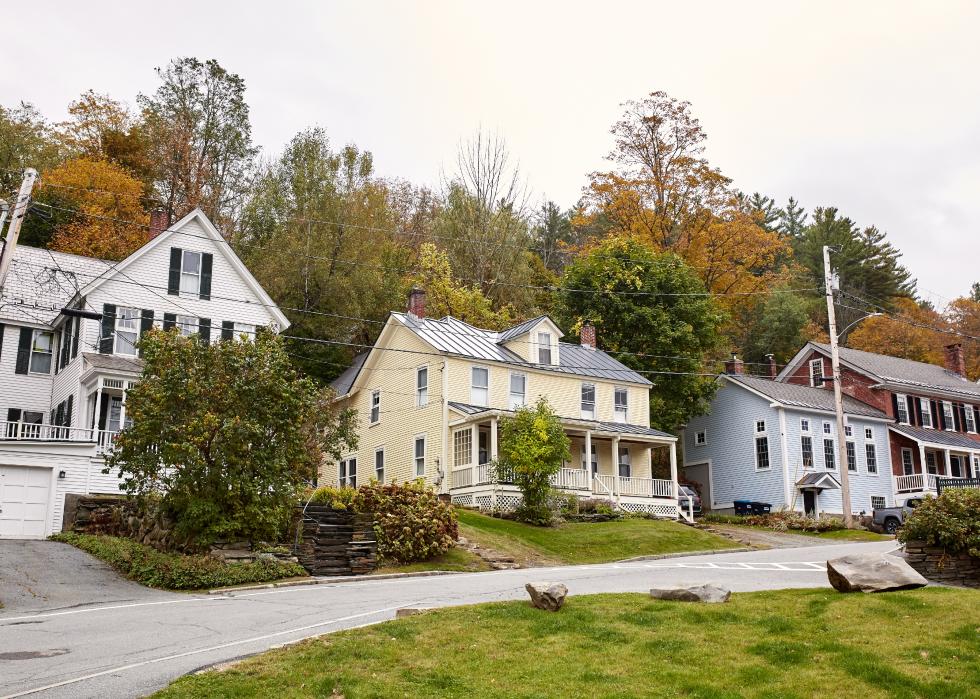
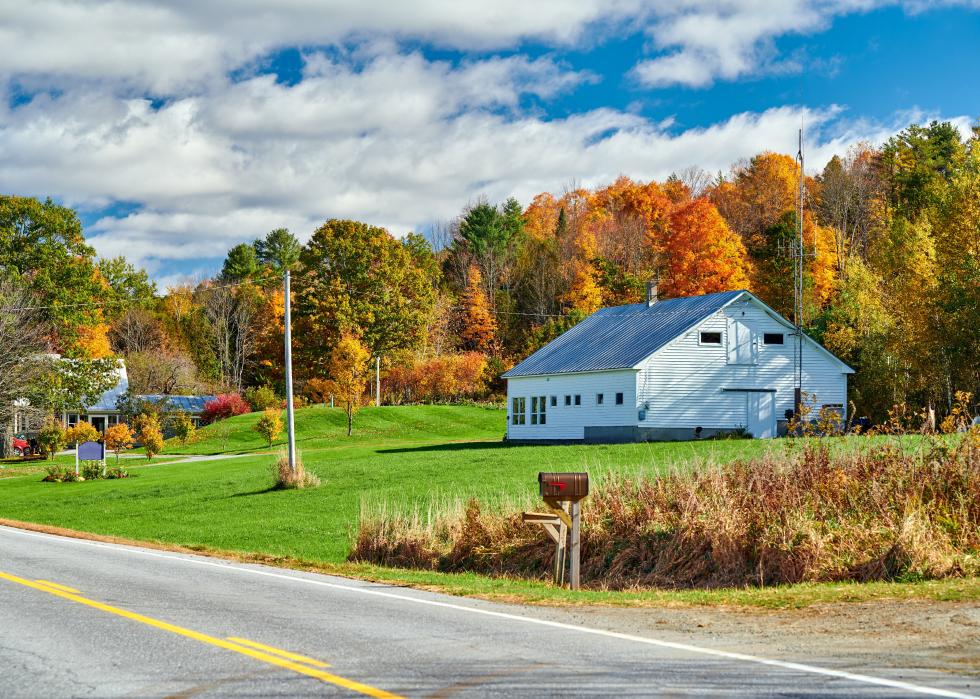
Vermont
- Total housing units: 339,412
--- Occupied housing units: 262,767 (70.9% owner-occupied, 29.1% renter-occupied)
--- Vacant housing units: 76,645 (1.6% homeowner vacancy rate, 4.5% rental vacancy rate)
- Median rooms per house: 5.5
- Bedrooms: 4.3% no bedrooms, 11.2% one bedroom, 27.3% two bedrooms, 38.1% three bedrooms, 14.7% four bedrooms, 4.3% five bedrooms
- Average household size: 2.3
- Median gross rent: $980
- Median homeowner cost: $1,606 (with mortgage), $668 (without mortgage)
- Average days homes are on the market: 89 (3,570 homes currently)
- Current median listing price of homes in Vermont: $259,900 (12.3% less than 2020, 1.9% greater than 2019)
Some buyers are purchasing homes in Vermont before they even see them, according to realtors. Even luxury homes that used to sit on the market are sold within days now. Local buyers with pre-approval for a loan are often outbid by cash offers from out-of-state buyers who are moving to the state for a slower pace and feeling of safety.
Virginia
- Total housing units: 3,562,258
--- Occupied housing units: 3,191,847 (66.1% owner-occupied, 33.9% renter-occupied)
--- Vacant housing units: 370,411 (1.3% homeowner vacancy rate, 5.5% rental vacancy rate)
- Median rooms per house: 6.0
- Bedrooms: 1.5% no bedrooms, 8.3% one bedroom, 23.2% two bedrooms, 38.7% three bedrooms, 21.1% four bedrooms, 7.1% five bedrooms
- Average household size: 2.6
- Median gross rent: $1,254
- Median homeowner cost: $1,792 (with mortgage), $478 (without mortgage)
- Average days homes are on the market: 63 (87,178 homes currently)
- Current median listing price of homes in Virginia: $315,000 (7.3% less than 2020, 8.7% greater than 2019)
Condo sales and prices may be down in Virginia due to COVID, but the detached home market is continuing to rise since the start of the pandemic. The need for more space, low-interest rates, and space for home offices are all factors pushing market growth in Virginia.
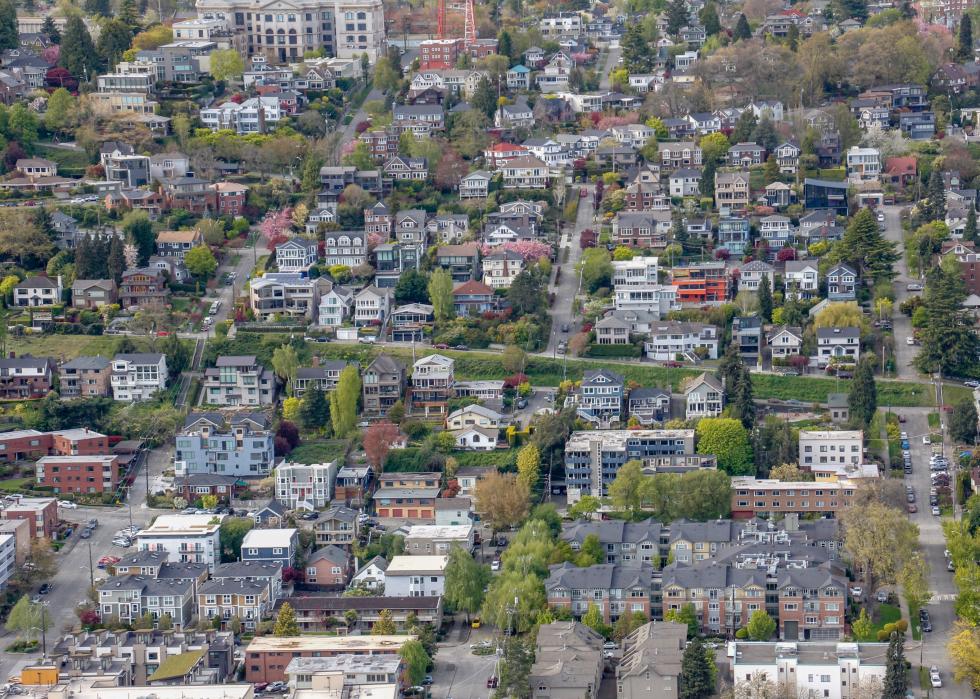
Washington
- Total housing units: 3,195,098
--- Occupied housing units: 2,932,477 (63.1% owner-occupied, 36.9% renter-occupied)
--- Vacant housing units: 262,621 (1.1% homeowner vacancy rate, 4.3% rental vacancy rate)
- Median rooms per house: 5.5
- Bedrooms: 4.0% no bedrooms, 11.8% one bedroom, 24.9% two bedrooms, 37.2% three bedrooms, 17.5% four bedrooms, 4.7% five bedrooms
- Average household size: 2.6
- Median gross rent: $1,359
- Median homeowner cost: $1,951 (with mortgage), $604 (without mortgage)
- Average days homes are on the market: 58 (93,712 homes currently)
- Current median listing price of homes in Washington: $410,000 (6.8% less than 2020, 5.4% greater than 2019)
With 45% of its homes selling above list price and some tech companies in the state allowing employees to work from home indefinitely, Washington ranks at the top of the most competitive real estate markets for 2020, according to Insurify. In 2020, an average 68 homes per month sold within two weeks of going up for sale.
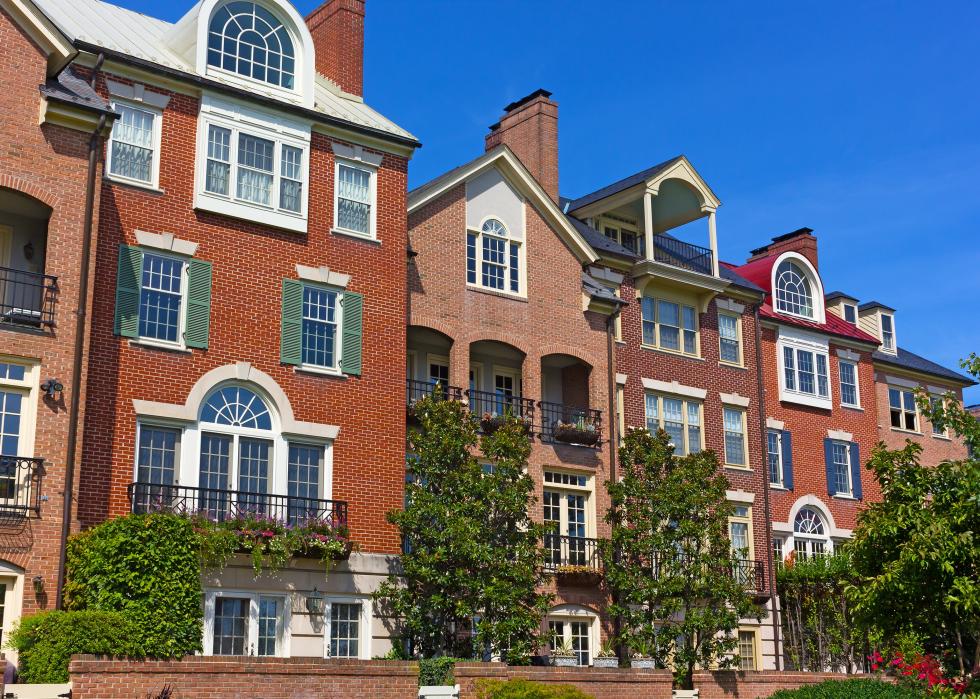
Washington DC
- Total housing units: 322,814
--- Occupied housing units: 291,570 (41.5% owner-occupied, 58.5% renter-occupied)
--- Vacant housing units: 31,244 (1.9% homeowner vacancy rate, 7.0% rental vacancy rate)
- Median rooms per house: 4.0
- Bedrooms: 9.9% no bedrooms, 31.0% one bedroom, 26.0% two bedrooms, 20.4% three bedrooms, 9.0% four bedrooms, 3.8% five bedrooms
- Average household size: 2.3
- Median gross rent: $1,603
- Median homeowner cost: $2,684 (with mortgage), $720 (without mortgage)
- Average days homes are on the market: 68 (5,904 homes currently)
- Current median listing price of homes in Washington D.C.: $599,993 (13.0% less than 2020, 0.0% less than 2019)
The median price for a single-family home in Washington D.C. reached a record level in October 2020 of just over $1 million. That didn’t stop an increase in sales to the tune of 24% or a decrease of time on the market to seven days, according to realtors. Experts believe more listings will enter the market as prices continue to rise.
West Virginia
- Total housing units: 894,983
--- Occupied housing units: 728,175 (73.4% owner-occupied, 26.6% renter-occupied)
--- Vacant housing units: 166,808 (1.9% homeowner vacancy rate, 7.2% rental vacancy rate)
- Median rooms per house: 5.7
- Bedrooms: 2.0% no bedrooms, 7.2% one bedroom, 27.3% two bedrooms, 46.0% three bedrooms, 14.3% four bedrooms, 3.2% five bedrooms
- Average household size: 2.4
- Median gross rent: $727
- Median homeowner cost: $1,052 (with mortgage), $321 (without mortgage)
- Average days homes are on the market: 77 (3,616 homes currently)
- Current median listing price of homes in West Virginia: $189,900 (9.6% less than 2020, 6.1% greater than 2019)
West Virginia ranks as the most affordable state in the country to purchase a home, with an average home price around $107,000. With prices that low, parts of the state that border others have seen an increase in second-home purchases, but not the buying frenzy seen in other states.
Wisconsin
- Total housing units: 2,725,153
--- Occupied housing units: 2,386,623 (67.2% owner-occupied, 32.8% renter-occupied)
--- Vacant housing units: 338,530 (1.1% homeowner vacancy rate, 4.9% rental vacancy rate)
- Median rooms per house: 5.6
- Bedrooms: 2.0% no bedrooms, 9.8% one bedroom, 28.4% two bedrooms, 40.5% three bedrooms, 15.6% four bedrooms, 3.8% five bedrooms
- Average household size: 2.4
- Median gross rent: $867
- Median homeowner cost: $1,412 (with mortgage), $545 (without mortgage)
- Average days homes are on the market: 75 (52,981 homes currently)
- Current median listing price of homes in Wisconsin: $205,000 (8.9% less than 2020, 8.0% greater than 2019)
Buyers in Wisconsin are especially interested in homes priced under $300,000, according to realtors. Closing on homes is also taking longer because of all of the refinancing happening around the state. Whereas a typical closing in recent years may have taken 30 days, it can now take more than six weeks.
Wyoming
- Total housing units: 280,281
--- Occupied housing units: 233,128 (71.9% owner-occupied, 28.1% renter-occupied)
--- Vacant housing units: 47,153 (1.4% homeowner vacancy rate, 12.9% rental vacancy rate)
- Median rooms per house: 5.7
- Bedrooms: 1.7% no bedrooms, 8.3% one bedroom, 23.4% two bedrooms, 40.8% three bedrooms, 17.6% four bedrooms, 8.2% five bedrooms
- Average household size: 2.4
- Median gross rent: $822
- Median homeowner cost: $1,417 (with mortgage), $419 (without mortgage)
- Average days homes are on the market: 76 (4,179 homes currently)
- Current median listing price of homes in Wyoming: $255,000 (3.8% less than 2020, 2.3% greater than 2019)
Buyers moving to Wyoming are looking for wide-open spaces and access to recreation. Like other homebuyers, they also want a home office or more room for the kids to run around. The biggest growth in Wyoming has been from out-of-state buyers (mostly from California, Texas, and Colorado) and offers on homes sight unseen.


