Counties with the most renters in Kansas
Written by:
February 24, 2021
Updated on February 25, 2021
Arina P Habich // Shutterstock
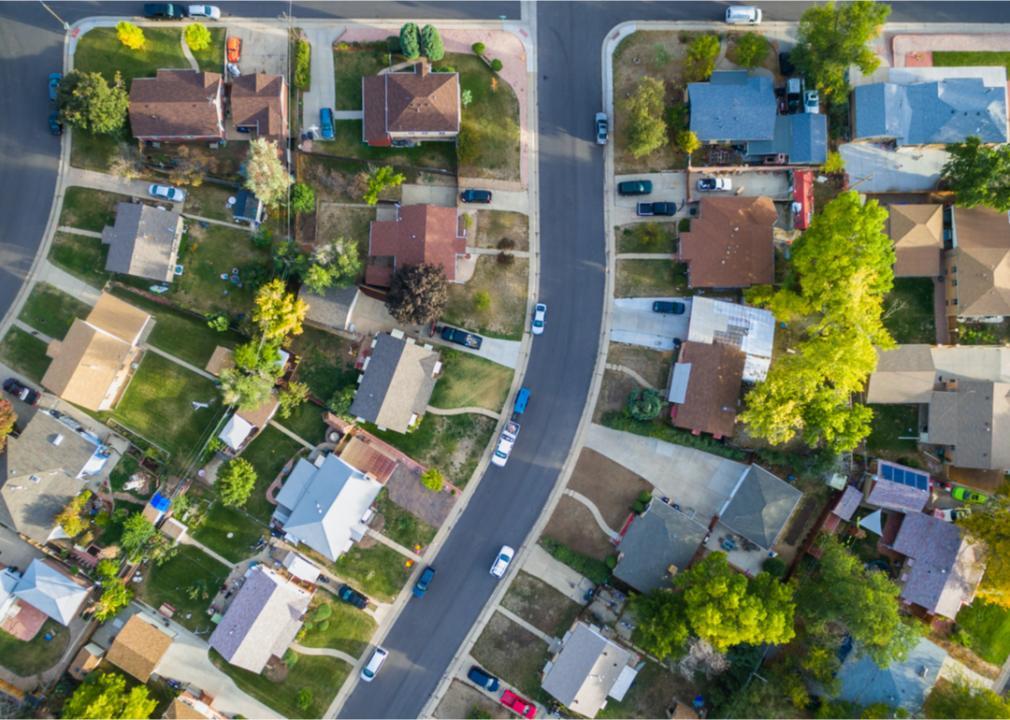
Counties with the most renters in Kansas
All cities are made up of a mix of homeowners and renters, with 58.6% of Americans owning their own homes and 30.4% rending in the fourth quarter of 2020, according to the American Census Bureau. In cities, there tend to be higher rates of renters due to high property values and influxes of young people who flock to urban areas after college to enter the workforce.
Stacker compiled a list of the counties with most renters in Kansas using data from the U.S. Census Bureau. Counties are ranked by percent of housing units occupied by renters as of 2019 5-year estimates. Keep reading to see if your county made the list.
You may also like:
Metros in Kansas where jobs are growing fastest
#30. Harper County
- Housing units occupied by renters: 30.4%
- 2019 median gross rent: $681 (+13.3% change in rent since 2015)
--- #35 highest rent among counties in Kansas, #1,883 among all counties nationwide
- Renters paying over 35% of household income: 25.8%
--- #68 most common among counties in Kansas, #2,688 among all counties nationwide
- 2019 median gross rent: $681 (+13.3% change in rent since 2015)
--- #35 highest rent among counties in Kansas, #1,883 among all counties nationwide
- Renters paying over 35% of household income: 25.8%
--- #68 most common among counties in Kansas, #2,688 among all counties nationwide
#29. Labette County
- Housing units occupied by renters: 30.5%
- 2019 median gross rent: $633 (+13.2% change in rent since 2015)
--- #63 highest rent among counties in Kansas, #2,347 among all counties nationwide
- Renters paying over 35% of household income: 39.8%
--- #8 most common among counties in Kansas, #880 among all counties nationwide
- 2019 median gross rent: $633 (+13.2% change in rent since 2015)
--- #63 highest rent among counties in Kansas, #2,347 among all counties nationwide
- Renters paying over 35% of household income: 39.8%
--- #8 most common among counties in Kansas, #880 among all counties nationwide
#28. McPherson County
- Housing units occupied by renters: 30.5%
- 2019 median gross rent: $746 (+16.4% change in rent since 2015)
--- #20 highest rent among counties in Kansas, #1,336 among all counties nationwide
- Renters paying over 35% of household income: 26.6%
--- #66 most common among counties in Kansas, #2,636 among all counties nationwide
- 2019 median gross rent: $746 (+16.4% change in rent since 2015)
--- #20 highest rent among counties in Kansas, #1,336 among all counties nationwide
- Renters paying over 35% of household income: 26.6%
--- #66 most common among counties in Kansas, #2,636 among all counties nationwide
#27. Morton County
- Housing units occupied by renters: 30.5%
- 2019 median gross rent: $609 (+1.7% change in rent since 2015)
--- #75 highest rent among counties in Kansas, #2,569 among all counties nationwide
- Renters paying over 35% of household income: 28.1%
--- #53 most common among counties in Kansas, #2,497 among all counties nationwide
- 2019 median gross rent: $609 (+1.7% change in rent since 2015)
--- #75 highest rent among counties in Kansas, #2,569 among all counties nationwide
- Renters paying over 35% of household income: 28.1%
--- #53 most common among counties in Kansas, #2,497 among all counties nationwide
#26. Atchison County
- Housing units occupied by renters: 30.6%
- 2019 median gross rent: $660 (+12.6% change in rent since 2015)
--- #48 highest rent among counties in Kansas, #2,096 among all counties nationwide
- Renters paying over 35% of household income: 27.3%
--- #63 most common among counties in Kansas, #2,571 among all counties nationwide
- 2019 median gross rent: $660 (+12.6% change in rent since 2015)
--- #48 highest rent among counties in Kansas, #2,096 among all counties nationwide
- Renters paying over 35% of household income: 27.3%
--- #63 most common among counties in Kansas, #2,571 among all counties nationwide
You may also like:
Metros where renters are the most overextended in Kansas
#25. Reno County
- Housing units occupied by renters: 30.7%
- 2019 median gross rent: $696 (+4.5% change in rent since 2015)
--- #30 highest rent among counties in Kansas, #1,741 among all counties nationwide
- Renters paying over 35% of household income: 36.0%
--- #17 most common among counties in Kansas, #1,479 among all counties nationwide
- 2019 median gross rent: $696 (+4.5% change in rent since 2015)
--- #30 highest rent among counties in Kansas, #1,741 among all counties nationwide
- Renters paying over 35% of household income: 36.0%
--- #17 most common among counties in Kansas, #1,479 among all counties nationwide
#24. Johnson County
- Housing units occupied by renters: 30.8%
- 2019 median gross rent: $1,109 (+17.1% change in rent since 2015)
--- #1 highest rent among counties in Kansas, #262 among all counties nationwide
- Renters paying over 35% of household income: 30.5%
--- #42 most common among counties in Kansas, #2,261 among all counties nationwide
- 2019 median gross rent: $1,109 (+17.1% change in rent since 2015)
--- #1 highest rent among counties in Kansas, #262 among all counties nationwide
- Renters paying over 35% of household income: 30.5%
--- #42 most common among counties in Kansas, #2,261 among all counties nationwide
#23. Logan County
- Housing units occupied by renters: 30.8%
- 2019 median gross rent: $681 (+0.9% change in rent since 2015)
--- #35 highest rent among counties in Kansas, #1,883 among all counties nationwide
- Renters paying over 35% of household income: 25.6%
--- #69 most common among counties in Kansas, #2,704 among all counties nationwide
- 2019 median gross rent: $681 (+0.9% change in rent since 2015)
--- #35 highest rent among counties in Kansas, #1,883 among all counties nationwide
- Renters paying over 35% of household income: 25.6%
--- #69 most common among counties in Kansas, #2,704 among all counties nationwide
#22. Meade County
- Housing units occupied by renters: 30.8%
- 2019 median gross rent: $633 (-3.4% change in rent since 2015)
--- #63 highest rent among counties in Kansas, #2,347 among all counties nationwide
- Renters paying over 35% of household income: 23.6%
--- #78 most common among counties in Kansas, #2,823 among all counties nationwide
- 2019 median gross rent: $633 (-3.4% change in rent since 2015)
--- #63 highest rent among counties in Kansas, #2,347 among all counties nationwide
- Renters paying over 35% of household income: 23.6%
--- #78 most common among counties in Kansas, #2,823 among all counties nationwide
#21. Montgomery County
- Housing units occupied by renters: 31.2%
- 2019 median gross rent: $659 (+5.6% change in rent since 2015)
--- #49 highest rent among counties in Kansas, #2,108 among all counties nationwide
- Renters paying over 35% of household income: 31.3%
--- #34 most common among counties in Kansas, #2,163 among all counties nationwide
- 2019 median gross rent: $659 (+5.6% change in rent since 2015)
--- #49 highest rent among counties in Kansas, #2,108 among all counties nationwide
- Renters paying over 35% of household income: 31.3%
--- #34 most common among counties in Kansas, #2,163 among all counties nationwide
You may also like:
Healthy hotspots: The most physically active counties in Kansas
#20. Pratt County
- Housing units occupied by renters: 32.3%
- 2019 median gross rent: $692 (+8.5% change in rent since 2015)
--- #33 highest rent among counties in Kansas, #1,791 among all counties nationwide
- Renters paying over 35% of household income: 23.6%
--- #78 most common among counties in Kansas, #2,823 among all counties nationwide
- 2019 median gross rent: $692 (+8.5% change in rent since 2015)
--- #33 highest rent among counties in Kansas, #1,791 among all counties nationwide
- Renters paying over 35% of household income: 23.6%
--- #78 most common among counties in Kansas, #2,823 among all counties nationwide
#19. Thomas County
- Housing units occupied by renters: 32.4%
- 2019 median gross rent: $638 (+37.8% change in rent since 2015)
--- #61 highest rent among counties in Kansas, #2,303 among all counties nationwide
- Renters paying over 35% of household income: 30.5%
--- #42 most common among counties in Kansas, #2,261 among all counties nationwide
- 2019 median gross rent: $638 (+37.8% change in rent since 2015)
--- #61 highest rent among counties in Kansas, #2,303 among all counties nationwide
- Renters paying over 35% of household income: 30.5%
--- #42 most common among counties in Kansas, #2,261 among all counties nationwide
#18. Cowley County
- Housing units occupied by renters: 32.6%
- 2019 median gross rent: $694 (+8.6% change in rent since 2015)
--- #31 highest rent among counties in Kansas, #1,772 among all counties nationwide
- Renters paying over 35% of household income: 29.5%
--- #47 most common among counties in Kansas, #2,354 among all counties nationwide
- 2019 median gross rent: $694 (+8.6% change in rent since 2015)
--- #31 highest rent among counties in Kansas, #1,772 among all counties nationwide
- Renters paying over 35% of household income: 29.5%
--- #47 most common among counties in Kansas, #2,354 among all counties nationwide
#17. Leavenworth County
- Housing units occupied by renters: 32.6%
- 2019 median gross rent: $987 (+11.8% change in rent since 2015)
--- #3 highest rent among counties in Kansas, #428 among all counties nationwide
- Renters paying over 35% of household income: 29.5%
--- #47 most common among counties in Kansas, #2,354 among all counties nationwide
- 2019 median gross rent: $987 (+11.8% change in rent since 2015)
--- #3 highest rent among counties in Kansas, #428 among all counties nationwide
- Renters paying over 35% of household income: 29.5%
--- #47 most common among counties in Kansas, #2,354 among all counties nationwide
#16. Sherman County
- Housing units occupied by renters: 33.1%
- 2019 median gross rent: $819 (+27.4% change in rent since 2015)
--- #12 highest rent among counties in Kansas, #907 among all counties nationwide
- Renters paying over 35% of household income: 32.3%
--- #31 most common among counties in Kansas, #2,037 among all counties nationwide
- 2019 median gross rent: $819 (+27.4% change in rent since 2015)
--- #12 highest rent among counties in Kansas, #907 among all counties nationwide
- Renters paying over 35% of household income: 32.3%
--- #31 most common among counties in Kansas, #2,037 among all counties nationwide
You may also like:
Best amusement parks in Kansas
#15. Saline County
- Housing units occupied by renters: 33.3%
- 2019 median gross rent: $761 (+10.0% change in rent since 2015)
--- #18 highest rent among counties in Kansas, #1,238 among all counties nationwide
- Renters paying over 35% of household income: 37.2%
--- #12 most common among counties in Kansas, #1,259 among all counties nationwide
- 2019 median gross rent: $761 (+10.0% change in rent since 2015)
--- #18 highest rent among counties in Kansas, #1,238 among all counties nationwide
- Renters paying over 35% of household income: 37.2%
--- #12 most common among counties in Kansas, #1,259 among all counties nationwide
#14. Seward County
- Housing units occupied by renters: 33.3%
- 2019 median gross rent: $787 (+18.5% change in rent since 2015)
--- #16 highest rent among counties in Kansas, #1,070 among all counties nationwide
- Renters paying over 35% of household income: 27.3%
--- #63 most common among counties in Kansas, #2,571 among all counties nationwide
- 2019 median gross rent: $787 (+18.5% change in rent since 2015)
--- #16 highest rent among counties in Kansas, #1,070 among all counties nationwide
- Renters paying over 35% of household income: 27.3%
--- #63 most common among counties in Kansas, #2,571 among all counties nationwide
#13. Pawnee County
- Housing units occupied by renters: 33.9%
- 2019 median gross rent: $602 (+39.4% change in rent since 2015)
--- #77 highest rent among counties in Kansas, #2,617 among all counties nationwide
- Renters paying over 35% of household income: 11.9%
--- #102 most common among counties in Kansas, #3,094 among all counties nationwide
- 2019 median gross rent: $602 (+39.4% change in rent since 2015)
--- #77 highest rent among counties in Kansas, #2,617 among all counties nationwide
- Renters paying over 35% of household income: 11.9%
--- #102 most common among counties in Kansas, #3,094 among all counties nationwide
#12. Finney County
- Housing units occupied by renters: 35.6%
- 2019 median gross rent: $806 (+17.0% change in rent since 2015)
--- #14 highest rent among counties in Kansas, #970 among all counties nationwide
- Renters paying over 35% of household income: 27.7%
--- #59 most common among counties in Kansas, #2,538 among all counties nationwide
- 2019 median gross rent: $806 (+17.0% change in rent since 2015)
--- #14 highest rent among counties in Kansas, #970 among all counties nationwide
- Renters paying over 35% of household income: 27.7%
--- #59 most common among counties in Kansas, #2,538 among all counties nationwide
#11. Shawnee County
- Housing units occupied by renters: 35.6%
- 2019 median gross rent: $825 (+11.8% change in rent since 2015)
--- #10 highest rent among counties in Kansas, #882 among all counties nationwide
- Renters paying over 35% of household income: 36.8%
--- #14 most common among counties in Kansas, #1,340 among all counties nationwide
- 2019 median gross rent: $825 (+11.8% change in rent since 2015)
--- #10 highest rent among counties in Kansas, #882 among all counties nationwide
- Renters paying over 35% of household income: 36.8%
--- #14 most common among counties in Kansas, #1,340 among all counties nationwide
You may also like:
Best public colleges in Kansas
#10. Greeley County
- Housing units occupied by renters: 37.0%
- 2019 median gross rent: $720 (-11.1% change in rent since 2015)
--- #22 highest rent among counties in Kansas, #1,524 among all counties nationwide
- Renters paying over 35% of household income: 20.9%
--- #87 most common among counties in Kansas, #2,933 among all counties nationwide
- 2019 median gross rent: $720 (-11.1% change in rent since 2015)
--- #22 highest rent among counties in Kansas, #1,524 among all counties nationwide
- Renters paying over 35% of household income: 20.9%
--- #87 most common among counties in Kansas, #2,933 among all counties nationwide
#9. Sedgwick County
- Housing units occupied by renters: 37.1%
- 2019 median gross rent: $824 (+12.7% change in rent since 2015)
--- #11 highest rent among counties in Kansas, #887 among all counties nationwide
- Renters paying over 35% of household income: 36.9%
--- #13 most common among counties in Kansas, #1,321 among all counties nationwide
- 2019 median gross rent: $824 (+12.7% change in rent since 2015)
--- #11 highest rent among counties in Kansas, #887 among all counties nationwide
- Renters paying over 35% of household income: 36.9%
--- #13 most common among counties in Kansas, #1,321 among all counties nationwide
#8. Ford County
- Housing units occupied by renters: 38.5%
- 2019 median gross rent: $778 (+17.7% change in rent since 2015)
--- #17 highest rent among counties in Kansas, #1,123 among all counties nationwide
- Renters paying over 35% of household income: 27.9%
--- #56 most common among counties in Kansas, #2,517 among all counties nationwide
- 2019 median gross rent: $778 (+17.7% change in rent since 2015)
--- #17 highest rent among counties in Kansas, #1,123 among all counties nationwide
- Renters paying over 35% of household income: 27.9%
--- #56 most common among counties in Kansas, #2,517 among all counties nationwide
#7. Ellis County
- Housing units occupied by renters: 38.8%
- 2019 median gross rent: $711 (+12.1% change in rent since 2015)
--- #27 highest rent among counties in Kansas, #1,608 among all counties nationwide
- Renters paying over 35% of household income: 33.5%
--- #25 most common among counties in Kansas, #1,846 among all counties nationwide
- 2019 median gross rent: $711 (+12.1% change in rent since 2015)
--- #27 highest rent among counties in Kansas, #1,608 among all counties nationwide
- Renters paying over 35% of household income: 33.5%
--- #25 most common among counties in Kansas, #1,846 among all counties nationwide
#6. Lyon County
- Housing units occupied by renters: 40.0%
- 2019 median gross rent: $674 (+12.3% change in rent since 2015)
--- #40 highest rent among counties in Kansas, #1,957 among all counties nationwide
- Renters paying over 35% of household income: 41.2%
--- #6 most common among counties in Kansas, #687 among all counties nationwide
- 2019 median gross rent: $674 (+12.3% change in rent since 2015)
--- #40 highest rent among counties in Kansas, #1,957 among all counties nationwide
- Renters paying over 35% of household income: 41.2%
--- #6 most common among counties in Kansas, #687 among all counties nationwide
You may also like:
Counties with the highest heart disease rates in Kansas
#5. Crawford County
- Housing units occupied by renters: 40.6%
- 2019 median gross rent: $717 (+6.5% change in rent since 2015)
--- #23 highest rent among counties in Kansas, #1,548 among all counties nationwide
- Renters paying over 35% of household income: 46.0%
--- #2 most common among counties in Kansas, #272 among all counties nationwide
- 2019 median gross rent: $717 (+6.5% change in rent since 2015)
--- #23 highest rent among counties in Kansas, #1,548 among all counties nationwide
- Renters paying over 35% of household income: 46.0%
--- #2 most common among counties in Kansas, #272 among all counties nationwide
#4. Wyandotte County
- Housing units occupied by renters: 42.6%
- 2019 median gross rent: $884 (+13.8% change in rent since 2015)
--- #6 highest rent among counties in Kansas, #663 among all counties nationwide
- Renters paying over 35% of household income: 40.2%
--- #7 most common among counties in Kansas, #826 among all counties nationwide
- 2019 median gross rent: $884 (+13.8% change in rent since 2015)
--- #6 highest rent among counties in Kansas, #663 among all counties nationwide
- Renters paying over 35% of household income: 40.2%
--- #7 most common among counties in Kansas, #826 among all counties nationwide
#3. Douglas County
- Housing units occupied by renters: 48.7%
- 2019 median gross rent: $926 (+7.8% change in rent since 2015)
--- #5 highest rent among counties in Kansas, #552 among all counties nationwide
- Renters paying over 35% of household income: 42.1%
--- #5 most common among counties in Kansas, #589 among all counties nationwide
- 2019 median gross rent: $926 (+7.8% change in rent since 2015)
--- #5 highest rent among counties in Kansas, #552 among all counties nationwide
- Renters paying over 35% of household income: 42.1%
--- #5 most common among counties in Kansas, #589 among all counties nationwide
#2. Riley County
- Housing units occupied by renters: 56.8%
- 2019 median gross rent: $946 (+7.0% change in rent since 2015)
--- #4 highest rent among counties in Kansas, #510 among all counties nationwide
- Renters paying over 35% of household income: 44.5%
--- #3 most common among counties in Kansas, #365 among all counties nationwide
- 2019 median gross rent: $946 (+7.0% change in rent since 2015)
--- #4 highest rent among counties in Kansas, #510 among all counties nationwide
- Renters paying over 35% of household income: 44.5%
--- #3 most common among counties in Kansas, #365 among all counties nationwide
#1. Geary County
- Housing units occupied by renters: 62.1%
- 2019 median gross rent: $1,057 (+2.9% change in rent since 2015)
--- #2 highest rent among counties in Kansas, #325 among all counties nationwide
- Renters paying over 35% of household income: 33.4%
--- #26 most common among counties in Kansas, #1,860 among all counties nationwide
- 2019 median gross rent: $1,057 (+2.9% change in rent since 2015)
--- #2 highest rent among counties in Kansas, #325 among all counties nationwide
- Renters paying over 35% of household income: 33.4%
--- #26 most common among counties in Kansas, #1,860 among all counties nationwide
You may also like:
States sending the most people to Kansas


