Counties with the most renters in South Carolina
Written by:
February 24, 2021
Updated on February 25, 2021
Arina P Habich // Shutterstock
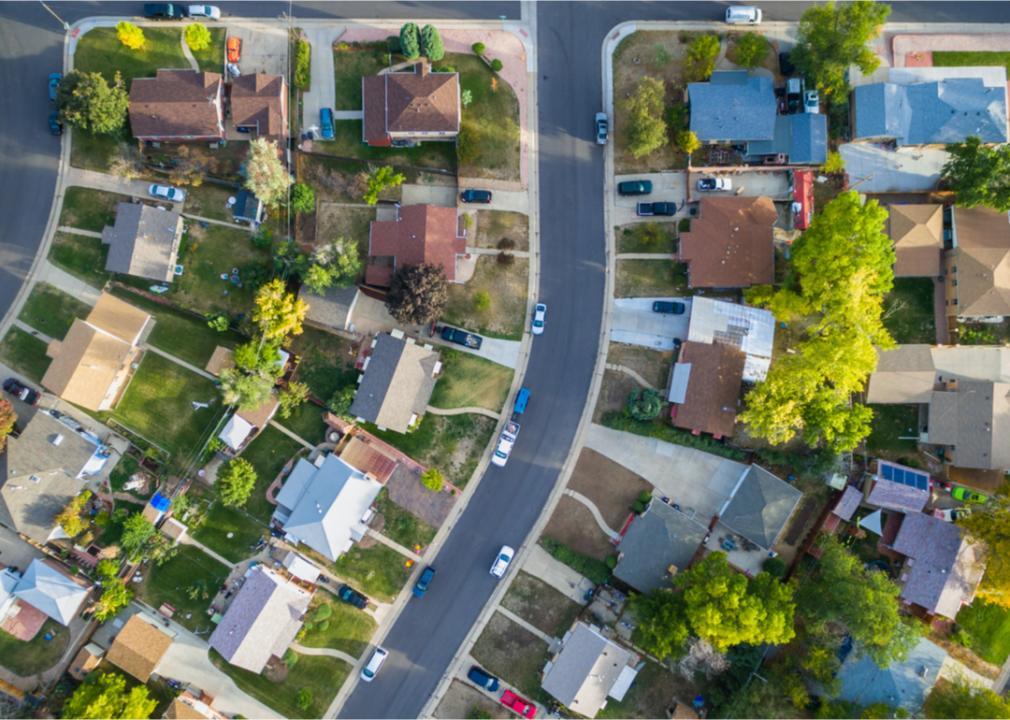
Counties with the most renters in South Carolina
All cities are made up of a mix of homeowners and renters, with 58.6% of Americans owning their own homes and 30.4% rending in the fourth quarter of 2020, according to the American Census Bureau. In cities, there tend to be higher rates of renters due to high property values and influxes of young people who flock to urban areas after college to enter the workforce.
Stacker compiled a list of the counties with most renters in South Carolina using data from the U.S. Census Bureau. Counties are ranked by percent of housing units occupied by renters as of 2019 5-year estimates. Keep reading to see if your county made the list.
You may also like:
Best counties to raise a family in South Carolina
#30. Newberry County
- Housing units occupied by renters: 26.7%
- 2019 median gross rent: $765 (+14.5% change in rent since 2015)
--- #21 highest rent among counties in South Carolina, #1,217 among all counties nationwide
- Renters paying over 35% of household income: 45.2%
--- #10 most common among counties in South Carolina, #323 among all counties nationwide
- 2019 median gross rent: $765 (+14.5% change in rent since 2015)
--- #21 highest rent among counties in South Carolina, #1,217 among all counties nationwide
- Renters paying over 35% of household income: 45.2%
--- #10 most common among counties in South Carolina, #323 among all counties nationwide
#29. Williamsburg County
- Housing units occupied by renters: 27.0%
- 2019 median gross rent: $625 (+9.8% change in rent since 2015)
--- #39 highest rent among counties in South Carolina, #2,426 among all counties nationwide
- Renters paying over 35% of household income: 40.4%
--- #27 most common among counties in South Carolina, #794 among all counties nationwide
- 2019 median gross rent: $625 (+9.8% change in rent since 2015)
--- #39 highest rent among counties in South Carolina, #2,426 among all counties nationwide
- Renters paying over 35% of household income: 40.4%
--- #27 most common among counties in South Carolina, #794 among all counties nationwide
#28. Oconee County
- Housing units occupied by renters: 27.3%
- 2019 median gross rent: $762 (+13.7% change in rent since 2015)
--- #22 highest rent among counties in South Carolina, #1,234 among all counties nationwide
- Renters paying over 35% of household income: 42.9%
--- #14 most common among counties in South Carolina, #507 among all counties nationwide
- 2019 median gross rent: $762 (+13.7% change in rent since 2015)
--- #22 highest rent among counties in South Carolina, #1,234 among all counties nationwide
- Renters paying over 35% of household income: 42.9%
--- #14 most common among counties in South Carolina, #507 among all counties nationwide
#27. Aiken County
- Housing units occupied by renters: 27.4%
- 2019 median gross rent: $819 (+17.7% change in rent since 2015)
--- #12 highest rent among counties in South Carolina, #907 among all counties nationwide
- Renters paying over 35% of household income: 42.1%
--- #21 most common among counties in South Carolina, #589 among all counties nationwide
- 2019 median gross rent: $819 (+17.7% change in rent since 2015)
--- #12 highest rent among counties in South Carolina, #907 among all counties nationwide
- Renters paying over 35% of household income: 42.1%
--- #21 most common among counties in South Carolina, #589 among all counties nationwide
#26. York County
- Housing units occupied by renters: 28.0%
- 2019 median gross rent: $980 (+17.5% change in rent since 2015)
--- #5 highest rent among counties in South Carolina, #446 among all counties nationwide
- Renters paying over 35% of household income: 37.2%
--- #35 most common among counties in South Carolina, #1,259 among all counties nationwide
- 2019 median gross rent: $980 (+17.5% change in rent since 2015)
--- #5 highest rent among counties in South Carolina, #446 among all counties nationwide
- Renters paying over 35% of household income: 37.2%
--- #35 most common among counties in South Carolina, #1,259 among all counties nationwide
You may also like:
Highest-rated things to do in South Carolina, according to Tripadvisor
#25. Berkeley County
- Housing units occupied by renters: 28.1%
- 2019 median gross rent: $1,109 (+13.0% change in rent since 2015)
--- #3 highest rent among counties in South Carolina, #262 among all counties nationwide
- Renters paying over 35% of household income: 35.5%
--- #40 most common among counties in South Carolina, #1,550 among all counties nationwide
#24. Horry County
- Housing units occupied by renters: 28.2%
- 2019 median gross rent: $959 (+13.8% change in rent since 2015)
--- #7 highest rent among counties in South Carolina, #483 among all counties nationwide
- Renters paying over 35% of household income: 42.3%
--- #19 most common among counties in South Carolina, #568 among all counties nationwide
- 2019 median gross rent: $959 (+13.8% change in rent since 2015)
--- #7 highest rent among counties in South Carolina, #483 among all counties nationwide
- Renters paying over 35% of household income: 42.3%
--- #19 most common among counties in South Carolina, #568 among all counties nationwide
#23. Anderson County
- Housing units occupied by renters: 28.3%
- 2019 median gross rent: $778 (+15.3% change in rent since 2015)
--- #16 highest rent among counties in South Carolina, #1,123 among all counties nationwide
- Renters paying over 35% of household income: 36.8%
--- #37 most common among counties in South Carolina, #1,340 among all counties nationwide
#22. Dorchester County
- Housing units occupied by renters: 28.3%
- 2019 median gross rent: $1,099 (+16.1% change in rent since 2015)
--- #4 highest rent among counties in South Carolina, #273 among all counties nationwide
- Renters paying over 35% of household income: 40.5%
--- #26 most common among counties in South Carolina, #777 among all counties nationwide
- 2019 median gross rent: $1,099 (+16.1% change in rent since 2015)
--- #4 highest rent among counties in South Carolina, #273 among all counties nationwide
- Renters paying over 35% of household income: 40.5%
--- #26 most common among counties in South Carolina, #777 among all counties nationwide
#21. Jasper County
- Housing units occupied by renters: 28.3%
- 2019 median gross rent: $929 (+18.5% change in rent since 2015)
--- #8 highest rent among counties in South Carolina, #542 among all counties nationwide
- Renters paying over 35% of household income: 44.9%
--- #11 most common among counties in South Carolina, #342 among all counties nationwide
- 2019 median gross rent: $929 (+18.5% change in rent since 2015)
--- #8 highest rent among counties in South Carolina, #542 among all counties nationwide
- Renters paying over 35% of household income: 44.9%
--- #11 most common among counties in South Carolina, #342 among all counties nationwide
You may also like:
States sending the most people to South Carolina
#20. Chesterfield County
- Housing units occupied by renters: 28.9%
- 2019 median gross rent: $670 (+16.1% change in rent since 2015)
--- #33 highest rent among counties in South Carolina, #1,992 among all counties nationwide
- Renters paying over 35% of household income: 31.3%
--- #43 most common among counties in South Carolina, #2,163 among all counties nationwide
#19. Bamberg County
- Housing units occupied by renters: 29.4%
- 2019 median gross rent: $794 (+30.8% change in rent since 2015)
--- #14 highest rent among counties in South Carolina, #1,027 among all counties nationwide
- Renters paying over 35% of household income: 66.3%
--- #1 most common among counties in South Carolina, #3 among all counties nationwide
- 2019 median gross rent: $794 (+30.8% change in rent since 2015)
--- #14 highest rent among counties in South Carolina, #1,027 among all counties nationwide
- Renters paying over 35% of household income: 66.3%
--- #1 most common among counties in South Carolina, #3 among all counties nationwide
#18. Spartanburg County
- Housing units occupied by renters: 29.4%
- 2019 median gross rent: $794 (+12.3% change in rent since 2015)
--- #14 highest rent among counties in South Carolina, #1,027 among all counties nationwide
- Renters paying over 35% of household income: 36.7%
--- #38 most common among counties in South Carolina, #1,362 among all counties nationwide
#17. Laurens County
- Housing units occupied by renters: 30.2%
- 2019 median gross rent: $734 (+12.2% change in rent since 2015)
--- #24 highest rent among counties in South Carolina, #1,408 among all counties nationwide
- Renters paying over 35% of household income: 40.3%
--- #28 most common among counties in South Carolina, #814 among all counties nationwide
- 2019 median gross rent: $734 (+12.2% change in rent since 2015)
--- #24 highest rent among counties in South Carolina, #1,408 among all counties nationwide
- Renters paying over 35% of household income: 40.3%
--- #28 most common among counties in South Carolina, #814 among all counties nationwide
#16. Barnwell County
- Housing units occupied by renters: 30.4%
- 2019 median gross rent: $621 (+2.8% change in rent since 2015)
--- #40 highest rent among counties in South Carolina, #2,464 among all counties nationwide
- Renters paying over 35% of household income: 48.2%
--- #7 most common among counties in South Carolina, #163 among all counties nationwide
- 2019 median gross rent: $621 (+2.8% change in rent since 2015)
--- #40 highest rent among counties in South Carolina, #2,464 among all counties nationwide
- Renters paying over 35% of household income: 48.2%
--- #7 most common among counties in South Carolina, #163 among all counties nationwide
You may also like:
Where refugees in South Carolina are arriving from
#15. Darlington County
- Housing units occupied by renters: 30.4%
- 2019 median gross rent: $675 (+8.3% change in rent since 2015)
--- #32 highest rent among counties in South Carolina, #1,944 among all counties nationwide
- Renters paying over 35% of household income: 42.7%
--- #16 most common among counties in South Carolina, #523 among all counties nationwide
- 2019 median gross rent: $675 (+8.3% change in rent since 2015)
--- #32 highest rent among counties in South Carolina, #1,944 among all counties nationwide
- Renters paying over 35% of household income: 42.7%
--- #16 most common among counties in South Carolina, #523 among all counties nationwide
#14. Cherokee County
- Housing units occupied by renters: 31.1%
- 2019 median gross rent: $712 (+12.5% change in rent since 2015)
--- #27 highest rent among counties in South Carolina, #1,600 among all counties nationwide
- Renters paying over 35% of household income: 42.1%
--- #21 most common among counties in South Carolina, #589 among all counties nationwide
- 2019 median gross rent: $712 (+12.5% change in rent since 2015)
--- #27 highest rent among counties in South Carolina, #1,600 among all counties nationwide
- Renters paying over 35% of household income: 42.1%
--- #21 most common among counties in South Carolina, #589 among all counties nationwide
#13. Union County
- Housing units occupied by renters: 31.7%
- 2019 median gross rent: $690 (+14.2% change in rent since 2015)
--- #29 highest rent among counties in South Carolina, #1,803 among all counties nationwide
- Renters paying over 35% of household income: 36.2%
--- #39 most common among counties in South Carolina, #1,445 among all counties nationwide
#12. Allendale County
- Housing units occupied by renters: 31.8%
- 2019 median gross rent: $602 (+4.2% change in rent since 2015)
--- #44 highest rent among counties in South Carolina, #2,617 among all counties nationwide
- Renters paying over 35% of household income: 51.3%
--- #5 most common among counties in South Carolina, #82 among all counties nationwide
- 2019 median gross rent: $602 (+4.2% change in rent since 2015)
--- #44 highest rent among counties in South Carolina, #2,617 among all counties nationwide
- Renters paying over 35% of household income: 51.3%
--- #5 most common among counties in South Carolina, #82 among all counties nationwide
#11. Greenville County
- Housing units occupied by renters: 32.5%
- 2019 median gross rent: $918 (+19.1% change in rent since 2015)
--- #9 highest rent among counties in South Carolina, #572 among all counties nationwide
- Renters paying over 35% of household income: 35.4%
--- #41 most common among counties in South Carolina, #1,563 among all counties nationwide
- 2019 median gross rent: $918 (+19.1% change in rent since 2015)
--- #9 highest rent among counties in South Carolina, #572 among all counties nationwide
- Renters paying over 35% of household income: 35.4%
--- #41 most common among counties in South Carolina, #1,563 among all counties nationwide
#10. Orangeburg County
- Housing units occupied by renters: 32.7%
- 2019 median gross rent: $687 (+3.9% change in rent since 2015)
--- #30 highest rent among counties in South Carolina, #1,833 among all counties nationwide
- Renters paying over 35% of household income: 42.0%
--- #23 most common among counties in South Carolina, #604 among all counties nationwide
- 2019 median gross rent: $687 (+3.9% change in rent since 2015)
--- #30 highest rent among counties in South Carolina, #1,833 among all counties nationwide
- Renters paying over 35% of household income: 42.0%
--- #23 most common among counties in South Carolina, #604 among all counties nationwide
#9. Pickens County
- Housing units occupied by renters: 32.9%
- 2019 median gross rent: $768 (+9.1% change in rent since 2015)
--- #20 highest rent among counties in South Carolina, #1,189 among all counties nationwide
- Renters paying over 35% of household income: 42.6%
--- #18 most common among counties in South Carolina, #535 among all counties nationwide
- 2019 median gross rent: $768 (+9.1% change in rent since 2015)
--- #20 highest rent among counties in South Carolina, #1,189 among all counties nationwide
- Renters paying over 35% of household income: 42.6%
--- #18 most common among counties in South Carolina, #535 among all counties nationwide
#8. Marion County
- Housing units occupied by renters: 34.0%
- 2019 median gross rent: $594 (+19.8% change in rent since 2015)
--- #45 highest rent among counties in South Carolina, #2,667 among all counties nationwide
- Renters paying over 35% of household income: 37.7%
--- #34 most common among counties in South Carolina, #1,166 among all counties nationwide
#7. Florence County
- Housing units occupied by renters: 34.3%
- 2019 median gross rent: $772 (+14.2% change in rent since 2015)
--- #19 highest rent among counties in South Carolina, #1,161 among all counties nationwide
- Renters paying over 35% of household income: 36.9%
--- #36 most common among counties in South Carolina, #1,321 among all counties nationwide
#6. Sumter County
- Housing units occupied by renters: 35.4%
- 2019 median gross rent: $800 (+7.1% change in rent since 2015)
--- #13 highest rent among counties in South Carolina, #989 among all counties nationwide
- Renters paying over 35% of household income: 37.9%
--- #31 most common among counties in South Carolina, #1,132 among all counties nationwide
- 2019 median gross rent: $800 (+7.1% change in rent since 2015)
--- #13 highest rent among counties in South Carolina, #989 among all counties nationwide
- Renters paying over 35% of household income: 37.9%
--- #31 most common among counties in South Carolina, #1,132 among all counties nationwide
You may also like:
Highest-rated breweries in South Carolina
#5. Greenwood County
- Housing units occupied by renters: 36.0%
- 2019 median gross rent: $733 (+11.6% change in rent since 2015)
--- #25 highest rent among counties in South Carolina, #1,414 among all counties nationwide
- Renters paying over 35% of household income: 41.8%
--- #24 most common among counties in South Carolina, #633 among all counties nationwide
- 2019 median gross rent: $733 (+11.6% change in rent since 2015)
--- #25 highest rent among counties in South Carolina, #1,414 among all counties nationwide
- Renters paying over 35% of household income: 41.8%
--- #24 most common among counties in South Carolina, #633 among all counties nationwide
#4. Marlboro County
- Housing units occupied by renters: 37.1%
- 2019 median gross rent: $610 (+7.6% change in rent since 2015)
--- #41 highest rent among counties in South Carolina, #2,565 among all counties nationwide
- Renters paying over 35% of household income: 42.9%
--- #14 most common among counties in South Carolina, #507 among all counties nationwide
- 2019 median gross rent: $610 (+7.6% change in rent since 2015)
--- #41 highest rent among counties in South Carolina, #2,565 among all counties nationwide
- Renters paying over 35% of household income: 42.9%
--- #14 most common among counties in South Carolina, #507 among all counties nationwide
#3. Charleston County
- Housing units occupied by renters: 38.4%
- 2019 median gross rent: $1,190 (+20.0% change in rent since 2015)
--- #2 highest rent among counties in South Carolina, #184 among all counties nationwide
- Renters paying over 35% of household income: 42.7%
--- #16 most common among counties in South Carolina, #523 among all counties nationwide
- 2019 median gross rent: $1,190 (+20.0% change in rent since 2015)
--- #2 highest rent among counties in South Carolina, #184 among all counties nationwide
- Renters paying over 35% of household income: 42.7%
--- #16 most common among counties in South Carolina, #523 among all counties nationwide
#2. Richland County
- Housing units occupied by renters: 40.5%
- 2019 median gross rent: $972 (+11.1% change in rent since 2015)
--- #6 highest rent among counties in South Carolina, #460 among all counties nationwide
- Renters paying over 35% of household income: 43.7%
--- #12 most common among counties in South Carolina, #440 among all counties nationwide
- 2019 median gross rent: $972 (+11.1% change in rent since 2015)
--- #6 highest rent among counties in South Carolina, #460 among all counties nationwide
- Renters paying over 35% of household income: 43.7%
--- #12 most common among counties in South Carolina, #440 among all counties nationwide
#1. Dillon County
- Housing units occupied by renters: 40.6%
- 2019 median gross rent: $590 (+11.3% change in rent since 2015)
--- #46 highest rent among counties in South Carolina, #2,686 among all counties nationwide
- Renters paying over 35% of household income: 50.3%
--- #6 most common among counties in South Carolina, #113 among all counties nationwide
- 2019 median gross rent: $590 (+11.3% change in rent since 2015)
--- #46 highest rent among counties in South Carolina, #2,686 among all counties nationwide
- Renters paying over 35% of household income: 50.3%
--- #6 most common among counties in South Carolina, #113 among all counties nationwide
You may also like:
Cities with the most expensive homes in South Carolina


