Most diverse counties in California

·Stacker

Canva
Canva

The United States has a longstanding reputation as being a melting pot (or salad bowl), with its diversity manifesting itself across many different demographics. However, some places across the country are notably more heterogeneous than others.

Stacker compiled a list of the most diverse counties in California using data from using data from the U.S. Census Bureau. Counties are ranked by the highest Simpson's diversity index score. Simpson's diversity index measures community diversity on a scale of 0 (least diverse) to 1 (most diverse), more on the calculation can be read here.

Think you know which counties in your home state might be the most diverse? Keep reading to see if your predictions are correct.

You may also like: Hottest Septembers in California since 1895

#50. El Dorado County

DimiTalen // Wikimedia Commons

1 / 50

#50. El Dorado County

- Index: 0.228
- Total population: 188,563
- White: 87.6% (165,234)
- Black or African American: 0.8% (1,516)
- American Indian and Alaska Native: 0.8% (1,532)
- Asian: 4.5% (8,540)
- Native Hawaiian and other Pacific Islander: 0.3% (486)
- 2 or more races: 3.9% (7,263)
- Some other Race: 2.1% (3,992)
#49. Amador County

Bobak Ha'Eri // Wikimedia Commons

2 / 50

#49. Amador County

- Index: 0.243
- Total population: 38,429
- White: 86.7% (33,327)
- Black or African American: 2.4% (904)
- American Indian and Alaska Native: 0.8% (303)
- Asian: 1.3% (508)
- Native Hawaiian and other Pacific Islander: 0.1% (57)
- 2 or more races: 4.8% (1,830)
- Some other Race: 3.9% (1,500)
#48. Shasta County

Doug Kerr // Wikicommons

3 / 50

#48. Shasta County

- Index: 0.247
- Total population: 179,212
- White: 86.6% (155,124)
- Black or African American: 1.2% (2,088)
- American Indian and Alaska Native: 2.7% (4,832)
- Asian: 3.2% (5,798)
- Native Hawaiian and other Pacific Islander: 0.1% (254)
- 2 or more races: 4.2% (7,509)
- Some other Race: 2.0% (3,607)
#47. Trinity County

Almonroth // Wikimedia Commons

4 / 50

#47. Trinity County

- Index: 0.255
- Total population: 12,700
- White: 86.0% (10,924)
- Black or African American: 1.0% (127)
- American Indian and Alaska Native: 5.6% (716)
- Asian: 1.8% (226)
- Native Hawaiian and other Pacific Islander: 0.2% (28)
- 2 or more races: 2.0% (251)
- Some other Race: 3.4% (428)
#46. Tehama County

Frank Schulenburg // Wikimedia Commons

5 / 50

#46. Tehama County

- Index: 0.259
- Total population: 63,912
- White: 85.7% (54,795)
- Black or African American: 0.8% (530)
- American Indian and Alaska Native: 2.0% (1,255)
- Asian: 1.5% (967)
- Native Hawaiian and other Pacific Islander: 0.0% (28)
- 2 or more races: 4.5% (2,867)
- Some other Race: 5.4% (3,470)

You may also like: See how popular pumpkin spice is in California

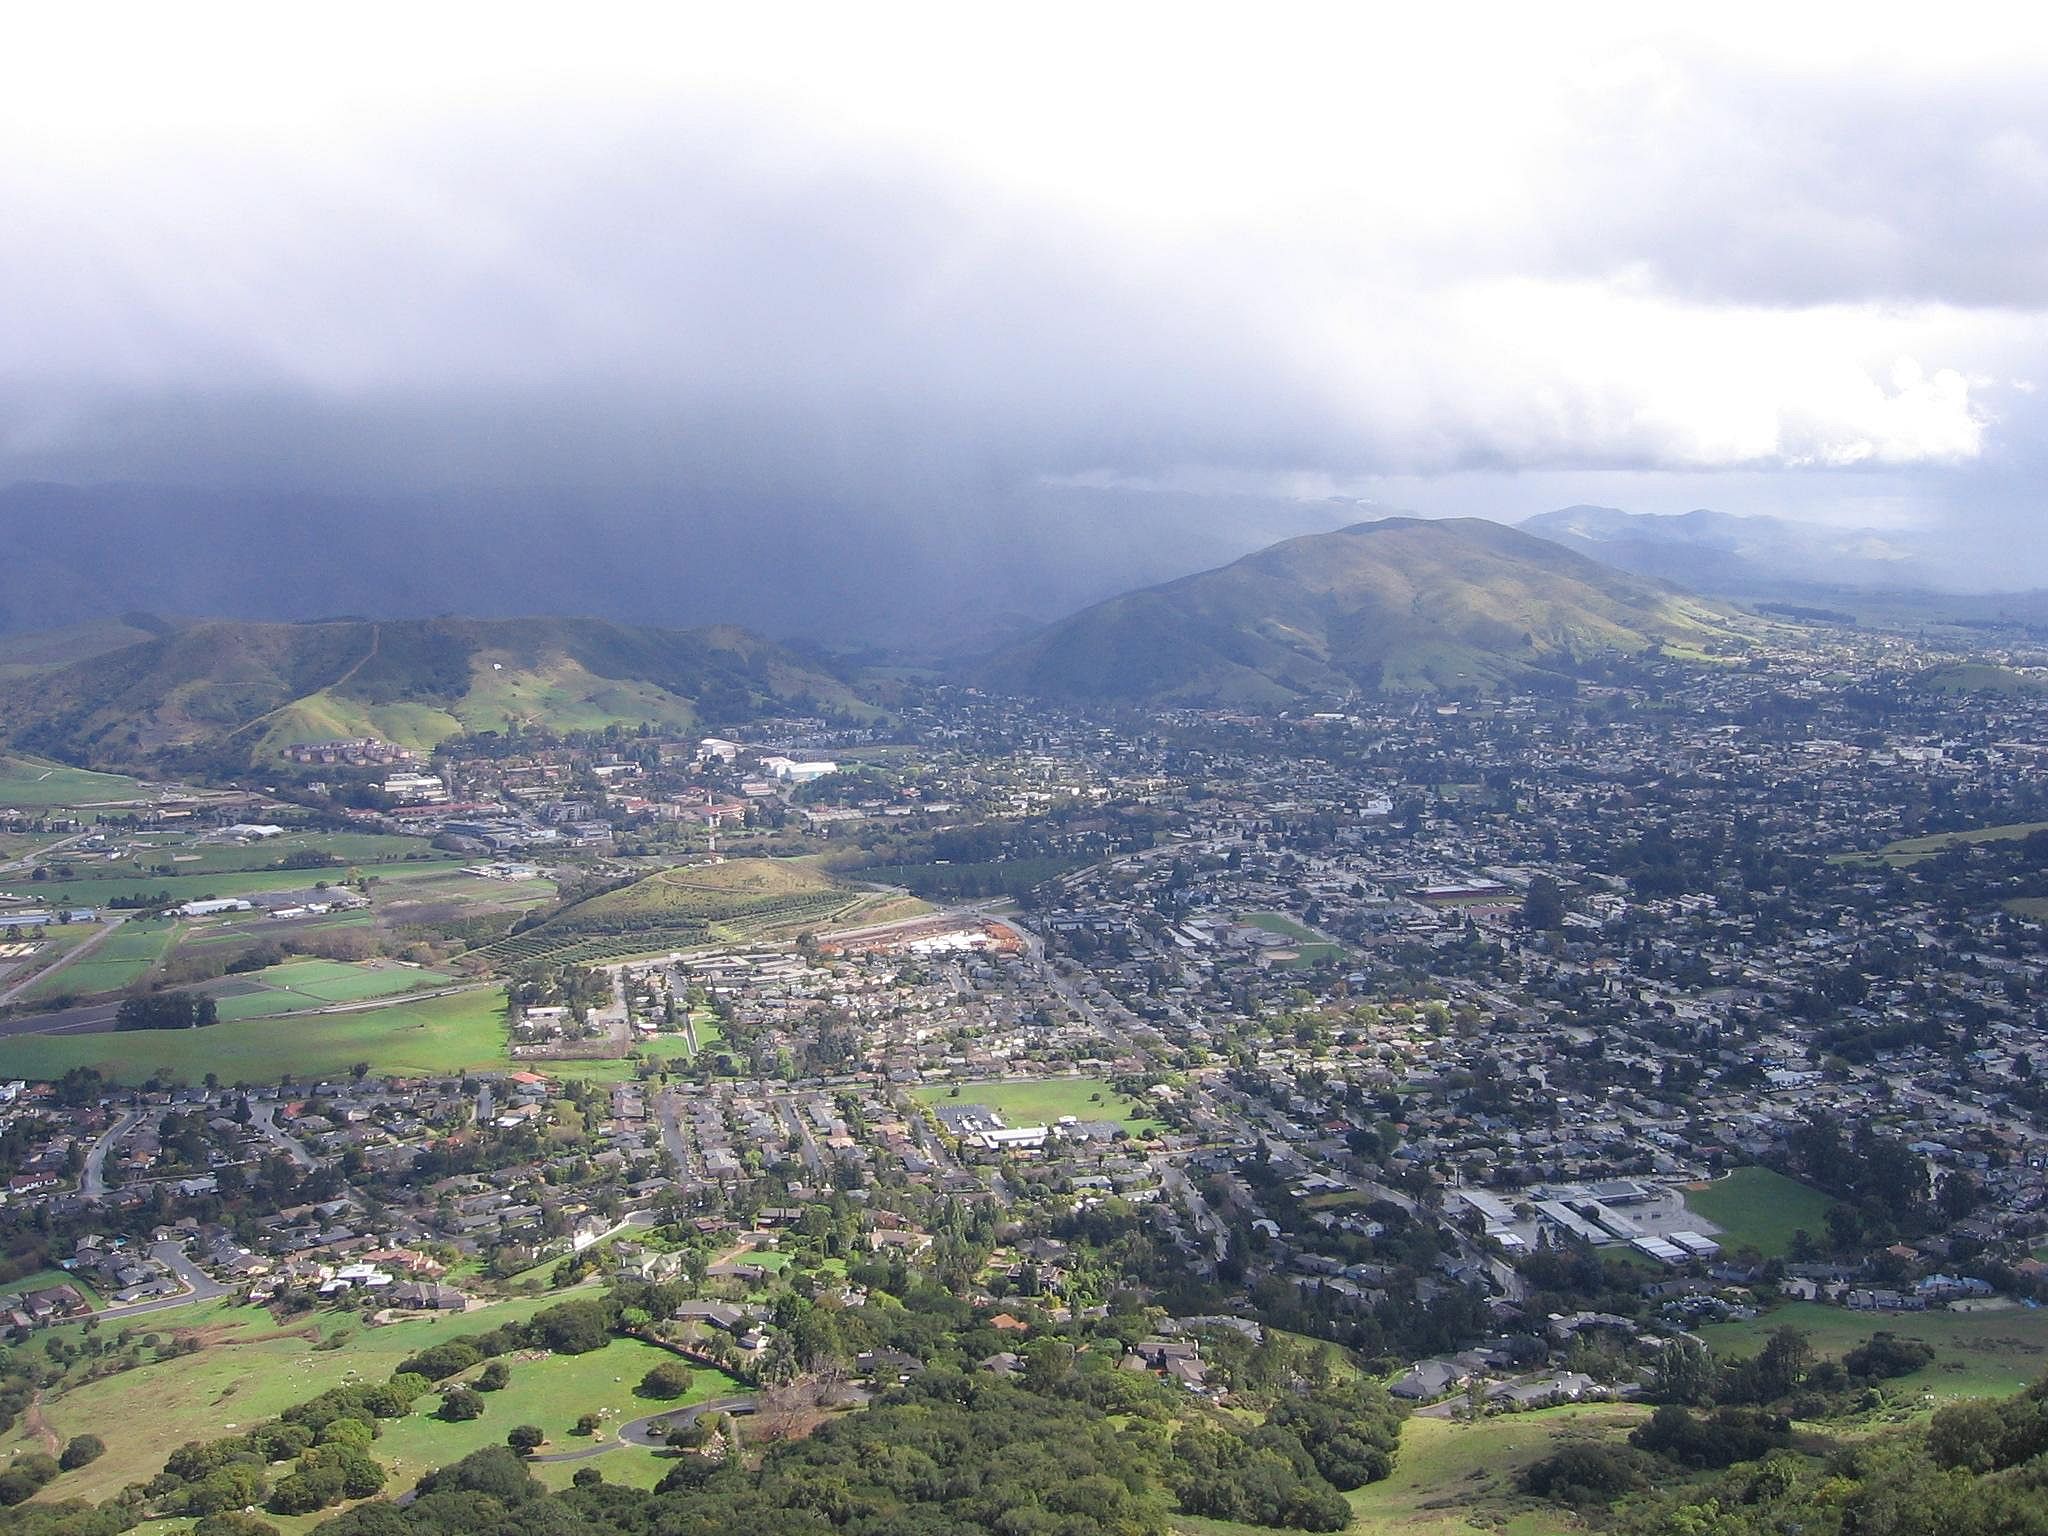
#45. San Luis Obispo County

Basar // Wikicommons

6 / 50

#45. San Luis Obispo County

- Index: 0.265
- Total population: 282,165
- White: 85.5% (241,123)
- Black or African American: 1.9% (5,319)
- American Indian and Alaska Native: 0.9% (2,458)
- Asian: 3.6% (10,296)
- Native Hawaiian and other Pacific Islander: 0.1% (265)
- 2 or more races: 3.7% (10,437)
- Some other Race: 4.3% (12,267)
#44. Siskiyou County

Chmee2 // Wikimedia Commons

7 / 50

#44. Siskiyou County

- Index: 0.275
- Total population: 43,468
- White: 84.8% (36,847)
- Black or African American: 1.6% (695)
- American Indian and Alaska Native: 3.7% (1,618)
- Asian: 1.6% (708)
- Native Hawaiian and other Pacific Islander: 0.4% (157)
- 2 or more races: 6.5% (2,807)
- Some other Race: 1.5% (636)
#43. Mendocino County

Binksternet // Wikimedia Commons

8 / 50

#43. Mendocino County

- Index: 0.294
- Total population: 87,224
- White: 83.6% (72,935)
- Black or African American: 0.7% (628)
- American Indian and Alaska Native: 4.4% (3,818)
- Asian: 2.1% (1,805)
- Native Hawaiian and other Pacific Islander: 0.2% (165)
- 2 or more races: 4.9% (4,290)
- Some other Race: 4.1% (3,583)
#42. Mono County

clr_flickr from Rocklin, USA // Wikimedia Commons

9 / 50

#42. Mono County

- Index: 0.299
- Total population: 14,310
- White: 83.3% (11,921)
- Black or African American: 0.8% (111)
- American Indian and Alaska Native: 3.5% (497)
- Asian: 2.6% (367)
- Native Hawaiian and other Pacific Islander: 0.0% (0)
- 2 or more races: 3.7% (532)
- Some other Race: 6.2% (882)
10 / 50

#41. Lassen County

- Index: 0.315
- Total population: 30,818
- White: 82.2% (25,324)
- Black or African American: 8.7% (2,686)
- American Indian and Alaska Native: 2.8% (864)
- Asian: 1.4% (428)
- Native Hawaiian and other Pacific Islander: 0.8% (247)
- 2 or more races: 2.5% (759)
- Some other Race: 1.7% (510)

You may also like: See the most extreme temperatures in California history

#40. Placer County

Doug Olson // Wikimedia Commons

11 / 50

#40. Placer County

- Index: 0.316
- Total population: 385,512
- White: 82.2% (316,716)
- Black or African American: 1.7% (6,626)
- American Indian and Alaska Native: 0.5% (2,052)
- Asian: 7.5% (28,909)
- Native Hawaiian and other Pacific Islander: 0.2% (858)
- 2 or more races: 4.9% (18,993)
- Some other Race: 2.9% (11,358)
#39. San Benito County

Michael Patrick // Wikimedia Commons

12 / 50

#39. San Benito County

- Index: 0.324
- Total population: 60,376
- White: 81.6% (49,245)
- Black or African American: 0.8% (491)
- American Indian and Alaska Native: 0.7% (443)
- Asian: 3.0% (1,804)
- Native Hawaiian and other Pacific Islander: 0.1% (57)
- 2 or more races: 5.3% (3,198)
- Some other Race: 8.5% (5,138)
#38. Butte County

Canva

13 / 50

#38. Butte County

- Index: 0.326
- Total population: 225,817
- White: 81.6% (184,180)
- Black or African American: 1.5% (3,461)
- American Indian and Alaska Native: 1.2% (2,616)
- Asian: 4.6% (10,432)
- Native Hawaiian and other Pacific Islander: 0.3% (603)
- 2 or more races: 6.1% (13,771)
- Some other Race: 4.8% (10,754)
#37. Glenn County

Trance addict // Wikimedia Commons

14 / 50

#37. Glenn County

- Index: 0.330
- Total population: 27,976
- White: 81.1% (22,685)
- Black or African American: 0.8% (230)
- American Indian and Alaska Native: 2.4% (682)
- Asian: 2.9% (825)
- Native Hawaiian and other Pacific Islander: 0.0% (11)
- 2 or more races: 2.3% (645)
- Some other Race: 10.4% (2,898)
#36. Ventura County

Canva

15 / 50

#36. Ventura County

- Index: 0.348
- Total population: 847,263
- White: 80.1% (678,658)
- Black or African American: 1.8% (15,594)
- American Indian and Alaska Native: 0.8% (6,760)
- Asian: 7.3% (62,190)
- Native Hawaiian and other Pacific Islander: 0.2% (1,698)
- 2 or more races: 4.5% (38,136)
- Some other Race: 5.2% (44,227)

You may also like: Best counties to retire to in California

#35. Humboldt County

Cory Maylett // Wikimedia Commons

16 / 50

#35. Humboldt County

- Index: 0.353
- Total population: 135,940
- White: 79.9% (108,557)
- Black or African American: 1.1% (1,506)
- American Indian and Alaska Native: 5.0% (6,846)
- Asian: 3.1% (4,196)
- Native Hawaiian and other Pacific Islander: 0.4% (488)
- 2 or more races: 6.4% (8,640)
- Some other Race: 4.2% (5,707)
#34. Inyo County

Chuck Abbe // Wikimedia Commons

17 / 50

#34. Inyo County

- Index: 0.363
- Total population: 17,977
- White: 78.8% (14,170)
- Black or African American: 0.9% (153)
- American Indian and Alaska Native: 11.3% (2,028)
- Asian: 1.9% (350)
- Native Hawaiian and other Pacific Islander: 0.2% (34)
- 2 or more races: 4.7% (850)
- Some other Race: 2.2% (392)
#33. Marin County

Kglavin // Wikimedia Commons

18 / 50

#33. Marin County

- Index: 0.381
- Total population: 259,943
- White: 77.8% (202,313)
- Black or African American: 2.2% (5,767)
- American Indian and Alaska Native: 0.4% (911)
- Asian: 5.9% (15,367)
- Native Hawaiian and other Pacific Islander: 0.2% (571)
- 2 or more races: 4.9% (12,756)
- Some other Race: 8.6% (22,258)
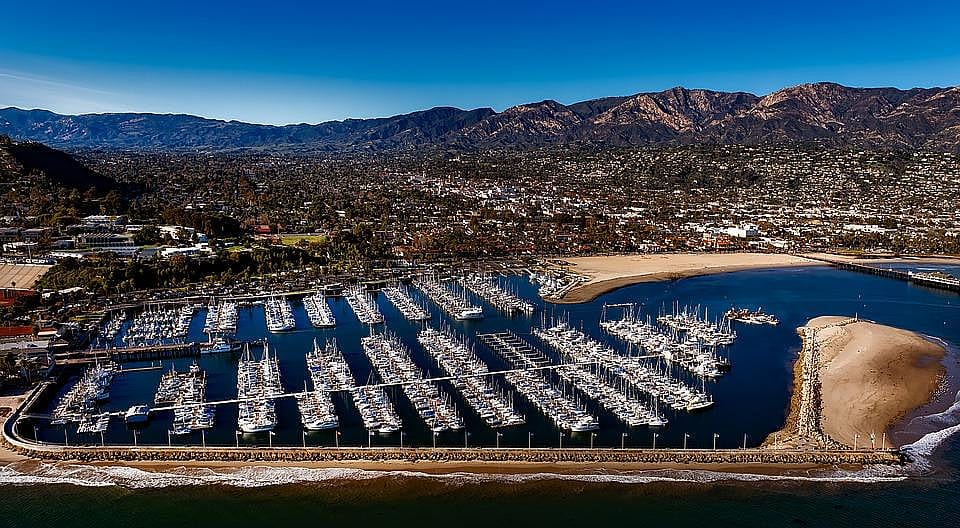
#32. Santa Barbara County

Pixabay

19 / 50

#32. Santa Barbara County

- Index: 0.385
- Total population: 444,829
- White: 77.5% (344,778)
- Black or African American: 2.0% (8,984)
- American Indian and Alaska Native: 1.0% (4,644)
- Asian: 5.6% (24,849)
- Native Hawaiian and other Pacific Islander: 0.1% (581)
- 2 or more races: 4.2% (18,552)
- Some other Race: 9.5% (42,441)
#31. Lake County

CFang // Wikimedia Commons

20 / 50

#31. Lake County

- Index: 0.390
- Total population: 64,195
- White: 76.9% (49,389)
- Black or African American: 2.3% (1,447)
- American Indian and Alaska Native: 3.6% (2,310)
- Asian: 1.1% (723)
- Native Hawaiian and other Pacific Islander: 0.1% (42)
- 2 or more races: 3.7% (2,375)
- Some other Race: 12.3% (7,909)

You may also like: Biggest sources of immigrants to California

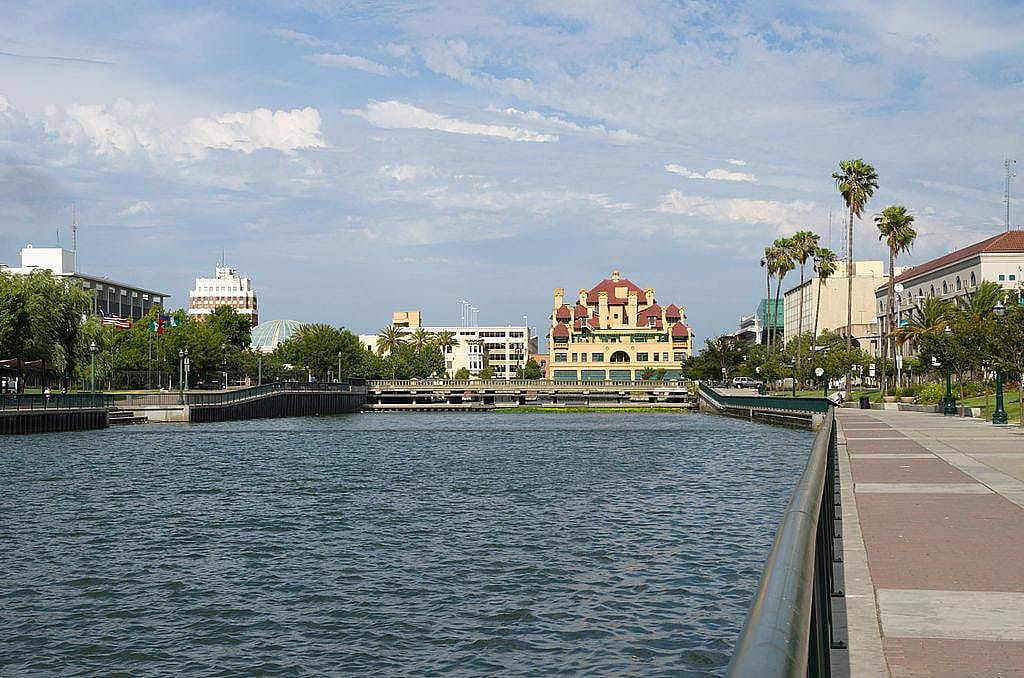
#30. Stanislaus County

Public Domain

21 / 50

#30. Stanislaus County

- Index: 0.400
- Total population: 543,194
- White: 76.6% (415,911)
- Black or African American: 3.0% (16,547)
- American Indian and Alaska Native: 0.8% (4,418)
- Asian: 5.5% (30,007)
- Native Hawaiian and other Pacific Islander: 0.7% (3,961)
- 2 or more races: 4.2% (22,564)
- Some other Race: 9.2% (49,786)
#29. Yuba County

U.S. Army Corps of Engineers Sacramento District // Wikimedia Commons

22 / 50

#29. Yuba County

- Index: 0.409
- Total population: 76,360
- White: 76.0% (58,016)
- Black or African American: 3.4% (2,621)
- American Indian and Alaska Native: 1.2% (936)
- Asian: 6.8% (5,201)
- Native Hawaiian and other Pacific Islander: 0.5% (351)
- 2 or more races: 7.4% (5,654)
- Some other Race: 4.7% (3,581)
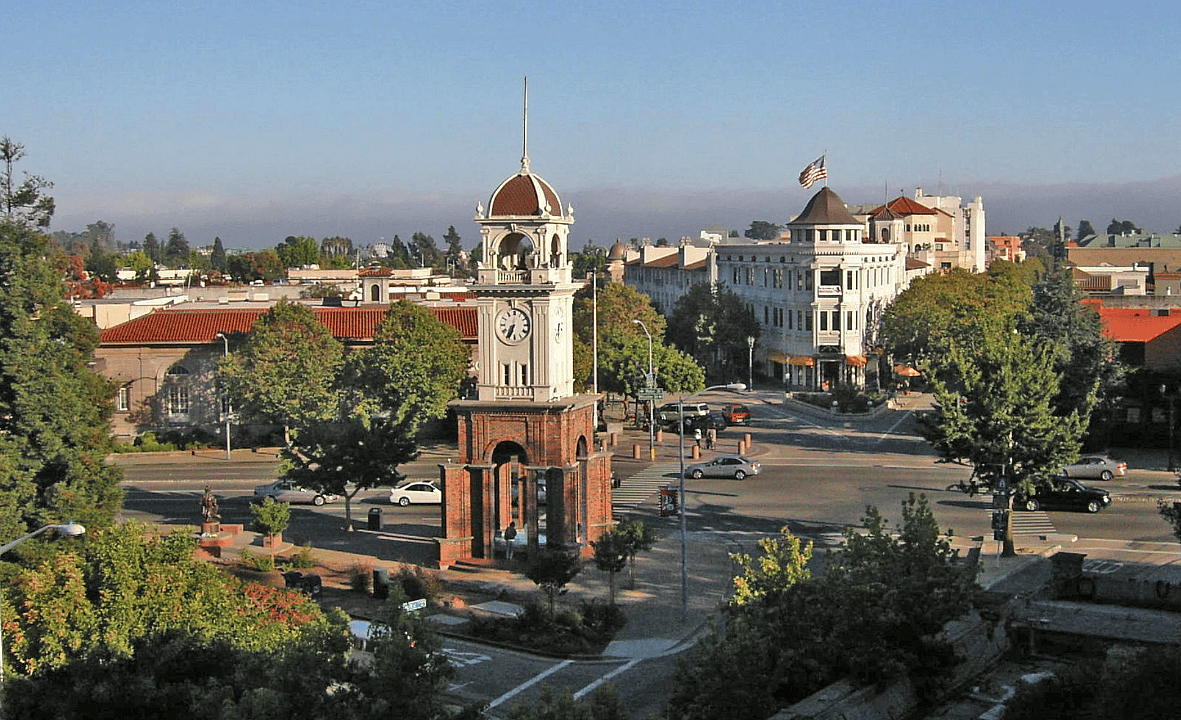
#28. Santa Cruz County

Aaronbrick // Wikicommons

23 / 50

#28. Santa Cruz County

- Index: 0.417
- Total population: 273,962
- White: 74.8% (204,866)
- Black or African American: 1.1% (2,904)
- American Indian and Alaska Native: 0.5% (1,505)
- Asian: 4.8% (13,134)
- Native Hawaiian and other Pacific Islander: 0.1% (337)
- 2 or more races: 4.8% (13,086)
- Some other Race: 13.9% (38,130)
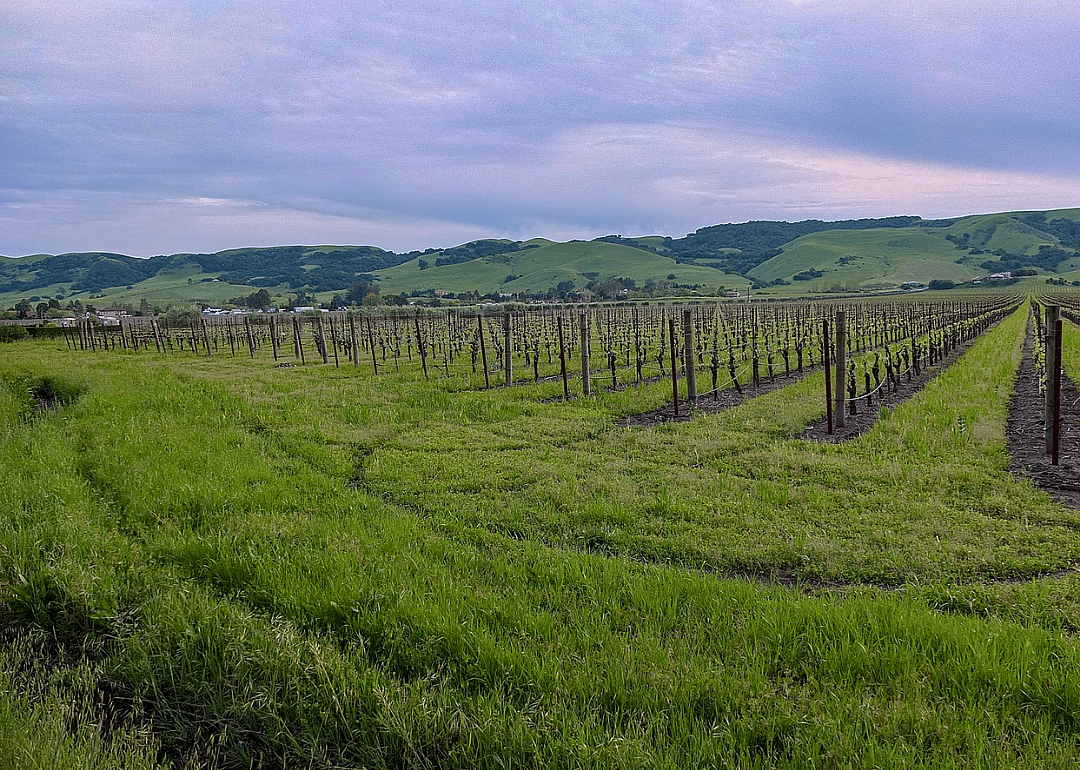
#27. Sonoma County

Fred Hsu // Wikicommons

24 / 50

#27. Sonoma County

- Index: 0.419
- Total population: 499,772
- White: 74.8% (373,667)
- Black or African American: 1.7% (8,269)
- American Indian and Alaska Native: 0.9% (4,395)
- Asian: 4.1% (20,443)
- Native Hawaiian and other Pacific Islander: 0.3% (1,606)
- 2 or more races: 5.4% (26,761)
- Some other Race: 12.9% (64,631)
#26. Del Norte County

Canva

25 / 50

#26. Del Norte County

- Index: 0.426
- Total population: 27,495
- White: 74.9% (20,581)
- Black or African American: 3.4% (940)
- American Indian and Alaska Native: 7.2% (1,986)
- Asian: 3.2% (888)
- Native Hawaiian and other Pacific Islander: 0.2% (44)
- 2 or more races: 6.3% (1,736)
- Some other Race: 4.8% (1,320)

You may also like: Hottest Januarys in California since 1895

#25. Tulare County

Canva

26 / 50

#25. Tulare County

- Index: 0.427
- Total population: 461,898
- White: 73.7% (340,462)
- Black or African American: 1.6% (7,201)
- American Indian and Alaska Native: 1.3% (6,118)
- Asian: 3.6% (16,690)
- Native Hawaiian and other Pacific Islander: 0.2% (766)
- 2 or more races: 3.4% (15,712)
- Some other Race: 16.2% (74,949)
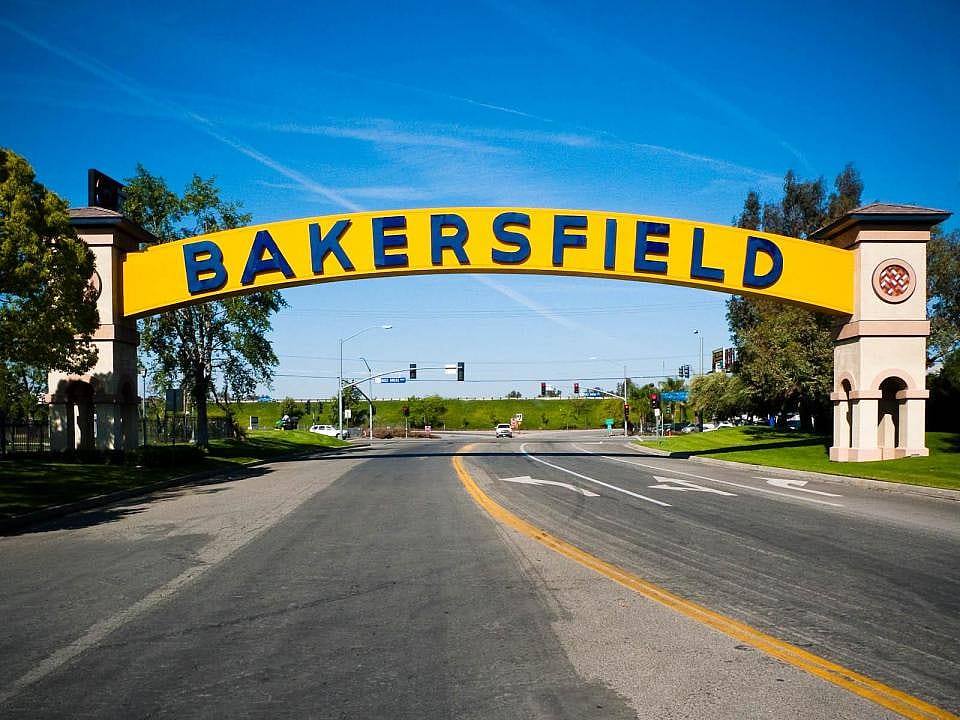
#24. Kern County

nickchapman // Wikicommons

27 / 50

#24. Kern County

- Index: 0.429
- Total population: 887,641
- White: 74.4% (660,147)
- Black or African American: 5.5% (48,550)
- American Indian and Alaska Native: 1.0% (8,969)
- Asian: 4.7% (42,100)
- Native Hawaiian and other Pacific Islander: 0.2% (1,678)
- 2 or more races: 3.5% (31,032)
- Some other Race: 10.7% (95,165)
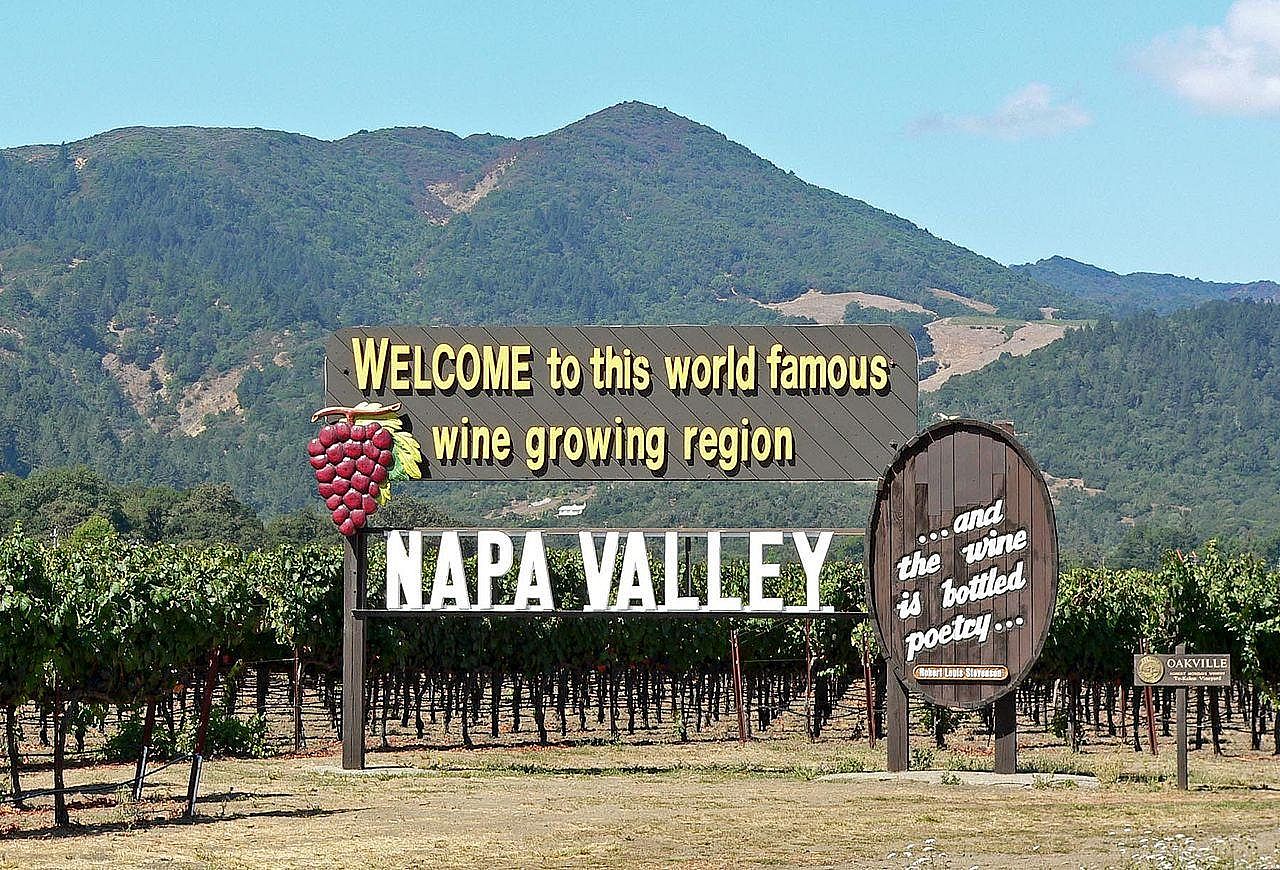
#23. Napa County

Stan Shebs // Wikicommons

28 / 50

#23. Napa County

- Index: 0.440
- Total population: 139,623
- White: 73.4% (102,467)
- Black or African American: 2.1% (2,883)
- American Indian and Alaska Native: 0.9% (1,196)
- Asian: 8.1% (11,352)
- Native Hawaiian and other Pacific Islander: 0.2% (301)
- 2 or more races: 3.9% (5,380)
- Some other Race: 11.5% (16,044)
#22. Madera County

Public Domain

29 / 50

#22. Madera County

- Index: 0.473
- Total population: 155,433
- White: 69.5% (108,100)
- Black or African American: 3.2% (4,949)
- American Indian and Alaska Native: 1.6% (2,489)
- Asian: 2.1% (3,229)
- Native Hawaiian and other Pacific Islander: 0.1% (176)
- 2 or more races: 3.3% (5,061)
- Some other Race: 20.2% (31,429)
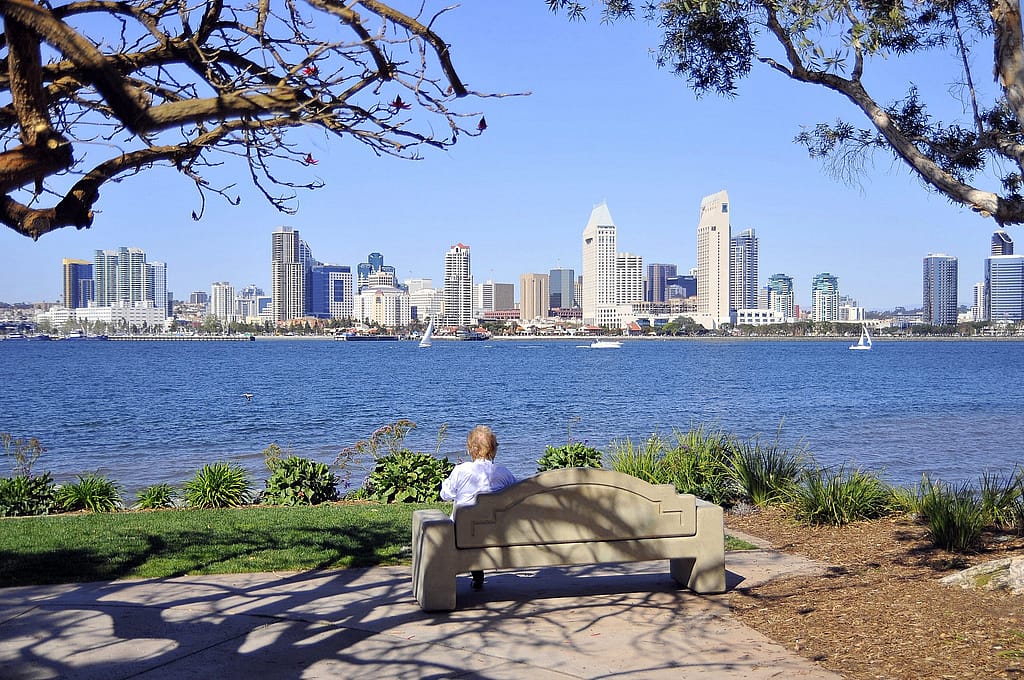
#21. San Diego County

SD Dirk // Flickr

30 / 50

#21. San Diego County

- Index: 0.477
- Total population: 3.3 million
- White: 70.7% (2,345,667)
- Black or African American: 5.0% (166,750)
- American Indian and Alaska Native: 0.7% (22,524)
- Asian: 11.9% (394,742)
- Native Hawaiian and other Pacific Islander: 0.4% (13,867)
- 2 or more races: 5.2% (173,794)
- Some other Race: 6.0% (198,729)

You may also like: Biggest exports from California

#20. Yolo County

Epolk // Wikimedia Commons

31 / 50

#20. Yolo County

- Index: 0.491
- Total population: 217,352
- White: 69.3% (150,617)
- Black or African American: 2.7% (5,847)
- American Indian and Alaska Native: 0.6% (1,306)
- Asian: 14.0% (30,462)
- Native Hawaiian and other Pacific Islander: 0.4% (955)
- 2 or more races: 6.3% (13,659)
- Some other Race: 6.7% (14,506)
#19. Sutter County

Ray Bouknight // Wikicommons

32 / 50

#19. Sutter County

- Index: 0.492
- Total population: 96,109
- White: 69.0% (66,293)
- Black or African American: 1.9% (1,827)
- American Indian and Alaska Native: 0.9% (878)
- Asian: 15.7% (15,048)
- Native Hawaiian and other Pacific Islander: 0.6% (548)
- 2 or more races: 7.1% (6,785)
- Some other Race: 4.9% (4,730)
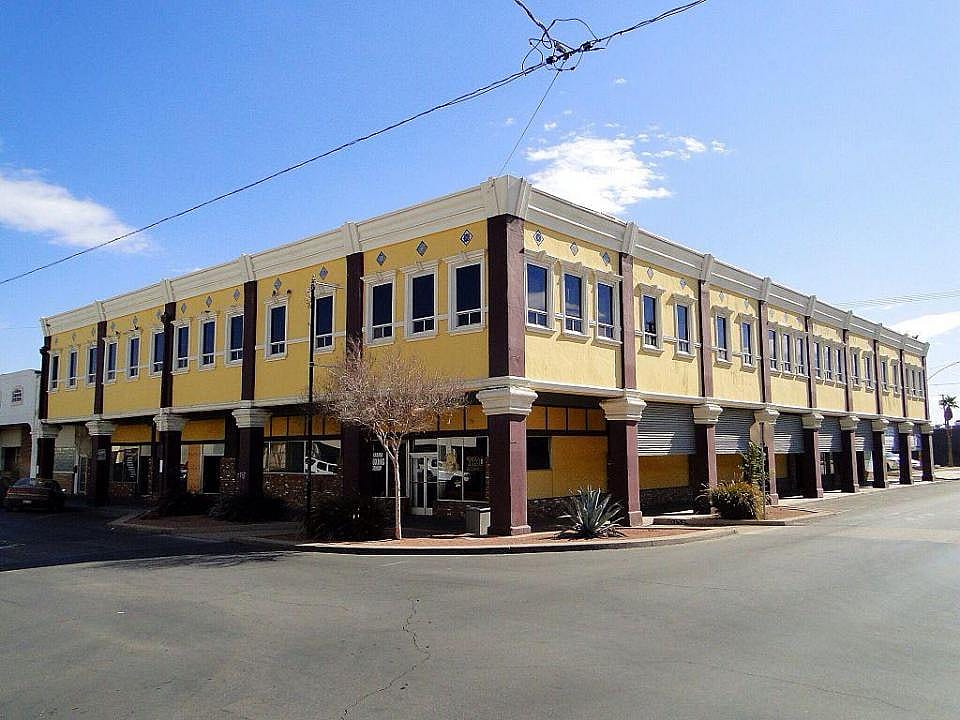
#18. Imperial County

Cbl62 // Wikicommons

33 / 50

#18. Imperial County

- Index: 0.506
- Total population: 180,701
- White: 65.1% (117,658)
- Black or African American: 2.5% (4,489)
- American Indian and Alaska Native: 1.1% (1,912)
- Asian: 1.5% (2,680)
- Native Hawaiian and other Pacific Islander: 0.2% (309)
- 2 or more races: 3.6% (6,514)
- Some other Race: 26.1% (47,139)
#17. Kings County

Armona // Wikicommons

34 / 50

#17. Kings County

- Index: 0.508
- Total population: 150,691
- White: 67.7% (102,062)
- Black or African American: 6.4% (9,642)
- American Indian and Alaska Native: 1.6% (2,431)
- Asian: 3.9% (5,817)
- Native Hawaiian and other Pacific Islander: 0.2% (277)
- 2 or more races: 4.1% (6,143)
- Some other Race: 16.1% (24,319)
#16. Fresno County

David Jordan // Wikicommons

35 / 50

#16. Fresno County

- Index: 0.542
- Total population: 984,521
- White: 65.0% (639,985)
- Black or African American: 4.8% (46,782)
- American Indian and Alaska Native: 1.2% (11,656)
- Asian: 10.3% (101,857)
- Native Hawaiian and other Pacific Islander: 0.2% (1,620)
- 2 or more races: 4.1% (40,384)
- Some other Race: 14.4% (142,237)

You may also like: Countries to which California exports the most goods

#15. Alpine County

Susan Popielaski // Wikimedia Commons

36 / 50

#15. Alpine County

- Index: 0.550
- Total population: 1,039
- White: 57.7% (599)
- Black or African American: 0.9% (9)
- American Indian and Alaska Native: 34.0% (353)
- Asian: 1.0% (10)
- Native Hawaiian and other Pacific Islander: 0.6% (6)
- 2 or more races: 5.1% (53)
- Some other Race: 0.9% (9)
#14. Orange County

Hollywood // Wikimedia Commons

37 / 50

#14. Orange County

- Index: 0.570
- Total population: 3.2 million
- White: 61.0% (1,931,263)
- Black or African American: 1.8% (55,591)
- American Indian and Alaska Native: 0.5% (14,424)
- Asian: 20.5% (649,042)
- Native Hawaiian and other Pacific Islander: 0.3% (10,152)
- 2 or more races: 4.1% (130,009)
- Some other Race: 11.9% (377,563)
#13. San Bernardino County

Canva

38 / 50

#13. San Bernardino County

- Index: 0.581
- Total population: 2.1 million
- White: 61.2% (1,315,238)
- Black or African American: 8.3% (179,292)
- American Indian and Alaska Native: 0.8% (17,782)
- Asian: 7.2% (154,332)
- Native Hawaiian and other Pacific Islander: 0.3% (6,838)
- 2 or more races: 5.0% (106,949)
- Some other Race: 17.2% (368,600)
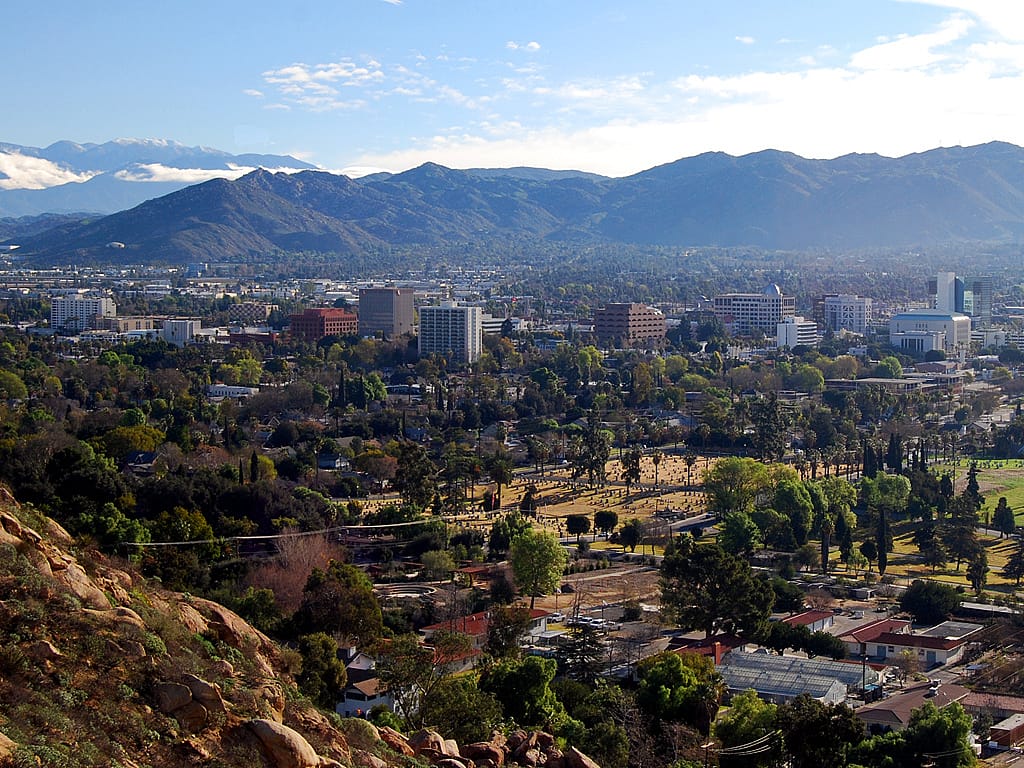
#12. Riverside County

Daniel Orth // Flickr

39 / 50

#12. Riverside County

- Index: 0.584
- Total population: 2.4 million
- White: 59.9% (1,444,654)
- Black or African American: 6.5% (156,836)
- American Indian and Alaska Native: 0.8% (19,765)
- Asian: 6.5% (157,261)
- Native Hawaiian and other Pacific Islander: 0.3% (7,485)
- 2 or more races: 4.4% (106,316)
- Some other Race: 21.5% (519,122)
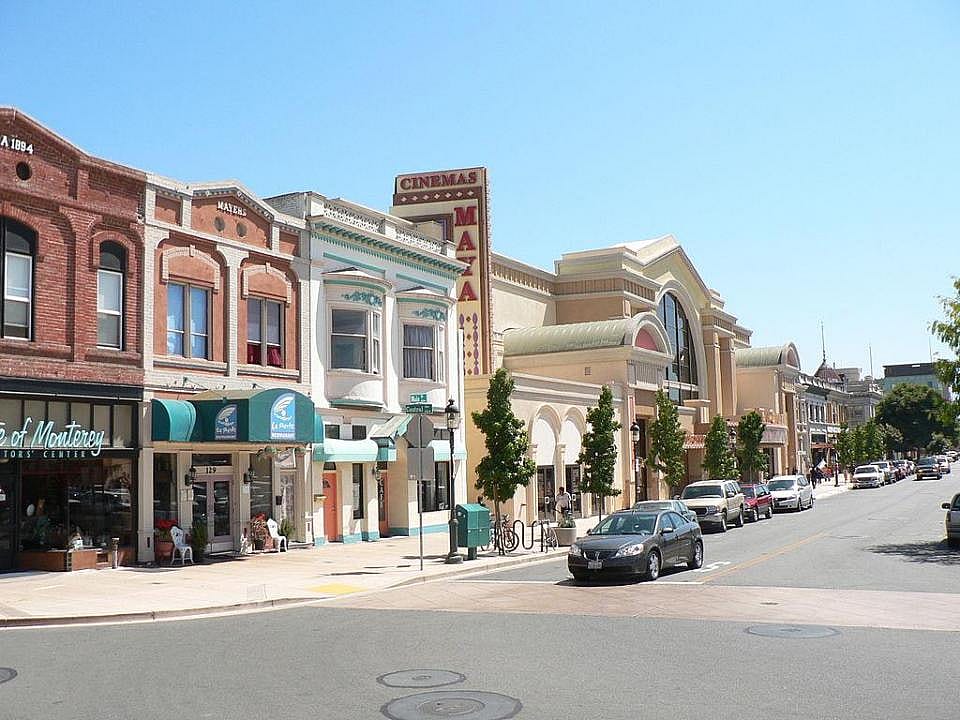
#11. Monterey County

Naotake Murayama // Wikicommons

40 / 50

#11. Monterey County

- Index: 0.601
- Total population: 433,410
- White: 53.3% (230,992)
- Black or African American: 2.6% (11,367)
- American Indian and Alaska Native: 0.7% (2,993)
- Asian: 5.6% (24,326)
- Native Hawaiian and other Pacific Islander: 0.5% (2,135)
- 2 or more races: 4.3% (18,556)
- Some other Race: 33.0% (143,041)

You may also like: Highest-rated Class of 2026 football recruits from California

#10. Merced County

Mark Miller // Wikimedia Commons

41 / 50

#10. Merced County

- Index: 0.604
- Total population: 271,382
- White: 55.1% (149,434)
- Black or African American: 3.2% (8,645)
- American Indian and Alaska Native: 0.9% (2,501)
- Asian: 7.5% (20,349)
- Native Hawaiian and other Pacific Islander: 0.2% (654)
- 2 or more races: 4.1% (11,064)
- Some other Race: 29.0% (78,735)
#9. Sacramento County

Canva

42 / 50

#9. Sacramento County

- Index: 0.625
- Total population: 1.5 million
- White: 57.3% (873,905)
- Black or African American: 9.8% (149,891)
- American Indian and Alaska Native: 0.7% (10,111)
- Asian: 15.7% (239,447)
- Native Hawaiian and other Pacific Islander: 1.1% (17,400)
- 2 or more races: 7.5% (113,877)
- Some other Race: 7.9% (119,922)
#8. San Joaquin County

LPS.1 // Wikicommons

43 / 50

#8. San Joaquin County

- Index: 0.632
- Total population: 742,603
- White: 56.5% (419,288)
- Black or African American: 7.0% (51,931)
- American Indian and Alaska Native: 0.6% (4,706)
- Asian: 15.6% (115,531)
- Native Hawaiian and other Pacific Islander: 0.6% (4,565)
- 2 or more races: 10.9% (81,198)
- Some other Race: 8.8% (65,384)
#7. Contra Costa County

MARELBU // Wikimedia Commons

44 / 50

#7. Contra Costa County

- Index: 0.636
- Total population: 1.1 million
- White: 55.8% (637,904)
- Black or African American: 8.7% (99,642)
- American Indian and Alaska Native: 0.5% (5,506)
- Asian: 16.7% (190,983)
- Native Hawaiian and other Pacific Islander: 0.5% (5,631)
- 2 or more races: 6.8% (77,956)
- Some other Race: 10.9% (124,629)
#6. San Mateo County

Craig Howell // Wikimedia Commons

45 / 50

#6. San Mateo County

- Index: 0.646
- Total population: 767,423
- White: 50.6% (388,318)
- Black or African American: 2.3% (17,784)
- American Indian and Alaska Native: 0.4% (3,002)
- Asian: 28.7% (220,151)
- Native Hawaiian and other Pacific Islander: 1.4% (10,366)
- 2 or more races: 5.7% (43,492)
- Some other Race: 11.0% (84,310)

You may also like: Hottest months in California since 1895

#5. San Francisco County

Canva

46 / 50

#5. San Francisco County

- Index: 0.655
- Total population: 874,961
- White: 46.4% (406,056)
- Black or African American: 5.2% (45,556)
- American Indian and Alaska Native: 0.4% (3,223)
- Asian: 34.4% (301,018)
- Native Hawaiian and other Pacific Islander: 0.4% (3,188)
- 2 or more races: 5.6% (48,713)
- Some other Race: 7.7% (67,207)
#4. Santa Clara County

Uladzik Kryhin // Shutterstock

47 / 50

#4. Santa Clara County

- Index: 0.655
- Total population: 1.9 million
- White: 44.5% (857,092)
- Black or African American: 2.5% (47,992)
- American Indian and Alaska Native: 0.5% (9,697)
- Asian: 36.5% (702,881)
- Native Hawaiian and other Pacific Islander: 0.4% (7,271)
- 2 or more races: 5.2% (100,143)
- Some other Race: 10.5% (202,394)
#3. Los Angeles County

BDS2006 // Wikimedia

48 / 50

#3. Los Angeles County

- Index: 0.664
- Total population: 10.1 million
- White: 51.3% (5,168,443)
- Black or African American: 8.1% (820,478)
- American Indian and Alaska Native: 0.7% (73,393)
- Asian: 14.6% (1,473,221)
- Native Hawaiian and other Pacific Islander: 0.3% (27,720)
- 2 or more races: 4.0% (402,767)
- Some other Race: 21.0% (2,115,548)
#2. Solano County

Canva

49 / 50

#2. Solano County

- Index: 0.666
- Total population: 441,829
- White: 52.6% (232,437)
- Black or African American: 13.9% (61,526)
- American Indian and Alaska Native: 0.5% (2,215)
- Asian: 15.4% (68,200)
- Native Hawaiian and other Pacific Islander: 0.9% (4,101)
- 2 or more races: 7.5% (33,004)
- Some other Race: 9.1% (40,346)
#1. Alameda County

Jennifer Williams // Wikimedia Commons

50 / 50

#1. Alameda County

- Index: 0.718
- Total population: 1.7 million
- White: 40.5% (670,364)
- Black or African American: 10.6% (175,751)
- American Indian and Alaska Native: 0.7% (11,120)
- Asian: 30.1% (499,382)
- Native Hawaiian and other Pacific Islander: 0.8% (13,900)
- 2 or more races: 6.5% (106,993)
- Some other Race: 10.8% (179,244)

You may also like: More electric vehicles means less gas tax revenue: How this impacts California's budget