Business people walking to work in the morning in a city area.
Stacker Connect

Cities and states with the biggest female wage gap

Written by:
February 25, 2025
Gorodenkoff // Shutterstock

This story was produced by TruckInfo.net and reviewed and distributed by Stacker.

Cities and states with the biggest female wage gap

March is Women's History Month. To honor the occasion, researchers at TruckInfo.net decided to analyze the impact women have had on the labor force, how they are represented across various occupations, the wage gap, and how it's changed over time.

Using data from the Census Bureau and the Department of Labor, they found the following trends.

Graph showing labor force composition since 1948.
1 / 9
TruckInfo.net

1. The Labor Force Continues to Become More Female

In 1948, women only accounted for 28% of the labor force. While female representation rapidly increased until the early 90s, growth has slowed considerably—from 45% in 1990 to just under 47% in 2023.‍

Table showing female-dominated occupations and their wage data.
2 / 9
TruckInfo.net

2. While Women Make Up Just Under Half of the Labor Force, Many Occupations Are Highly Segregated

Women have entered the workforce in mass—dominating certain occupations though avoiding others. While women make up more than 97% of preschool and kindergarten teachers, they only represent 2.2% of automotive technicians and mechanics.

Regardless of the cause, women who work full-time make $0.81 for every $1 men who work full-time make. Interestingly, occupations that skew heavily male actually pay women better than occupations that skew heavily female (though the wage gap still persists).

Table showing male-dominated occupations and their wage data.
3 / 9
TruckInfo.net

3. The Wage Gap Exists Across the Country—But Not in Every Occupation

Although the wage gap has become politically charged, there's no denying it exists. Some female academics have pointed out that since most wage gap analyses don't account for things like seniority or hours worked, it doesn't mean there is significant gender discrimination. Still, others counter that those factors are examples of differential treatment or societal expectations.

Table showing female pay in female-dominated occupations.
4 / 9
TruckInfo.net

Female Pay in Female-Dominated Occupations

Female executive assistants make $1.03 for every dollar a male assistant makes.

Table showing female pay in male-dominated occupations.
5 / 9
TruckInfo.net

Female Pay in Male-Dominated Occupations

While females in occupations that skew heavily male still have a wage gap, some professions, such as construction, have a smaller wage gap than the national average.

Map showing wage gap by state.
6 / 9
TruckInfo.net

Wage Gap by State

At the state level, Vermont has the smallest wage gap, while Utah has the largest.

Table showing list of large cities with the largest wage gap.
7 / 9
TruckInfo.net

Large Cities With the Largest Wage Gap

Among large cities, defined as those with populations greater than 350k, El Paso TX has the largest wage gap with female workers only earning 70 cents for every dollar men earn.

Table showing list of large cities with the smallest wage gap.
8 / 9
TruckInfo.net

Large Cities With the Smallest Wage Gap

Among cities with populations under 150k, Columbus, Ohio has the smallest wage gap – with female workers earning 93 cents for every dollar men earn.

Map showing female wage growth premium ratio since 2010.
9 / 9
TruckInfo.net

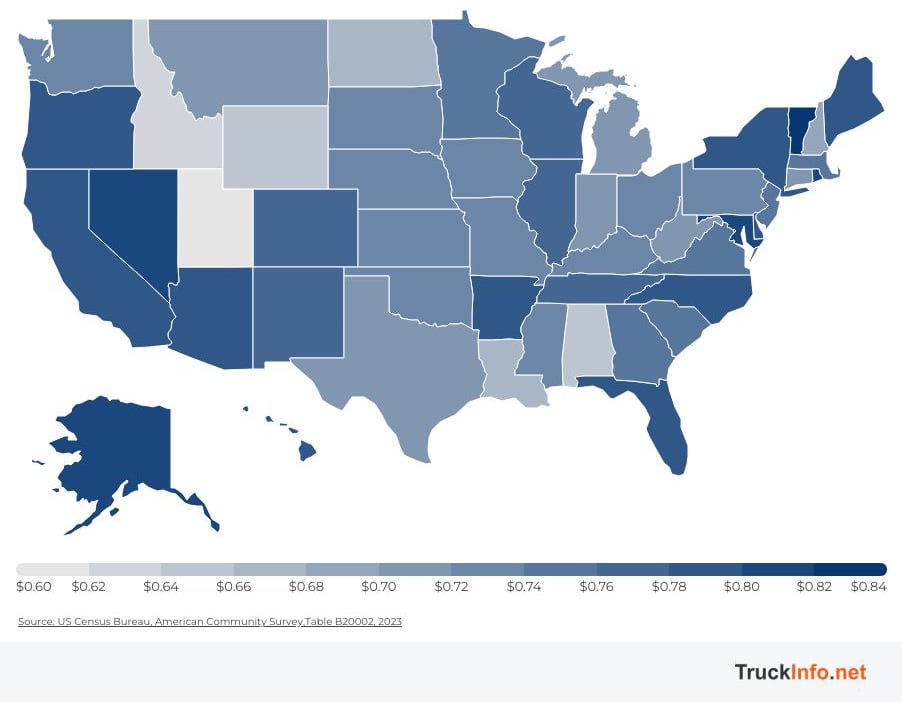
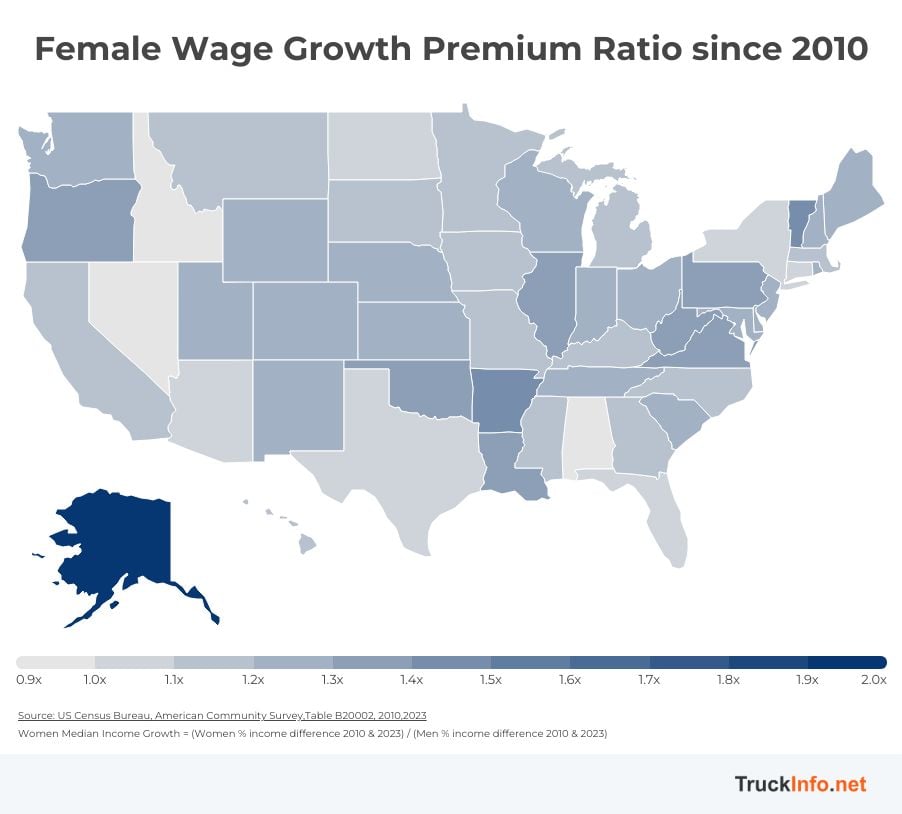
4. While the Wage Gap Persists, Female Wages Have Grown Faster Than Men's Wages Since 2010

In Vermont, female wages have grown 136% faster than male wages since 2010. While an outlier, the majority of states have seen female wages grow 120%+ faster than male wages over the same period.

Methodology and Data Sources

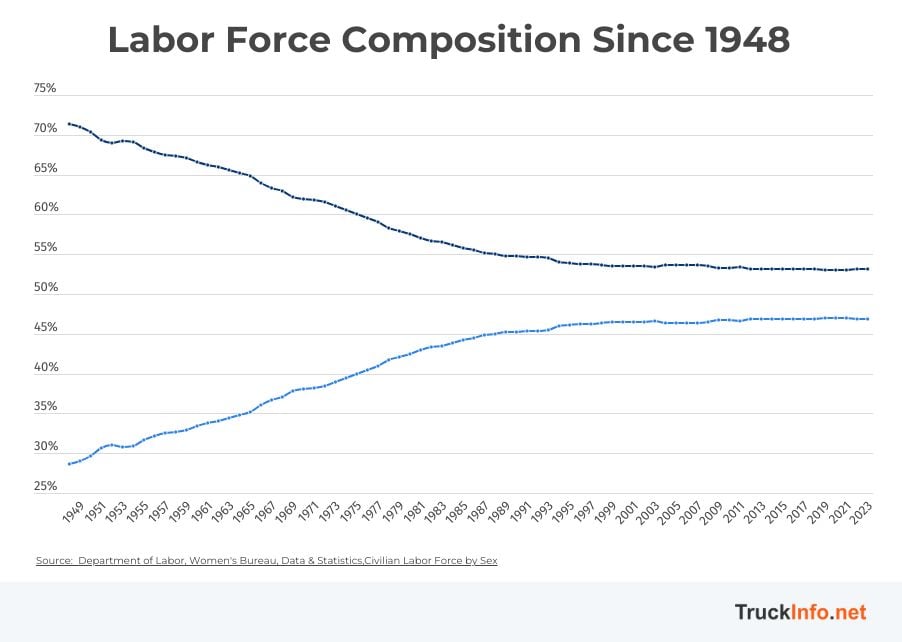
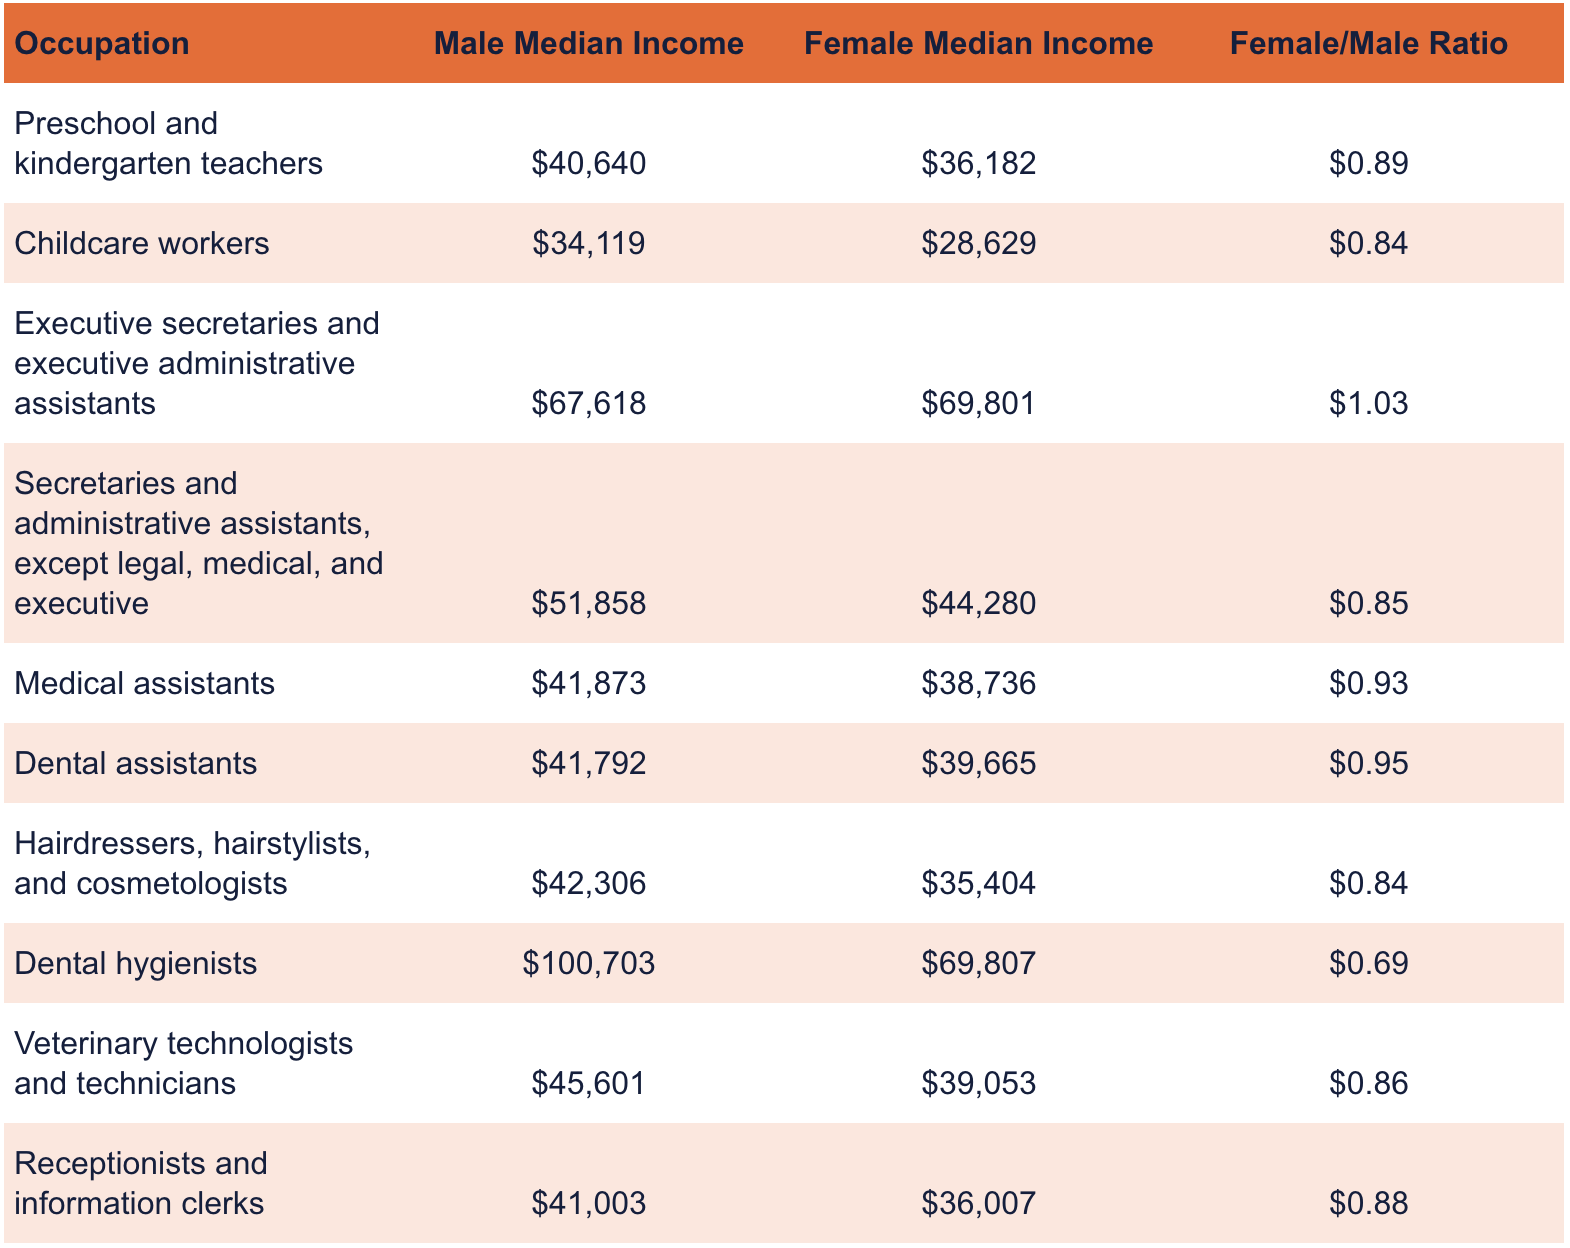
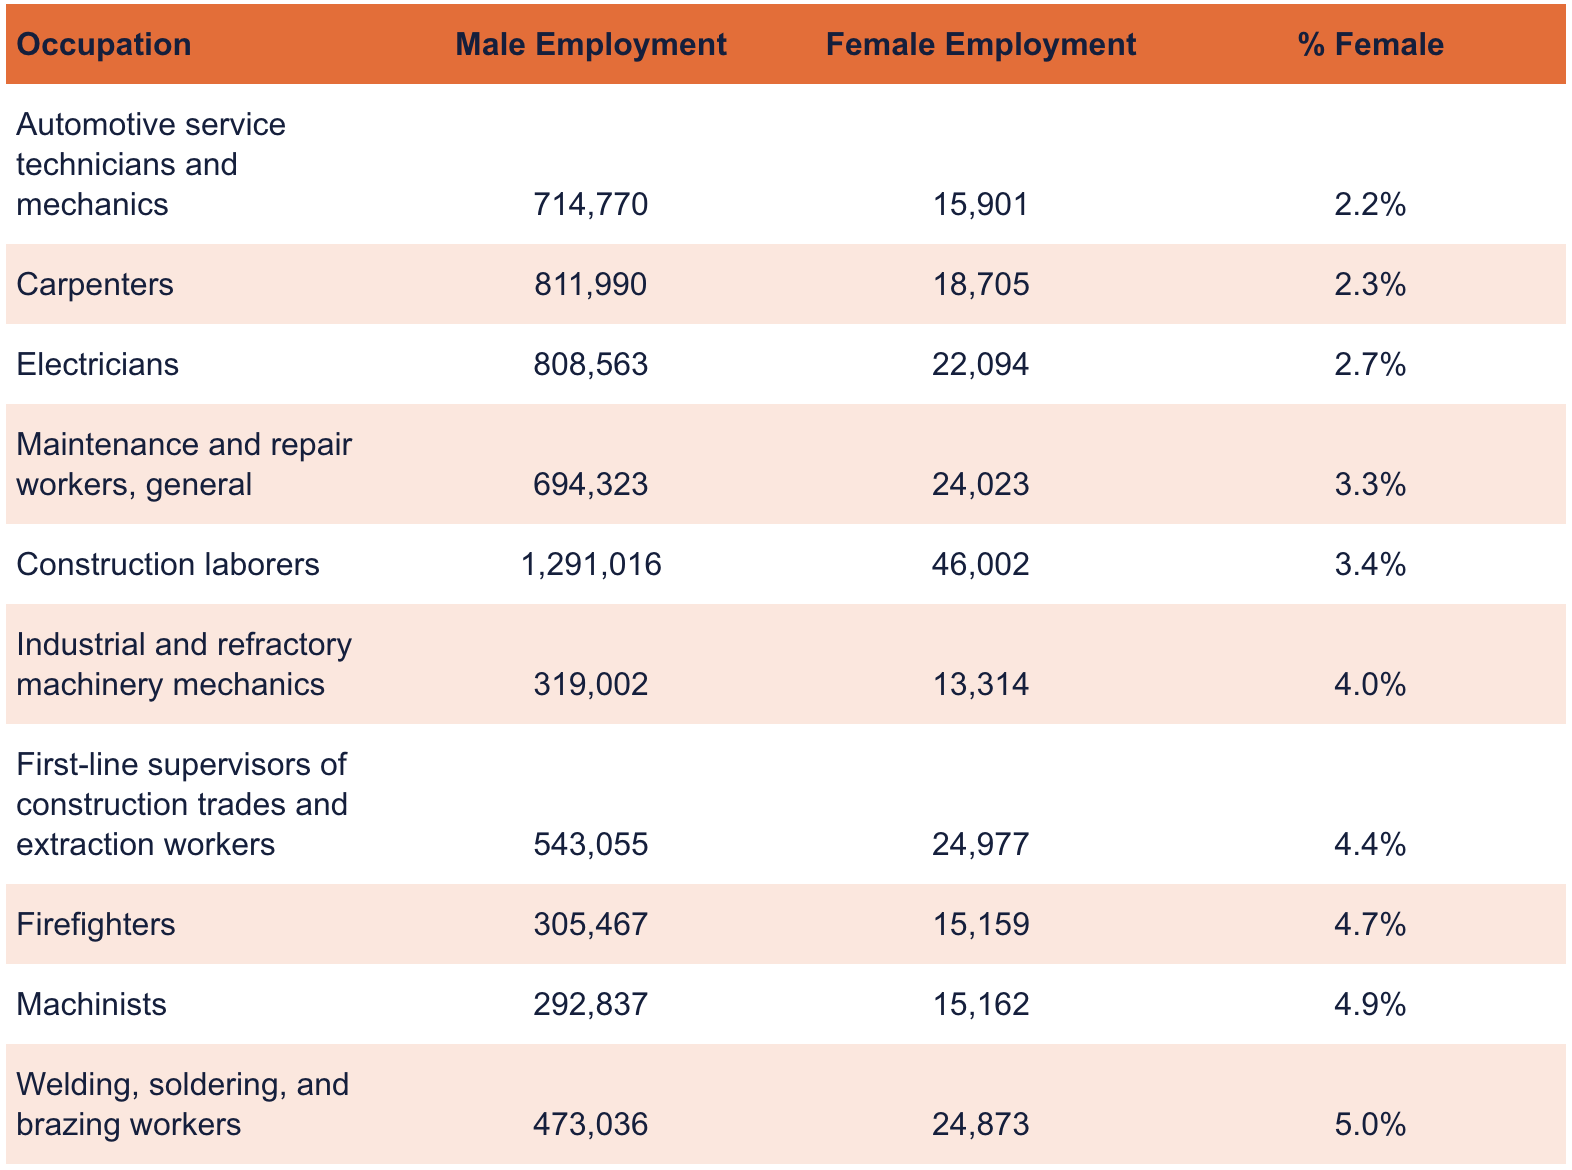
Income and employment data was sourced from the Census Bureau. The top and bottom 10 lists for female occupations filtered out occupations with fewer than 10,000 individuals for males and females. Data on the labor force composition over time was sourced from the Department of Labor.

Large cities were defined as cities with a population over 350,000; mid-size cities as populations from 150,000-349,999; and small cities as populations under 150,000.

Trending Now