Which states have the most (and best-paid) federal employees?
This story was produced by SmartAsset and reviewed and distributed by Stacker.
Which states have the most (and best-paid) federal employees?
As of September 2024, over 1.8 million people were employed by the federal government of the United States. However, the federal government is far from limited just to Washington D.C. Federal workers are dispersed throughout the nation, albeit unevenly. In turn, large layoffs—whether voluntary or involuntary—may have different consequences for different communities. States with higher rates of federal government job cuts may experience more upcoming volatility in the job and housing markets, with similar impacts depending on the income levels associated with such jobs.
With this in mind, SmartAsset evaluated the latest federal government employment data, from September 2024, to determine which states are most dependent on federal government employment, as well as the median income levels of federal employees in each state.
Key Findings
- Maryland has the most federal workers per capita—and the highest paid. As of September 2024, there were 144,497 federal employees in Maryland, or 0.023 workers per state resident. The median salary for these workers is $137,624, more than any other state.
- Federal workers have particularly high pay in this state. After Maryland, the highest paid federal workers reside in New Jersey, where the median salary for these workers is $119,187. Virginia is a close third with the median federal government employee earning $117,962.
- Over 150,000 California residents work for the federal government. The Golden State has the most federal employees of any state at 150,679, or 0.0038 federal jobs per capita (39th nationwide). The median salary of these employees came in at $103,255.
- Federal workers make less than a median household salary in this state. Ranking fifth overall for federal workers per capita at 0.012, federal employees in Wyoming have the lowest pay at a median $75,956 salary. This is lower than the latest U.S. Census Bureau estimates for median household income, which was at $80,610 as of 2023.
- Connecticut has the fewest federal workers. With just 7,304 federal workers, Connecticut has the lowest rate of federal job dependence at 0.002 jobs per capita. These employees earn a median of $104,510 annually.
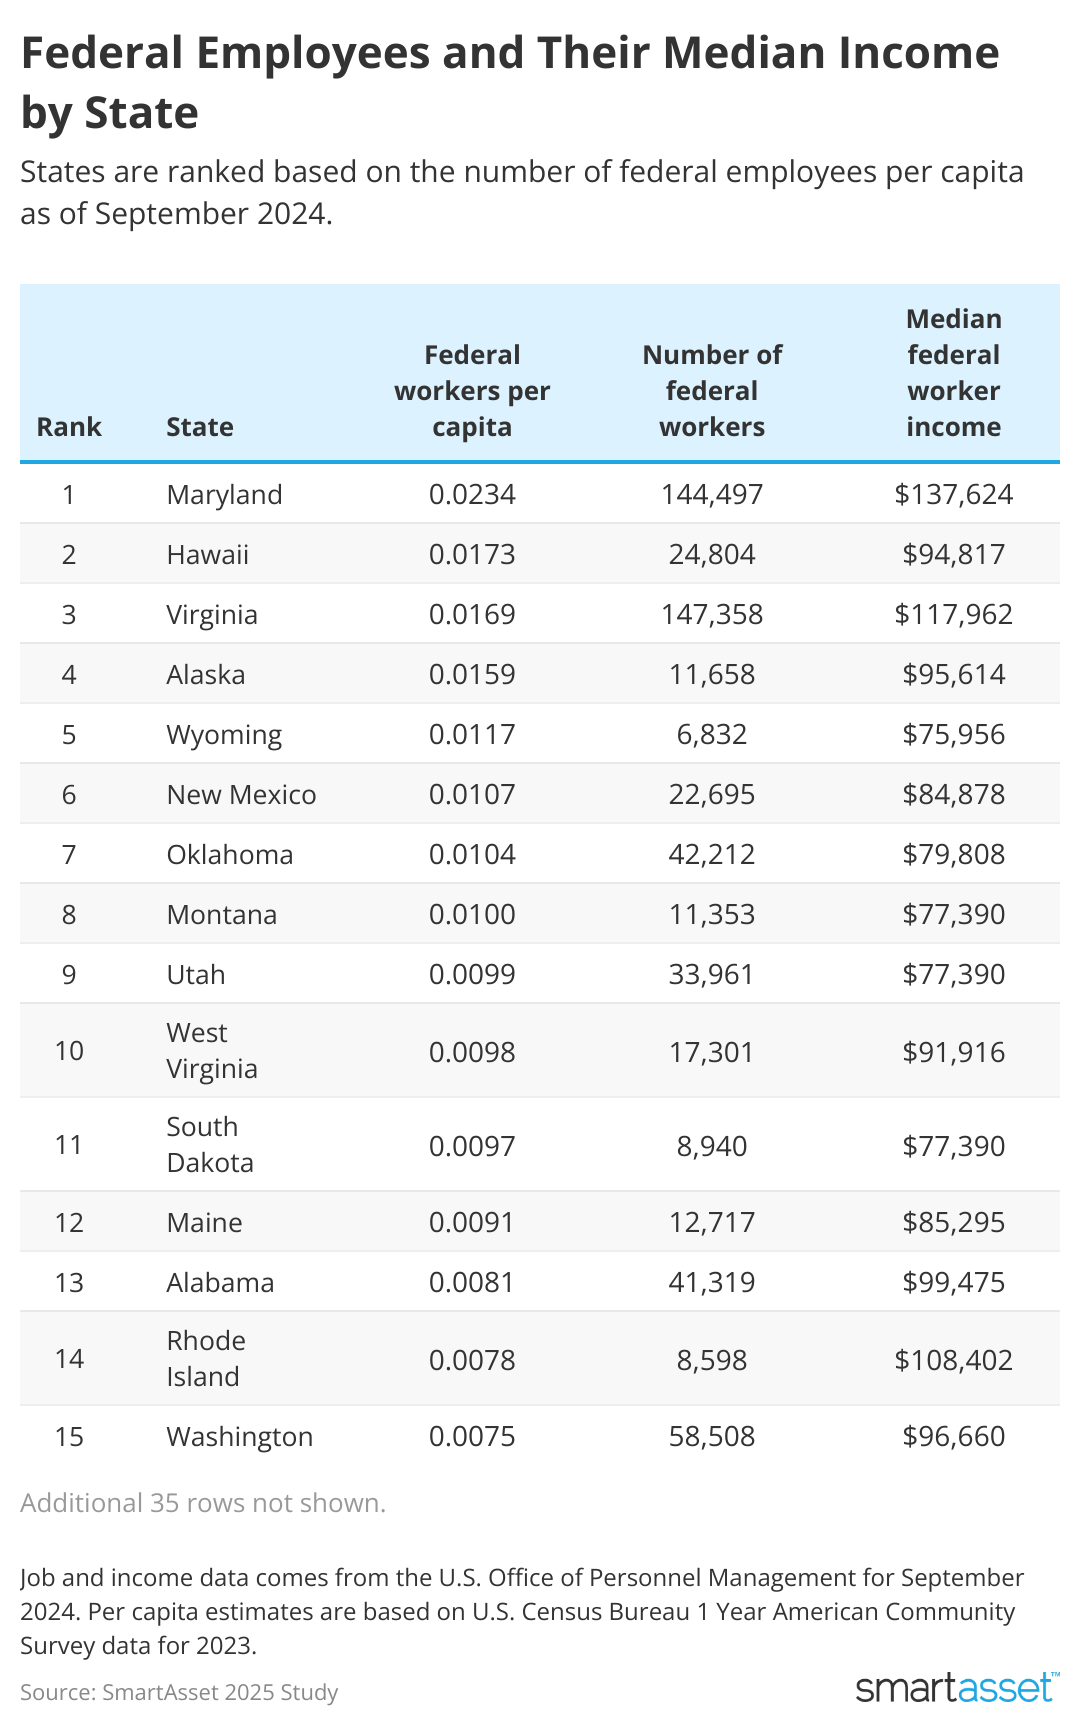
Top 10 States With the Most Federal Workers
States are ranked by the number of federal workers per capita.
- Maryland
- Federal workers per capita: 0.0234
- Number of federal workers: 144,497
- Median federal worker income: $137,624
- Minimum federal worker income: $19,993
- Maximum federal worker income: $519,246
- State population: 6,180,253
- Hawaii
- Federal workers per capita: 0.0173
- Number of federal workers: 24,804
- Median federal worker income: $94,817
- Minimum federal worker income: $26,087
- Maximum federal worker income: $404,727
- State population: 1,435,138
- Virginia
- Federal workers per capita: 0.0169
- Number of federal workers: 147,358
- Median federal worker income: $117,962
- Minimum federal worker income: $16,074
- Maximum federal worker income: $438,999
- State population: 8,715,698
- Alaska
- Federal workers per capita: 0.0159
- Number of federal workers: 11,658
- Median federal worker income: $95,614
- Minimum federal worker income: $31,200
- Maximum federal worker income: $411,367
- State population: 733,406
- Wyoming
- Federal workers per capita: 0.0117
- Number of federal workers: 6,832
- Median federal worker income: $75,956
- Minimum federal worker income: $20,765
- Maximum federal worker income: $375,433
- State population: 584,057
- New Mexico
- Federal workers per capita: 0.0107
- Number of federal workers: 22,695
- Median federal worker income: $84,878
- Minimum federal worker income: $24,814
- Maximum federal worker income: $424,305
- State population: 2,114,371
- Oklahoma
- Federal workers per capita: 0.0104
- Number of federal workers: 42,212
- Median federal worker income: $79,808
- Minimum federal worker income: $27,485
- Maximum federal worker income: $428,557
- State population: 4,053,824
- Montana
- Federal workers per capita: 0.0100
- Number of federal workers: 11,353
- Median federal worker income: $77,390
- Minimum federal worker income: $31,200
- Maximum federal worker income: $417,156
- State population: 1,132,812
- Utah
- Federal workers per capita: 0.0099
- Number of federal workers: 33,961
- Median federal worker income: $77,390
- Minimum federal worker income: $25,684
- Maximum federal worker income: $423,603
- State population: 3,417,734
- West Virginia
- Federal workers per capita: 0.0098
- Number of federal workers: 17,301
- Median federal worker income: $91,916
- Minimum federal worker income: $30,115
- Maximum federal worker income: $421,679
- State population: 1,770,071
Top 10 States Where Federal Workers Earn the Most
States are ranked based on the median earnings of federal employees.
- Maryland
- Median federal worker income: $137,624
- Federal workers per capita: 0.02338
- Number of federal workers: 144,497
- Minimum federal worker income: $19,993
- Maximum federal worker income: $519,246
- State population: 6,180,253
- New Jersey
- Median federal worker income: $119,187
- Federal workers per capita: 0.00244
- Number of federal workers: 22,684
- Minimum federal worker income: $26,087
- Maximum federal worker income: $413,695
- State population: 9,290,841
- Virginia
- Median federal worker income: $117,962
- Federal workers per capita: 0.01691
- Number of federal workers: 147,358
- Minimum federal worker income: $16,074
- Maximum federal worker income: $438,999
- State population: 8,715,698
- Rhode Island
- Median federal worker income: $108,402
- Federal workers per capita: 0.00785
- Number of federal workers: 8,598
- Minimum federal worker income: $26,087
- Maximum federal worker income: $421,227
- State population: 1,095,962
- Massachusetts
- Median federal worker income: $107,691
- Federal workers per capita: 0.00367
- Number of federal workers: 25,698
- Minimum federal worker income: $16,074
- Maximum federal worker income: $436,373
- State population: 7,001,399
- Colorado
- Median federal worker income: $105,985
- Federal workers per capita: 0.00700
- Number of federal workers: 41,167
- Minimum federal worker income: $31,200
- Maximum federal worker income: $419,330
- State population: 5,877,610
- New Hampshire
- Median federal worker income: $104,788
- Federal workers per capita: 0.00371
- Number of federal workers: 5,208
- Minimum federal worker income: $31,200
- Maximum federal worker income: $422,091
- State population: 1,402,054
- Connecticut
- Median federal worker income: $104,510
- Federal workers per capita: 0.00202
- Number of federal workers: 7,304
- Minimum federal worker income: $31,200
- Maximum federal worker income: $432,551
- State population: 3,617,176
- California
- Median federal worker income: $103,255
- Federal workers per capita: 0.00387
- Number of federal workers: 150,679
- Minimum federal worker income: $16,074
- Maximum federal worker income: $446,849
- State population: 38,965,193
- Ohio
- Median federal worker income: $99,862
- Federal workers per capita: 0.00476
- Number of federal workers: 56,068
- Minimum federal worker income: $25,204
- Maximum federal worker income: $428,999
- State population: 11,785,935
Data and Methodology
Data for federal employment comes from the U.S. Office of Personnel Management as of September 2024. Per capita estimates for this SmartAsset study are based on the latest U.S. Census Bureau population estimates from the 1-Year American Community Survey for 2023.


