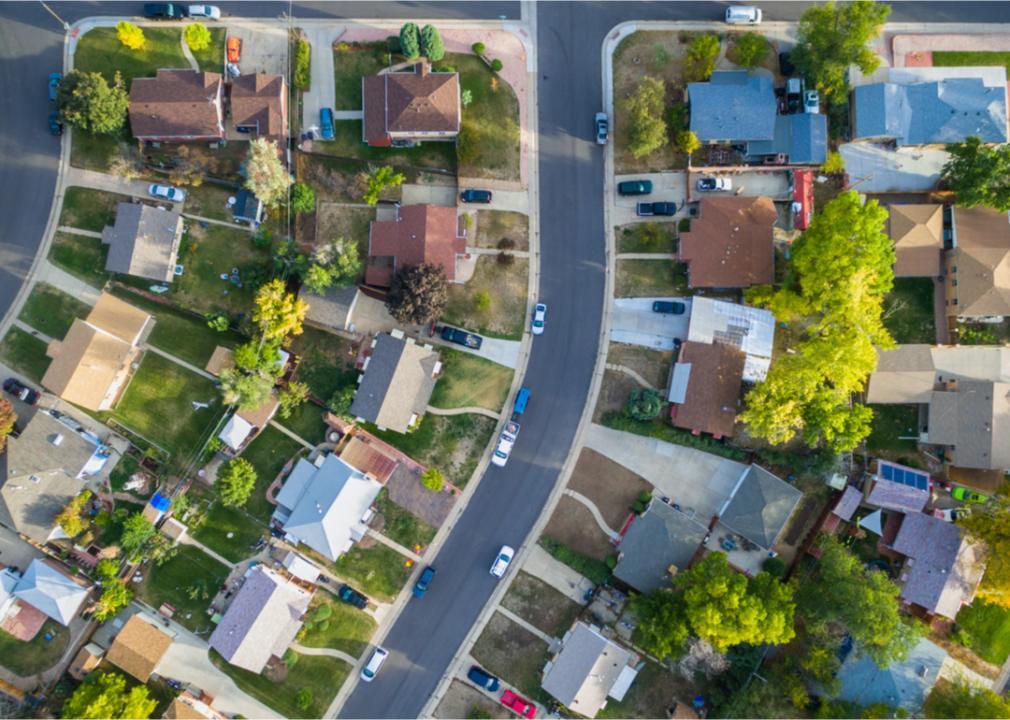
Counties in Colorado where people spend most of their paycheck on housing
Counties in Colorado where people spend most of their paycheck on housing
It's no secret that many Americans are forgoing homeownership in favor of renting. In 2020, renters in the U.S. occupied 43 million housing units.
The Stacker team looked at data from a United States Census survey that revealed an estimated 43,378,800 renter-occupied homes in the United States as of 2017, which makes up 36.1% of all households in the country. In 2019, renting was more affordable than buying a median-priced home in 59% of the counties; in 2021, the opposite was true: Owning was more affordable than renting in 63% of U.S. counties.
Stacker compiled a list of counties in Colorado where people spend the highest percent of income on rent using data from the U.S. Census Bureau. Of course, saving money by owning a home is unattainable for many Americans who don't have savings that could cover a down payment, those who are denied a mortgage, or both. Keep reading to see where in your home state most of people's take-home pay goes to their monthly rent.
You may also like: Most popular boy names in the 70s in Colorado
#50. Yuma County
- Median percent of income spent on housing: 17.0%
--- Percent of households spending <20% of income on housing: 51.7%
--- Percent of households spending >30% of income on housing: 21.3%
- Total occupied households: 4,028
- Median household income: $52,022
- Median monthly housing cost: $736
#49. Kiowa County
- Median percent of income spent on housing: 17.0%
--- Percent of households spending <20% of income on housing: 53.4%
--- Percent of households spending >30% of income on housing: 22.6%
- Total occupied households: 638
- Median household income: $41,731
- Median monthly housing cost: $592
#48. Costilla County
- Median percent of income spent on housing: 17.3%
--- Percent of households spending <20% of income on housing: 48.2%
--- Percent of households spending >30% of income on housing: 25.3%
- Total occupied households: 1,746
- Median household income: $30,965
- Median monthly housing cost: $447
#47. Moffat County
- Median percent of income spent on housing: 17.4%
--- Percent of households spending <20% of income on housing: 49.8%
--- Percent of households spending >30% of income on housing: 29.1%
- Total occupied households: 5,366
- Median household income: $57,229
- Median monthly housing cost: $828
#46. Logan County
- Median percent of income spent on housing: 17.5%
--- Percent of households spending <20% of income on housing: 50.9%
--- Percent of households spending >30% of income on housing: 27.6%
- Total occupied households: 8,393
- Median household income: $53,318
- Median monthly housing cost: $776
You may also like: Most popular girl names in the 70s in Colorado
#45. Huerfano County
- Median percent of income spent on housing: 17.7%
--- Percent of households spending <20% of income on housing: 47.3%
--- Percent of households spending >30% of income on housing: 28.0%
- Total occupied households: 3,225
- Median household income: $38,137
- Median monthly housing cost: $561
#44. Clear Creek County
- Median percent of income spent on housing: 18.4%
--- Percent of households spending <20% of income on housing: 50.1%
--- Percent of households spending >30% of income on housing: 29.0%
- Total occupied households: 4,395
- Median household income: $67,060
- Median monthly housing cost: $1,031
#43. Grand County
- Median percent of income spent on housing: 18.7%
--- Percent of households spending <20% of income on housing: 46.8%
--- Percent of households spending >30% of income on housing: 29.5%
- Total occupied households: 5,884
- Median household income: $71,198
- Median monthly housing cost: $1,110
#42. Montezuma County
- Median percent of income spent on housing: 19.0%
--- Percent of households spending <20% of income on housing: 50.0%
--- Percent of households spending >30% of income on housing: 24.5%
- Total occupied households: 10,655
- Median household income: $49,470
- Median monthly housing cost: $783
#41. Crowley County
- Median percent of income spent on housing: 19.2%
--- Percent of households spending <20% of income on housing: 49.9%
--- Percent of households spending >30% of income on housing: 23.9%
- Total occupied households: 1,301
- Median household income: $42,135
- Median monthly housing cost: $675
You may also like: Highest-rated Class of 2021 football recruits from Colorado
#40. Ouray County
- Median percent of income spent on housing: 19.4%
--- Percent of households spending <20% of income on housing: 49.6%
--- Percent of households spending >30% of income on housing: 34.0%
- Total occupied households: 2,163
- Median household income: $66,417
- Median monthly housing cost: $1,076
#39. Morgan County
- Median percent of income spent on housing: 19.4%
--- Percent of households spending <20% of income on housing: 45.4%
--- Percent of households spending >30% of income on housing: 29.8%
- Total occupied households: 10,928
- Median household income: $53,682
- Median monthly housing cost: $870
#38. Chaffee County
- Median percent of income spent on housing: 19.5%
--- Percent of households spending <20% of income on housing: 47.9%
--- Percent of households spending >30% of income on housing: 30.9%
- Total occupied households: 8,231
- Median household income: $55,771
- Median monthly housing cost: $906
#37. Douglas County
- Median percent of income spent on housing: 19.6%
--- Percent of households spending <20% of income on housing: 50.0%
--- Percent of households spending >30% of income on housing: 24.3%
- Total occupied households: 120,709
- Median household income: $119,730
- Median monthly housing cost: $1,957
#36. Otero County
- Median percent of income spent on housing: 19.6%
--- Percent of households spending <20% of income on housing: 46.1%
--- Percent of households spending >30% of income on housing: 28.3%
- Total occupied households: 7,722
- Median household income: $38,169
- Median monthly housing cost: $625
You may also like: Biggest sources of immigrants to Colorado
#35. Montrose County
- Median percent of income spent on housing: 19.8%
--- Percent of households spending <20% of income on housing: 47.5%
--- Percent of households spending >30% of income on housing: 28.8%
- Total occupied households: 17,140
- Median household income: $50,489
- Median monthly housing cost: $834
#34. Rio Grande County
- Median percent of income spent on housing: 19.8%
--- Percent of households spending <20% of income on housing: 52.1%
--- Percent of households spending >30% of income on housing: 26.5%
- Total occupied households: 4,823
- Median household income: $39,123
- Median monthly housing cost: $647
#33. Saguache County
- Median percent of income spent on housing: 20.0%
--- Percent of households spending <20% of income on housing: 49.2%
--- Percent of households spending >30% of income on housing: 30.7%
- Total occupied households: 2,860
- Median household income: $38,571
- Median monthly housing cost: $644
#32. Garfield County
- Median percent of income spent on housing: 20.1%
--- Percent of households spending <20% of income on housing: 45.8%
--- Percent of households spending >30% of income on housing: 29.3%
- Total occupied households: 21,498
- Median household income: $75,937
- Median monthly housing cost: $1,271
#31. Prowers County
- Median percent of income spent on housing: 20.1%
--- Percent of households spending <20% of income on housing: 49.3%
--- Percent of households spending >30% of income on housing: 27.8%
- Total occupied households: 4,888
- Median household income: $41,929
- Median monthly housing cost: $703
You may also like: States sending the most people to Colorado
#30. Fremont County
- Median percent of income spent on housing: 20.2%
--- Percent of households spending <20% of income on housing: 49.1%
--- Percent of households spending >30% of income on housing: 26.6%
- Total occupied households: 17,136
- Median household income: $49,409
- Median monthly housing cost: $831
#29. Gilpin County
- Median percent of income spent on housing: 20.5%
--- Percent of households spending <20% of income on housing: 48.9%
--- Percent of households spending >30% of income on housing: 30.5%
- Total occupied households: 2,802
- Median household income: $76,429
- Median monthly housing cost: $1,305
#28. Las Animas County
- Median percent of income spent on housing: 20.6%
--- Percent of households spending <20% of income on housing: 44.5%
--- Percent of households spending >30% of income on housing: 32.4%
- Total occupied households: 6,670
- Median household income: $41,817
- Median monthly housing cost: $719
#27. Delta County
- Median percent of income spent on housing: 20.7%
--- Percent of households spending <20% of income on housing: 45.7%
--- Percent of households spending >30% of income on housing: 30.5%
- Total occupied households: 11,883
- Median household income: $45,269
- Median monthly housing cost: $781
#26. Broomfield County
- Median percent of income spent on housing: 20.7%
--- Percent of households spending <20% of income on housing: 47.9%
--- Percent of households spending >30% of income on housing: 27.1%
- Total occupied households: 27,470
- Median household income: $96,416
- Median monthly housing cost: $1,666
You may also like: Best places to retire in Colorado
#25. Park County
- Median percent of income spent on housing: 20.9%
--- Percent of households spending <20% of income on housing: 50.0%
--- Percent of households spending >30% of income on housing: 28.0%
- Total occupied households: 6,931
- Median household income: $73,622
- Median monthly housing cost: $1,281
#24. Weld County
- Median percent of income spent on housing: 20.9%
--- Percent of households spending <20% of income on housing: 44.8%
--- Percent of households spending >30% of income on housing: 28.7%
- Total occupied households: 104,671
- Median household income: $74,150
- Median monthly housing cost: $1,292
#23. San Juan County
- Median percent of income spent on housing: 20.9%
--- Percent of households spending <20% of income on housing: 48.8%
--- Percent of households spending >30% of income on housing: 25.6%
- Total occupied households: 289
- Median household income: $54,625
- Median monthly housing cost: $952
#22. La Plata County
- Median percent of income spent on housing: 21.0%
--- Percent of households spending <20% of income on housing: 46.3%
--- Percent of households spending >30% of income on housing: 30.9%
- Total occupied households: 21,794
- Median household income: $68,685
- Median monthly housing cost: $1,203
#21. Routt County
- Median percent of income spent on housing: 21.2%
--- Percent of households spending <20% of income on housing: 45.1%
--- Percent of households spending >30% of income on housing: 30.3%
- Total occupied households: 9,603
- Median household income: $77,443
- Median monthly housing cost: $1,371
You may also like: Highest-rated things to do in Colorado, according to Tripadvisor
#20. Jefferson County
- Median percent of income spent on housing: 21.3%
--- Percent of households spending <20% of income on housing: 46.2%
--- Percent of households spending >30% of income on housing: 29.0%
- Total occupied households: 232,284
- Median household income: $82,986
- Median monthly housing cost: $1,474
#19. Teller County
- Median percent of income spent on housing: 21.5%
--- Percent of households spending <20% of income on housing: 47.3%
--- Percent of households spending >30% of income on housing: 29.0%
- Total occupied households: 10,248
- Median household income: $66,592
- Median monthly housing cost: $1,192
#18. Mesa County
- Median percent of income spent on housing: 21.6%
--- Percent of households spending <20% of income on housing: 45.3%
--- Percent of households spending >30% of income on housing: 31.2%
- Total occupied households: 61,742
- Median household income: $55,379
- Median monthly housing cost: $996
#17. Pitkin County
- Median percent of income spent on housing: 21.9%
--- Percent of households spending <20% of income on housing: 40.1%
--- Percent of households spending >30% of income on housing: 35.3%
- Total occupied households: 7,467
- Median household income: $78,935
- Median monthly housing cost: $1,438
#16. Archuleta County
- Median percent of income spent on housing: 21.9%
--- Percent of households spending <20% of income on housing: 45.2%
--- Percent of households spending >30% of income on housing: 32.5%
- Total occupied households: 5,858
- Median household income: $52,221
- Median monthly housing cost: $954
You may also like: Most popular girl names in the 80s in Colorado
#15. Elbert County
- Median percent of income spent on housing: 22.0%
--- Percent of households spending <20% of income on housing: 46.8%
--- Percent of households spending >30% of income on housing: 27.7%
- Total occupied households: 9,280
- Median household income: $99,199
- Median monthly housing cost: $1,821
#14. Gunnison County
- Median percent of income spent on housing: 22.1%
--- Percent of households spending <20% of income on housing: 46.3%
--- Percent of households spending >30% of income on housing: 30.9%
- Total occupied households: 6,616
- Median household income: $56,577
- Median monthly housing cost: $1,044
#13. Summit County
- Median percent of income spent on housing: 22.2%
--- Percent of households spending <20% of income on housing: 39.6%
--- Percent of households spending >30% of income on housing: 33.7%
- Total occupied households: 10,641
- Median household income: $79,277
- Median monthly housing cost: $1,468
#12. El Paso County
- Median percent of income spent on housing: 22.2%
--- Percent of households spending <20% of income on housing: 42.7%
--- Percent of households spending >30% of income on housing: 32.5%
- Total occupied households: 257,507
- Median household income: $68,779
- Median monthly housing cost: $1,275
#11. Boulder County
- Median percent of income spent on housing: 22.4%
--- Percent of households spending <20% of income on housing: 43.3%
--- Percent of households spending >30% of income on housing: 33.9%
- Total occupied households: 127,415
- Median household income: $83,019
- Median monthly housing cost: $1,552
You may also like: Recipes from Colorado
#10. Pueblo County
- Median percent of income spent on housing: 22.5%
--- Percent of households spending <20% of income on housing: 43.0%
--- Percent of households spending >30% of income on housing: 33.1%
- Total occupied households: 64,314
- Median household income: $46,783
- Median monthly housing cost: $876
#9. Larimer County
- Median percent of income spent on housing: 22.5%
--- Percent of households spending <20% of income on housing: 43.4%
--- Percent of households spending >30% of income on housing: 32.4%
- Total occupied households: 137,021
- Median household income: $71,881
- Median monthly housing cost: $1,347
#8. Arapahoe County
- Median percent of income spent on housing: 22.7%
--- Percent of households spending <20% of income on housing: 41.7%
--- Percent of households spending >30% of income on housing: 33.1%
- Total occupied households: 240,304
- Median household income: $77,469
- Median monthly housing cost: $1,465
#7. San Miguel County
- Median percent of income spent on housing: 23.2%
--- Percent of households spending <20% of income on housing: 40.3%
--- Percent of households spending >30% of income on housing: 37.2%
- Total occupied households: 3,552
- Median household income: $67,038
- Median monthly housing cost: $1,294
#6. Alamosa County
- Median percent of income spent on housing: 23.3%
--- Percent of households spending <20% of income on housing: 45.4%
--- Percent of households spending >30% of income on housing: 31.4%
- Total occupied households: 6,162
- Median household income: $37,515
- Median monthly housing cost: $728
You may also like: Fastest-growing counties in Colorado
#5. Bent County
- Median percent of income spent on housing: 23.3%
--- Percent of households spending <20% of income on housing: 46.2%
--- Percent of households spending >30% of income on housing: 31.2%
- Total occupied households: 1,767
- Median household income: $30,900
- Median monthly housing cost: $601
#4. Lake County
- Median percent of income spent on housing: 23.6%
--- Percent of households spending <20% of income on housing: 32.9%
--- Percent of households spending >30% of income on housing: 31.0%
- Total occupied households: 3,392
- Median household income: $50,565
- Median monthly housing cost: $996
#3. Adams County
- Median percent of income spent on housing: 23.8%
--- Percent of households spending <20% of income on housing: 38.8%
--- Percent of households spending >30% of income on housing: 34.8%
- Total occupied households: 166,450
- Median household income: $71,202
- Median monthly housing cost: $1,411
#2. Eagle County
- Median percent of income spent on housing: 24.0%
--- Percent of households spending <20% of income on housing: 37.1%
--- Percent of households spending >30% of income on housing: 38.6%
- Total occupied households: 18,171
- Median household income: $84,790
- Median monthly housing cost: $1,693
#1. Denver County
- Median percent of income spent on housing: 24.3%
--- Percent of households spending <20% of income on housing: 39.8%
--- Percent of households spending >30% of income on housing: 34.6%
- Total occupied households: 301,501
- Median household income: $68,592
- Median monthly housing cost: $1,387
You may also like: Highest-earning counties in Colorado