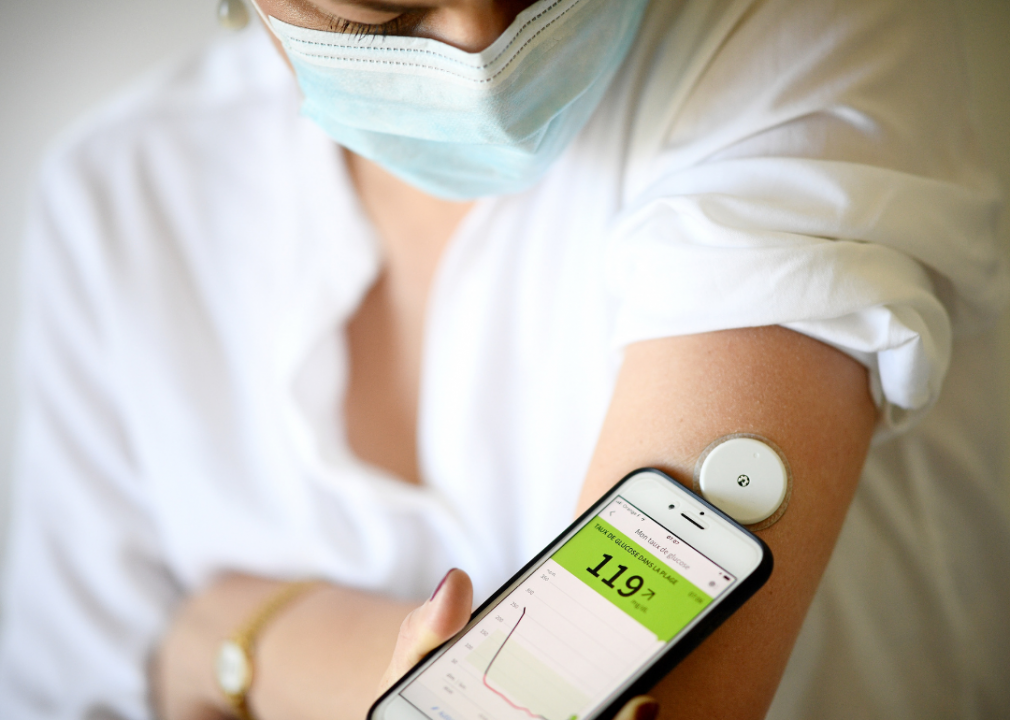
Counties with the highest diabetes rate in Colorado
Diabetes rates have been on the rise for the last two decades, and show no sign of abating. According to the Centers for Disease Control and Prevention, roughly 11.3% of the U.S. population suffers from diabetes—though many of those affected do not know they have the chronic illness.
Diabetes was the 8th leading cause of death in 2020, but the disease does not impact all Americans equally. Instead, variables like poverty level, geographic region, and race all influence diabetes rates, meaning some Americans are disproportionately impacted by the disease.
The Southeastern portion of the U.S. has a particularly high concentration of counties with elevated diabetes rates, with parts of Alabama, Mississippi, Tennessee, Pennsylvania, Texas, and nearly all of Louisiana, along with other states, facing some of the highest rates. Studies have shown that lack of access to healthy, affordable foods and health care services, exposure to environmental toxins, and other health hazards associated with poverty and systemic racism contribute to the increased likelihood of developing diabetes. These same conditions also mean that poor, non-white Americans are more likely to endure complications and have higher mortality rates from diabetes than wealthier white Americans with the disease.
The proportion of young people with diabetes is projected to increase over the next several decades, with racial, geographic, and socioeconomic disparities only growing larger if trends continue. Using 2022 County Health Rankings & Roadmaps from the University of Wisconsin Population Health Institute, Stacker identified the counties in Colorado with the highest percentage of adults with diabetes. Ties were broken by the broader Quality of Life rank provided by the analysis, which includes other poor physical and mental health indicators. The age-adjusted diabetes rate was obtained through the Behavioral Risk Factor Surveillance System.
#24. Jackson County
- Health outcomes statewide rank: #NR
--- Quality of life rank: #NR
--- Length of life rank: #NR
- Estimated county population: 1,389
#24. Kiowa County
- Health outcomes statewide rank: #NR
--- Quality of life rank: #NR
--- Length of life rank: #NR
- Estimated county population: 1,458
#23. Adams County
- Health outcomes statewide rank: #27
--- Quality of life rank: #26
--- Length of life rank: #25
- Estimated county population: 519,883
#22. Yuma County
- Health outcomes statewide rank: #22
--- Quality of life rank: #27
--- Length of life rank: #19
- Estimated county population: 10,047
#21. Huerfano County
- Health outcomes statewide rank: #44
--- Quality of life rank: #28
--- Length of life rank: #51
- Estimated county population: 6,883
#20. Lincoln County
- Health outcomes statewide rank: #24
--- Quality of life rank: #33
--- Length of life rank: #17
- Estimated county population: 5,680
#19. Logan County
- Health outcomes statewide rank: #38
--- Quality of life rank: #36
--- Length of life rank: #42
- Estimated county population: 21,974
#18. Morgan County
- Health outcomes statewide rank: #40
--- Quality of life rank: #39
--- Length of life rank: #44
- Estimated county population: 28,941
#17. Fremont County
- Health outcomes statewide rank: #42
--- Quality of life rank: #40
--- Length of life rank: #46
- Estimated county population: 47,867
#16. Moffat County
- Health outcomes statewide rank: #43
--- Quality of life rank: #42
--- Length of life rank: #45
- Estimated county population: 13,144
#15. Sedgwick County
- Health outcomes statewide rank: #37
--- Quality of life rank: #45
--- Length of life rank: #29
- Estimated county population: 2,260
#14. Baca County
- Health outcomes statewide rank: #39
--- Quality of life rank: #46
--- Length of life rank: #29
- Estimated county population: 3,555
#13. Delta County
- Health outcomes statewide rank: #48
--- Quality of life rank: #47
--- Length of life rank: #47
- Estimated county population: 31,067
#12. Lake County
- Health outcomes statewide rank: #34
--- Quality of life rank: #50
--- Length of life rank: #15
- Estimated county population: 7,987
#11. Prowers County
- Health outcomes statewide rank: #46
--- Quality of life rank: #41
--- Length of life rank: #48
- Estimated county population: 12,106
#10. Pueblo County
- Health outcomes statewide rank: #52
--- Quality of life rank: #44
--- Length of life rank: #54
- Estimated county population: 169,823
#9. Las Animas County
- Health outcomes statewide rank: #55
--- Quality of life rank: #48
--- Length of life rank: #57
- Estimated county population: 14,420
#8. Rio Grande County
- Health outcomes statewide rank: #50
--- Quality of life rank: #49
--- Length of life rank: #49
- Estimated county population: 11,296
#7. Saguache County
- Health outcomes statewide rank: #57
--- Quality of life rank: #56
--- Length of life rank: #56
- Estimated county population: 6,938
#6. Otero County
- Health outcomes statewide rank: #59
--- Quality of life rank: #52
--- Length of life rank: #59
- Estimated county population: 18,201
#5. Alamosa County
- Health outcomes statewide rank: #53
--- Quality of life rank: #55
--- Length of life rank: #52
- Estimated county population: 16,180
#4. Conejos County
- Health outcomes statewide rank: #54
--- Quality of life rank: #53
--- Length of life rank: #55
- Estimated county population: 8,143
#3. Crowley County
- Health outcomes statewide rank: #47
--- Quality of life rank: #54
--- Length of life rank: #40
- Estimated county population: 5,696
#2. Bent County
- Health outcomes statewide rank: #58
--- Quality of life rank: #58
--- Length of life rank: #58
- Estimated county population: 5,356
#1. Costilla County
- Health outcomes statewide rank: #56
--- Quality of life rank: #59
--- Length of life rank: #29
- Estimated county population: 3,921