What your streaming vs. scrolling habits reveal about your mental health
What your streaming vs. scrolling habits reveal about your mental health
We all know that spending too much time on screens is unhealthy, but do different screens have different impacts on our mental health? The answer, according to a 2025 Hers study, is yes.
In fact, one simple question, "Do you prefer streaming TV or scrolling social media?" reveals key differences in our self-perceptions, emotional stability, mental wellness, and more. So which one is better? Well, it's complicated.
When it comes to screen time, binge watching Netflix and scrolling TikTok are not apples-to-apples, so it makes sense that their impact on our mental health isn't either. Here's a look at three key differences in streamers' vs. scrollers' mental health profiles.
Scrollers Have a Higher Self-Image Overall
When it comes to how people perceive themselves, those who prefer scrolling social media to streaming TV were notably more upbeat on several criteria. They feel more attractive (63% of scrollers rate themselves as a 4 or 5 on attractiveness on a 5-point scale vs. 57% of streamers), healthy (62% vs. 57%), and sexual (54% vs. 49%). Scrollers were also more likely than streamers to agree with the statement, "I love the way I look right now" (41% vs. 37%).
However, this higher self-perception isn't necessarily translated to feeling more secure. Scrollers actually report feeling slightly more insecure than streamers (25% vs. 22%, respectively), perhaps giving a nod to the negative impacts of comparison culture.
Streamers Are More Emotionally Confident, Scrollers Are More Physically Confident
Both streamers and scrollers reported feeling equally confident, with 65% of scrollers describing themselves as such (a 4 or 5 on a 5-point scale) vs. 64% of streamers. That said, the areas where each group felt more confident differed.
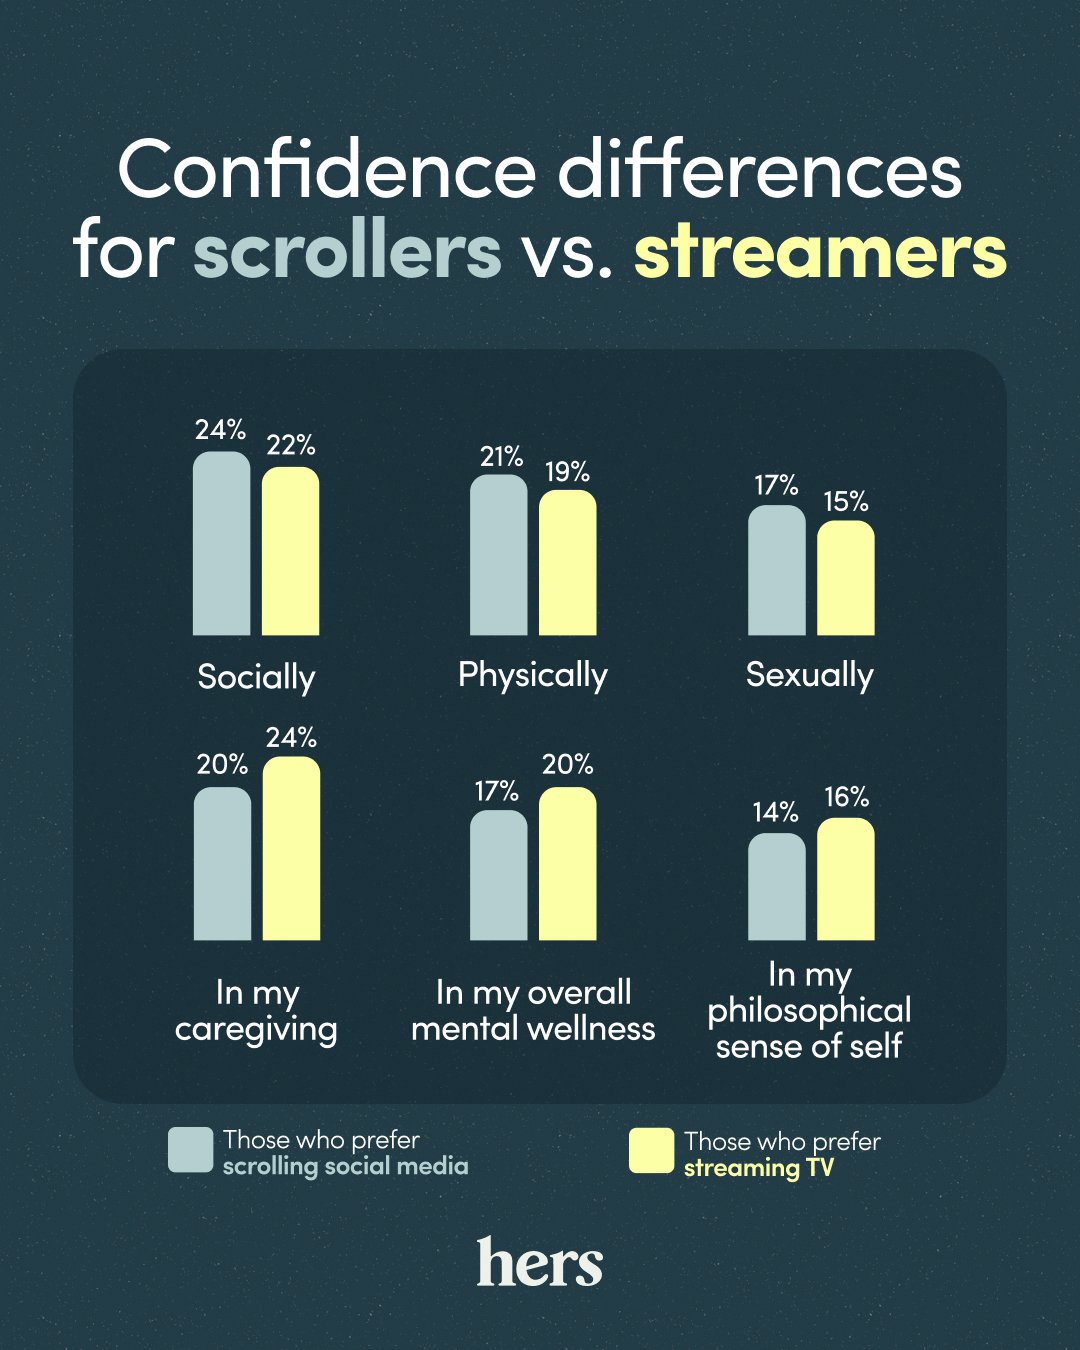
For example, scrollers have more physical confidence. They reported feeling more confident socially (24% vs. 22%), physically (21% vs. 19%), and sexually (17% vs. 15%). Streamers, on the other hand, ranked themselves as more confident in their caregiving (24% vs. 20%), overall mental wellness (20% vs. 17%), and philosophical sense of self (16% vs. 14%). They were also more likely than scrollers to name "emotionally stable" as a top personality trait (13% vs. 10.5%)
While the differences in these percentages aren't necessarily statistically significant alone, taken together they paint a picture of two different types of self-confidence—one more physical and social and the other more emotional and philosophical.
Streamers Are More Proactive About Their Mental Health
Mental health is more top-of-mind among those who prefer streaming TV vs. those who prefer scrolling social media. 25.5% of streamers say they have experienced more stress, anxiety, and burnout in the past five years vs. 21% of scrollers, and 26% of streamers say they've experienced a mental health condition in their life as compared to 23% of scrollers.
Furthermore, streamers were 50% more likely than scrollers to say "stressed" is one of their top personality traits (15% vs. 10%) and, outside of money, "my mental health" is a bigger stressor for streamers (18%) vs. scrollers (14%).
Streamers are also more likely to recognize the role their mental health has on their overall confidence: 18% say their mental health impacts their confidence (either for better or for worse) vs. 14% of people who prefer scrolling social media.
Perhaps because mental health is top-of-mind among streamers, they also report being more proactive about it. 23% say that, in the past five years, they've been more proactive about their mental health as compared to 21% of scrollers. And 14% of streamers say they're "at my full potential" with regard to their mental health vs. 12% of scrollers.
Whether you're more of a streamer or a scroller, there are things you can do to be more proactive about your own mental health, including limiting screen time to get outside, choosing streaming platforms that are better for your mental health, and only following accounts on social media that make you feel good.
Scrollers Are Younger and More Diverse
It's important to note that there are also demographic differences between scrollers and streamers that could account for some of the results in this study. Those who prefer scrolling to streaming are younger on average—36.5 years old vs. 40.7 years old—with a higher concentration of 18-24 year olds than those who prefer streaming (22% vs. 13%).
Scrollers are also more diverse, with 47% being people of color vs. 40% of streamers. And despite their age difference, scrollers reported higher household income than streamers ($94,000 annually vs. $88,500).
However, on almost every other marker, these two groups appear very similar, making their differing mental health markers arguably more psychographic than demographic.
For example, there was no significant difference in where they lived, with equal representation among both groups across the country. They were equally likely to be politically aligned with the Democratic, Republican, or Independent parties. And there were as many parents and nonparents in both groups. Scrollers skewed slightly more female than streamers (53% vs. 51%), but not significantly.
Data and Methodology
This study is based on a 7,100-person online survey, which included (1) 5,000 18-to-65-year-old respondents in the top 50 metropolitan areas (100 respondents per city); (2) 5,000 18-65-year-old respondents in each of the 50 states (100 respondents per state); and (3) a nationally representative sample of 500 18-to-65-year-old respondents to contextualize results. These three categories are not mutually exclusive; some respondents fall within more than one category. The study was fielded in January 2025.
Findings were analyzed by 190 demographic and psychographic cuts, including city, region, gender (when Hers refers to "women" and "men," we include all people who self-identify as such), age, race and ethnicity, relationship status, parenting status, sexual orientation (heterosexual, bisexual, gay, lesbian, pansexual, asexual, queer, etc.), fandoms (music, sports, etc.), and fitness and diet preferences, among other areas of interest.
All data in this study are from this source, unless otherwise noted. Independent research firm, Culture Co-op, conducted and analyzed research and findings.


