SNAP reliance and benefits by state
Nearly 42 million individuals across the United States are covered by the Supplemental Nutrition Assistance Program (SNAP), according to May 2025 data from the U.S. Department of Agriculture, with a monthly benefit of around $188 per person. The use of the SNAP program and benefit amounts vary greatly by state, meaning residents in some areas will be more affected by the program’s halted payments in November, resulting from the ongoing government shutdown.
With this in mind, SmartAsset evaluated the most recent SNAP program data to determine each state population’s reliance on the program and the estimated individual and total benefits received.
Key Findings
- Over 20% of the population claims SNAP benefits in New Mexico. New Mexico has the highest reliance on the SNAP program nationwide, with 21.5% of residents enrolled in the program. These beneficiaries receive an average of $176.51 per month each. Oregon has the second-highest rate of SNAP enrollment, at 18.1% of the population.
- These states receive the highest SNAP payouts per person. Alaska and Hawai’i both receive nearly double the average SNAP benefit per person, at $364.31 and $361.78 per month, respectively. New York ($218.44), Massachusetts ($215.64), and Tennessee ($203.20) beneficiaries receive the highest average payouts among the contiguous states.
- California receives over $1 billion per month in SNAP benefits. Despite ranking 13th overall for reliance on SNAP, California’s sheer size makes it the most expensive state for SNAP by a wide margin. The SNAP program pays out roughly $1.045 billion per month to beneficiaries in the state, compared to $647 million in New York, $614 million in Texas, and $535 million in Florida.
- Wyoming is the least dependent on SNAP. Wyoming claims the lowest percentage of the population enrolled in SNAP, at 4.62%. Statewide, 27,122 total beneficiaries receive an average of $183.81 per month each. Utah has the second-lowest reliance, at 5.05%, followed by New Hampshire, at 5.37%.
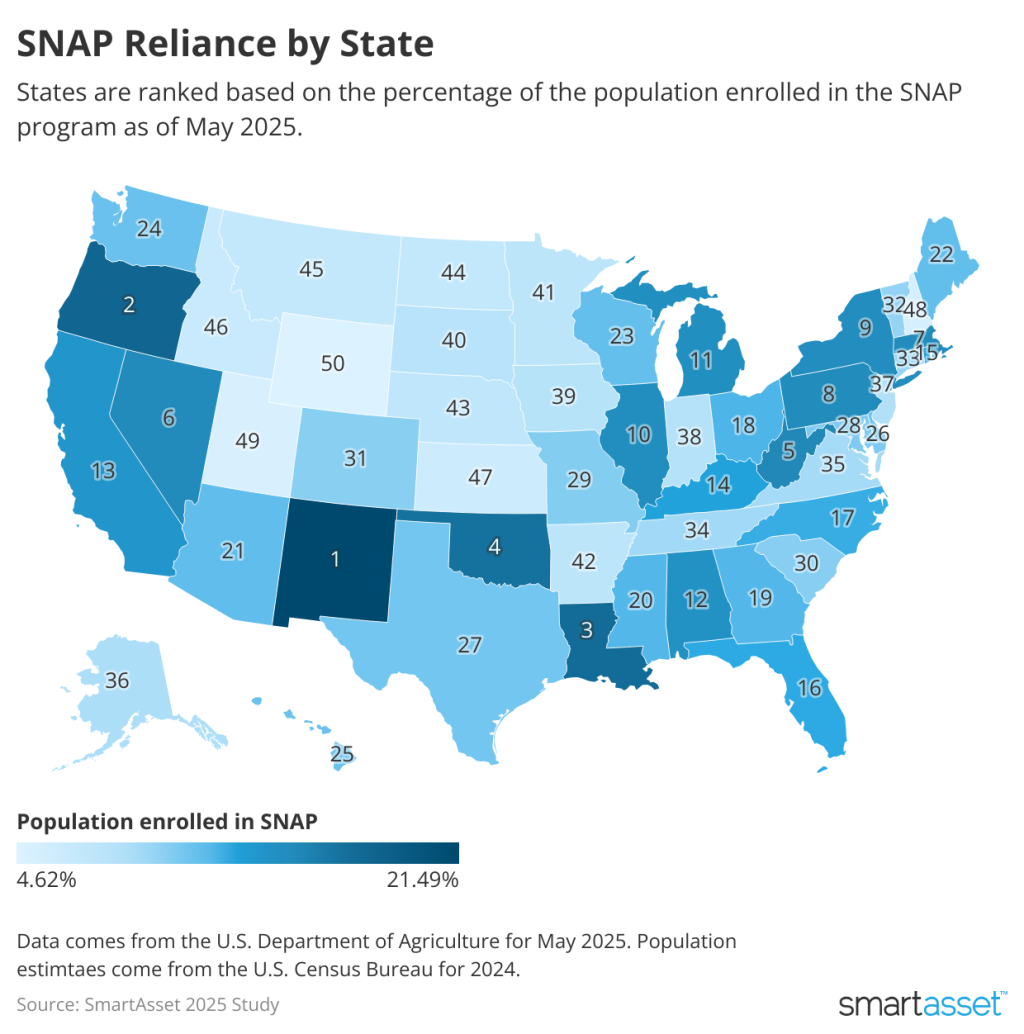
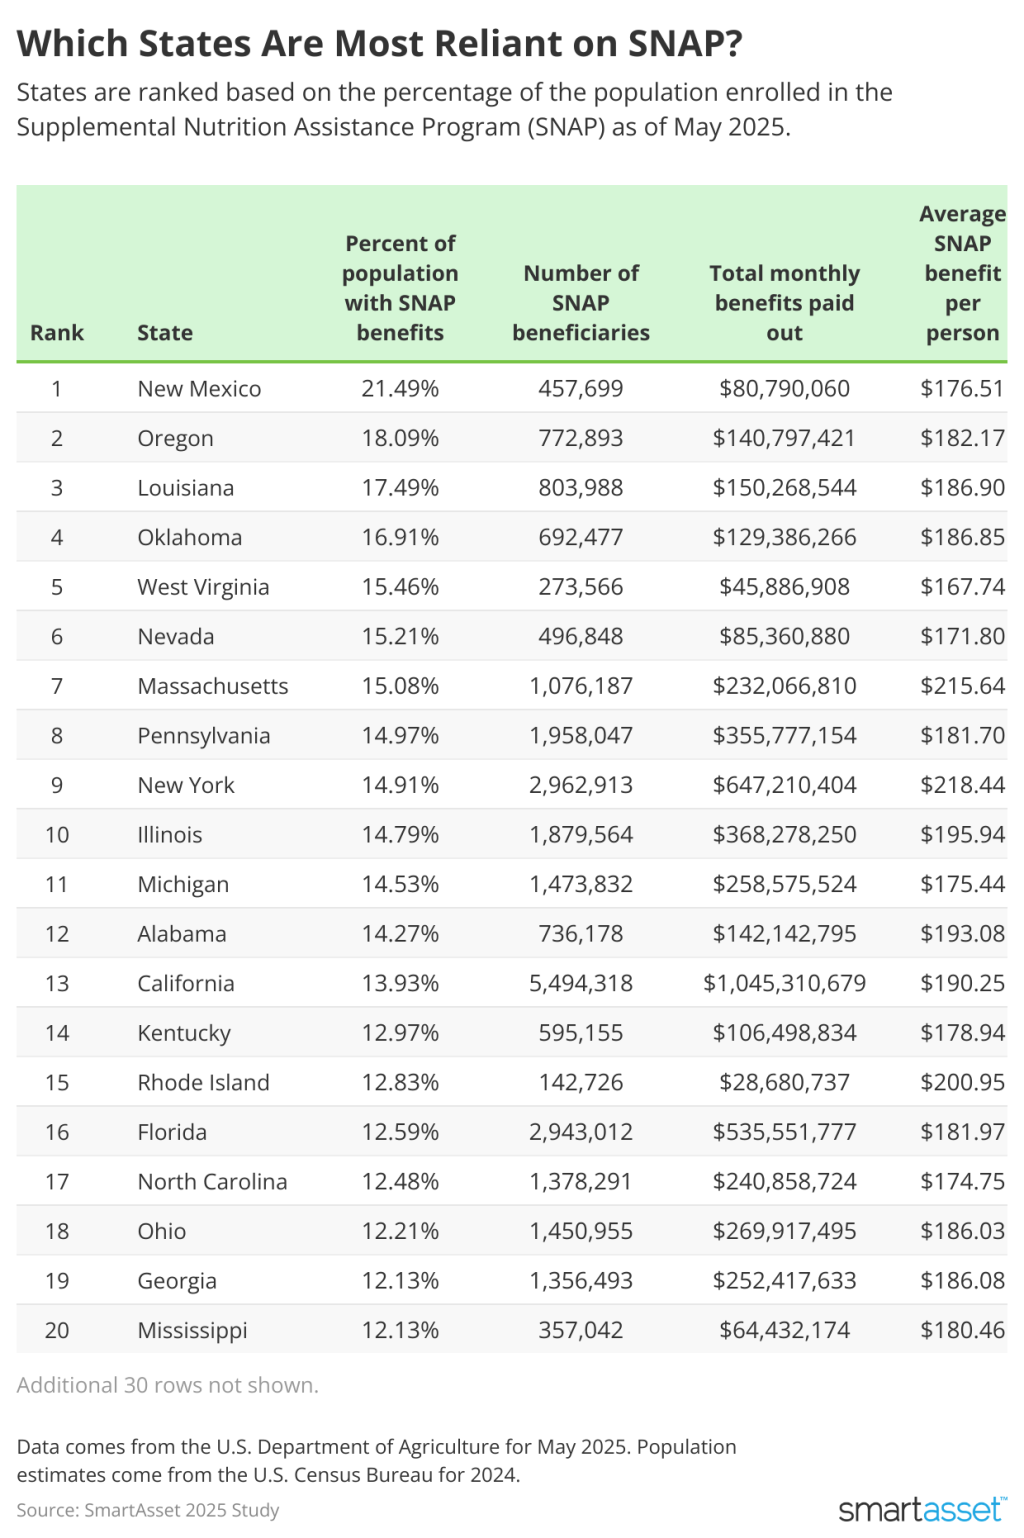
SNAP Beneficiaries and Benefits by State: 2025
States are ranked based on the percentage of residents enrolled in the SNAP program.
- New Mexico
- Percent of population with SNAP benefits: 21.49%
- Number of SNAP beneficiaries: 457,699
- Households enrolled: 248,010
- One-year change in SNAP beneficiaries: -2.52%
- Total monthly benefits paid out: $80,790,060
- Average SNAP benefit per person: $176.51
- Oregon
- Percent of population with SNAP benefits: 18.09%
- Number of SNAP beneficiaries: 772,893
- Households enrolled: 454,718
- One-year change in SNAP beneficiaries: 0.70%
- Total monthly benefits paid out: $140,797,421
- Average SNAP benefit per person: $182.17
- Louisiana
- Percent of population with SNAP benefits: 17.49%
- Number of SNAP beneficiaries: 803,988
- Households enrolled: 397,526
- One-year change in SNAP beneficiaries: -3.61%
- Total monthly benefits paid out: $150,268,544
- Average SNAP benefit per person: $186.90
- Oklahoma
- Percent of population with SNAP benefits: 16.91%
- Number of SNAP beneficiaries: 692,477
- Households enrolled: 339,504
- One-year change in SNAP beneficiaries: 0.50%
- Total monthly benefits paid out: $129,386,266
- Average SNAP benefit per person: $186.85
- West Virginia
- Percent of population with SNAP benefits: 15.46%
- Number of SNAP beneficiaries: 273,566
- Households enrolled: 146,769
- One-year change in SNAP beneficiaries: -2.49%
- Total monthly benefits paid out: $45,886,908
- Average SNAP benefit per person: $167.74
- Nevada
- Percent of population with SNAP benefits: 15.21%
- Number of SNAP beneficiaries: 496,848
- Households enrolled: 270,987
- One-year change in SNAP beneficiaries: -1.28%
- Total monthly benefits paid out: $85,360,880
- Average SNAP benefit per person: $171.80
- Massachusetts
- Percent of population with SNAP benefits: 15.08%
- Number of SNAP beneficiaries: 1,076,187
- Households enrolled: 661,429
- One-year change in SNAP beneficiaries: -4.13%
- Total monthly benefits paid out: $232,066,810
- Average SNAP benefit per person: $215.64
- Pennsylvania
- Percent of population with SNAP benefits: 14.97%
- Number of SNAP beneficiaries: 1,958,047
- Households enrolled: 1,069,170
- One-year change in SNAP beneficiaries: -2.81%
- Total monthly benefits paid out: $355,777,154
- Average SNAP benefit per person: $181.70
- New York
- Percent of population with SNAP benefits: 14.91%
- Number of SNAP beneficiaries: 2,962,913
- Households enrolled: 1,745,549
- One-year change in SNAP beneficiaries: -0.10%
- Total monthly benefits paid out: $647,210,404
- Average SNAP benefit per person: $218.44
- Illinois
- Percent of population with SNAP benefits: 14.79%
- Number of SNAP beneficiaries: 1,879,564
- Households enrolled: 1,036,667
- One-year change in SNAP beneficiaries: -3.54%
- Total monthly benefits paid out: $368,278,250
- Average SNAP benefit per person: $195.94
- Michigan
- Percent of population with SNAP benefits: 14.53%
- Number of SNAP beneficiaries: 1,473,832
- Households enrolled: 781,600
- One-year change in SNAP beneficiaries: 0.92%
- Total monthly benefits paid out: $258,575,524
- Average SNAP benefit per person: $175.44
- Alabama
- Percent of population with SNAP benefits: 14.27%
- Number of SNAP beneficiaries: 736,178
- Households enrolled: 369,276
- One-year change in SNAP beneficiaries: -1.80%
- Total monthly benefits paid out: $142,142,795
- Average SNAP benefit per person: $193.08
- California
- Percent of population with SNAP benefits: 13.93%
- Number of SNAP beneficiaries: 5,494,318
- Households enrolled: 3,255,676
- One-year change in SNAP beneficiaries: 0.92%
- Total monthly benefits paid out: $1,045,310,679
- Average SNAP benefit per person: $190.25
- Kentucky
- Percent of population with SNAP benefits: 12.97%
- Number of SNAP beneficiaries: 595,155
- Households enrolled: 286,577
- One-year change in SNAP beneficiaries: 7.05%
- Total monthly benefits paid out: $106,498,834
- Average SNAP benefit per person: $178.94
- Rhode Island
- Percent of population with SNAP benefits: 12.83%
- Number of SNAP beneficiaries: 142,726
- Households enrolled: 89,424
- One-year change in SNAP beneficiaries: -1.23%
- Total monthly benefits paid out: $28,680,737
- Average SNAP benefit per person: $200.95
- Florida
- Percent of population with SNAP benefits: 12.59%
- Number of SNAP beneficiaries: 2,943,012
- Households enrolled: 1,660,076
- One-year change in SNAP beneficiaries: 0.22%
- Total monthly benefits paid out: $535,551,777
- Average SNAP benefit per person: $181.97
- North Carolina
- Percent of population with SNAP benefits: 12.48%
- Number of SNAP beneficiaries: 1,378,291
- Households enrolled: 687,718
- One-year change in SNAP beneficiaries: -1.59%
- Total monthly benefits paid out: $240,858,724
- Average SNAP benefit per person: $174.75
- Ohio
- Percent of population with SNAP benefits: 12.21%
- Number of SNAP beneficiaries: 1,450,955
- Households enrolled: 741,867
- One-year change in SNAP beneficiaries: 3.54%
- Total monthly benefits paid out: $269,917,495
- Average SNAP benefit per person: $186.03
- Georgia
- Percent of population with SNAP benefits: 12.13%
- Number of SNAP beneficiaries: 1,356,493
- Households enrolled: 657,367
- One-year change in SNAP beneficiaries: -2.85%
- Total monthly benefits paid out: $252,417,633
- Average SNAP benefit per person: $186.08
- Mississippi
- Percent of population with SNAP benefits: 12.13%
- Number of SNAP beneficiaries: 357,042
- Households enrolled: 177,575
- One-year change in SNAP beneficiaries: -4.53%
- Total monthly benefits paid out: $64,432,174
- Average SNAP benefit per person: $180.46
- Arizona
- Percent of population with SNAP benefits: 11.70%
- Number of SNAP beneficiaries: 887,253
- Households enrolled: 444,810
- One-year change in SNAP beneficiaries: -4.27%
- Total monthly benefits paid out: $161,705,602
- Average SNAP benefit per person: $182.25
- Maine
- Percent of population with SNAP benefits: 11.64%
- Number of SNAP beneficiaries: 163,520
- Households enrolled: 97,103
- One-year change in SNAP beneficiaries: -5.62%
- Total monthly benefits paid out: $28,869,975
- Average SNAP benefit per person: $176.55
- Wisconsin
- Percent of population with SNAP benefits: 11.56%
- Number of SNAP beneficiaries: 689,315
- Households enrolled: 367,659
- One-year change in SNAP beneficiaries: -1.93%
- Total monthly benefits paid out: $112,973,934
- Average SNAP benefit per person: $163.89
- Washington
- Percent of population with SNAP benefits: 11.38%
- Number of SNAP beneficiaries: 905,471
- Households enrolled: 531,127
- One-year change in SNAP beneficiaries: 1.48%
- Total monthly benefits paid out: $167,068,578
- Average SNAP benefit per person: $184.51
- Hawai’i
- Percent of population with SNAP benefits: 11.31%
- Number of SNAP beneficiaries: 163,576
- Households enrolled: 84,333
- One-year change in SNAP beneficiaries: 5.03%
- Total monthly benefits paid out: $59,178,123
- Average SNAP benefit per person: $361.78
- Delaware
- Percent of population with SNAP benefits: 11.24%
- Number of SNAP beneficiaries: 118,209
- Households enrolled: 60,298
- One-year change in SNAP beneficiaries: 2.13%
- Total monthly benefits paid out: $21,340,950
- Average SNAP benefit per person: $180.54
- Texas
- Percent of population with SNAP benefits: 11.04%
- Number of SNAP beneficiaries: 3,455,085
- Households enrolled: 1,581,331
- One-year change in SNAP beneficiaries: 9.81%
- Total monthly benefits paid out: $614,386,464
- Average SNAP benefit per person: $177.82
- Maryland
- Percent of population with SNAP benefits: 10.67%
- Number of SNAP beneficiaries: 667,981
- Households enrolled: 371,828
- One-year change in SNAP beneficiaries: -4.30%
- Total monthly benefits paid out: $121,902,010
- Average SNAP benefit per person: $182.49
- Missouri
- Percent of population with SNAP benefits: 10.50%
- Number of SNAP beneficiaries: 655,940
- Households enrolled: 322,265
- One-year change in SNAP beneficiaries: 0.09%
- Total monthly benefits paid out: $128,629,589
- Average SNAP benefit per person: $196.10
- South Carolina
- Percent of population with SNAP benefits: 10.37%
- Number of SNAP beneficiaries: 567,895
- Households enrolled: 271,592
- One-year change in SNAP beneficiaries: -1.65%
- Total monthly benefits paid out: $105,867,349
- Average SNAP benefit per person: $186.42
- Colorado
- Percent of population with SNAP benefits: 10.32%
- Number of SNAP beneficiaries: 614,843
- Households enrolled: 334,341
- One-year change in SNAP beneficiaries: 4.56%
- Total monthly benefits paid out: $120,493,408
- Average SNAP benefit per person: $195.97
- Vermont
- Percent of population with SNAP benefits: 9.97%
- Number of SNAP beneficiaries: 64,633
- Households enrolled: 39,213
- One-year change in SNAP beneficiaries: -1.91%
- Total monthly benefits paid out: $12,199,424
- Average SNAP benefit per person: $188.75
- Connecticut
- Percent of population with SNAP benefits: 9.89%
- Number of SNAP beneficiaries: 363,524
- Households enrolled: 217,128
- One-year change in SNAP beneficiaries: -7.57%
- Total monthly benefits paid out: $70,118,853
- Average SNAP benefit per person: $192.89
- Tennessee
- Percent of population with SNAP benefits: 9.55%
- Number of SNAP beneficiaries: 690,545
- Households enrolled: 341,555
- One-year change in SNAP beneficiaries: -3.85%
- Total monthly benefits paid out: $140,318,213
- Average SNAP benefit per person: $203.20
- Virginia
- Percent of population with SNAP benefits: 9.36%
- Number of SNAP beneficiaries: 824,866
- Households enrolled: 425,195
- One-year change in SNAP beneficiaries: -1.73%
- Total monthly benefits paid out: $143,392,688
- Average SNAP benefit per person: $173.84
- Alaska
- Percent of population with SNAP benefits: 8.97%
- Number of SNAP beneficiaries: 66,377
- Households enrolled: 31,194
- One-year change in SNAP beneficiaries: -16.55%
- Total monthly benefits paid out: $24,181,479
- Average SNAP benefit per person: $364.31
- New Jersey
- Percent of population with SNAP benefits: 8.69%
- Number of SNAP beneficiaries: 826,094
- Households enrolled: 441,324
- One-year change in SNAP beneficiaries: -2.81%
- Total monthly benefits paid out: $160,778,766
- Average SNAP benefit per person: $194.63
- Indiana
- Percent of population with SNAP benefits: 8.47%
- Number of SNAP beneficiaries: 586,403
- Households enrolled: 280,166
- One-year change in SNAP beneficiaries: -2.56%
- Total monthly benefits paid out: $114,763,019
- Average SNAP benefit per person: $195.71
- Iowa
- Percent of population with SNAP benefits: 8.24%
- Number of SNAP beneficiaries: 267,158
- Households enrolled: 130,767
- One-year change in SNAP beneficiaries: 3.21%
- Total monthly benefits paid out: $45,159,537
- Average SNAP benefit per person: $169.04
- South Dakota
- Percent of population with SNAP benefits: 8.14%
- Number of SNAP beneficiaries: 75,282
- Households enrolled: 37,712
- One-year change in SNAP beneficiaries: -0.36%
- Total monthly benefits paid out: $14,923,544
- Average SNAP benefit per person: $198.24
- Minnesota
- Percent of population with SNAP benefits: 7.80%
- Number of SNAP beneficiaries: 451,966
- Households enrolled: 237,118
- One-year change in SNAP beneficiaries: -0.58%
- Total monthly benefits paid out: $71,616,027
- Average SNAP benefit per person: $158.45
- Arkansas
- Percent of population with SNAP benefits: 7.76%
- Number of SNAP beneficiaries: 239,748
- Households enrolled: 126,839
- One-year change in SNAP beneficiaries: 1.45%
- Total monthly benefits paid out: $41,434,391
- Average SNAP benefit per person: $172.82
- Nebraska
- Percent of population with SNAP benefits: 7.51%
- Number of SNAP beneficiaries: 150,600
- Households enrolled: 74,727
- One-year change in SNAP beneficiaries: -2.91%
- Total monthly benefits paid out: $27,258,920
- Average SNAP benefit per person: $181.00
- North Dakota
- Percent of population with SNAP benefits: 7.17%
- Number of SNAP beneficiaries: 57,129
- Households enrolled: 28,532
- One-year change in SNAP beneficiaries: 13.76%
- Total monthly benefits paid out: $9,959,141
- Average SNAP benefit per person: $174.33
- Montana
- Percent of population with SNAP benefits: 7.08%
- Number of SNAP beneficiaries: 80,523
- Households enrolled: 41,792
- One-year change in SNAP beneficiaries: -1.78%
- Total monthly benefits paid out: $13,743,731
- Average SNAP benefit per person: $170.68
- Idaho
- Percent of population with SNAP benefits: 6.67%
- Number of SNAP beneficiaries: 133,545
- Households enrolled: 67,707
- One-year change in SNAP beneficiaries: 0.50%
- Total monthly benefits paid out: $23,906,189
- Average SNAP benefit per person: $179.01
- Kansas
- Percent of population with SNAP benefits: 6.26%
- Number of SNAP beneficiaries: 186,036
- Households enrolled: 93,122
- One-year change in SNAP beneficiaries: -0.80%
- Total monthly benefits paid out: $32,971,957
- Average SNAP benefit per person: $177.23
- New Hampshire
- Percent of population with SNAP benefits: 5.37%
- Number of SNAP beneficiaries: 75,717
- Households enrolled: 42,596
- One-year change in SNAP beneficiaries: -1.72%
- Total monthly benefits paid out: $12,838,748
- Average SNAP benefit per person: $169.56
- Utah
- Percent of population with SNAP benefits: 5.05%
- Number of SNAP beneficiaries: 177,087
- Households enrolled: 89,026
- One-year change in SNAP beneficiaries: 2.24%
- Total monthly benefits paid out: $34,030,139
- Average SNAP benefit per person: $192.17
- Wyoming
- Percent of population with SNAP benefits: 4.62%
- Number of SNAP beneficiaries: 27,122
- Households enrolled: 13,073
- One-year change in SNAP beneficiaries: -7.45%
- Total monthly benefits paid out: $4,985,385
- Average SNAP benefit per person: $183.81
Data and Methodology
Data for the Supplemental Nutrition Assistance Program (SNAP) comes from the U.S. Department of Agriculture Food and Nutrition Services SNAP Data Tables for May 2025 (accessed in November 2025). States are ranked based on the percentage of the population enrolled in the SNAP program as of May 2025. Population estimates come from the U.S. Census Bureau 1-Year American Community Survey for 2024.
This story was produced by SmartAsset and reviewed and distributed by Stacker.


