Healthy hotspots: The 25 most physically active counties in the US
This story originally appeared on Northwell Health and was produced and distributed in partnership with Stacker Studio.
Healthy hotspots: The 25 most physically active counties in the US
Regular physical activity is beneficial for both physical and mental health. But only 1 in 5 U.S. adults and teens get sufficient exercise, according to the American Heart Association.
A lack of physical exercise may lead to increased mental health struggles. Per 2024 data from the Centers for Disease Control and Prevention, 5% of adults in the U.S. report regular feelings of depression, and 12% of adults report regular feelings of anxiety. And while exercise might not be a magical cure-all for mental ailments, the practice can significantly improve patients' lives. A January 2026 review of medical evidence by research network Cochrane found that physical exercise is equally effective in treating depression as antidepressants and therapy.
Many studies have also demonstrated that physical exercise provides boosts to cognitive function. For example, a May 2025 review of evidence notes that physical exercise shows promise as a means of slowing age-related cognitive decline.
Needless to say, physical exercise is essential to maintaining just about all aspects of your health. So where are the best places in the U.S. to get a move on?
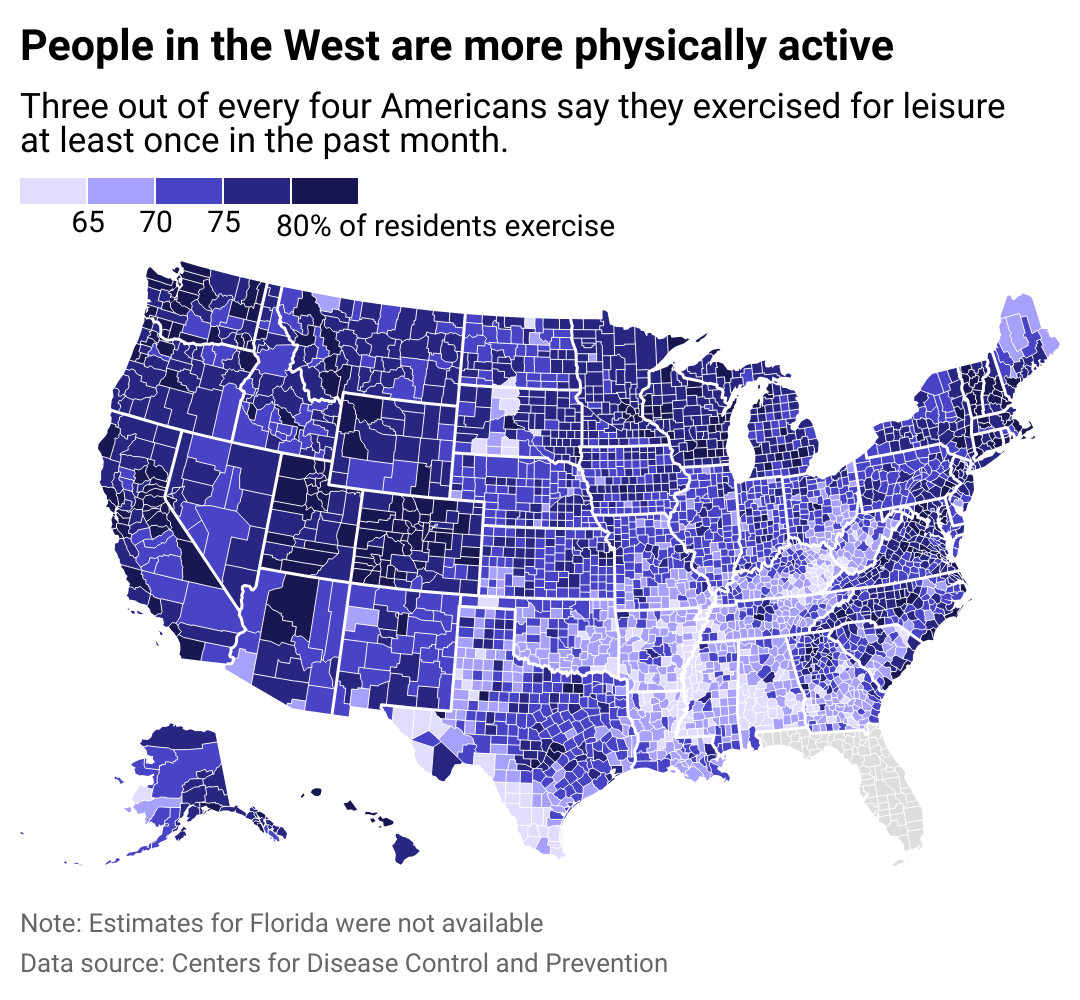
Northwell Health examined data from the Centers for Disease Control and Prevention's annual PLACES report, released in 2023, to see which counties had the most physically active adults. The survey, administered in 2021, asked respondents if they had exercised for leisure in the past month. The data measures the share of adults who reported low or no physical activity.
Counties are ranked by the share of adults who reported any level of leisure physical activity, including running, golf, or gardening. The CDC did not include estimates for Florida because they did not meet data eligibility requirements.
The 25 most active counties in the country with at least 10,000 residents are listed below. In the event of a tie, the overall population was used.
How physical activity varies across the country
Income is a potent predictor of the time a person devotes to physical exercise. People on lower incomes can face greater challenges when trying to exercise consistently because adequate public spaces may not be available, gym membership and workout equipment are expensive, and they may have less flexible work schedules.
2022 data from the CDC found that people in families with higher incomes, as well as men and white people, were more likely than others to meet physical activity guidelines.
The Peter G. Peterson Foundation reported that, in 2023, households in Northeastern and Western states earned, on average, $7,270 to $15,010 more a year than households in the Midwest and South, respectively. People who live in those regions are more likely to report higher rates of physical activity.
#25. Eagle, Colorado
- Total population: 55,727
- Share of adults reporting any physical activity: 84.6%
#24. Placer, California
- Total population: 412,300
- Share of adults reporting any physical activity: 84.6%
#23. Park, Colorado
- Total population: 17,720
- Share of adults reporting any physical activity: 84.9%
#22. Ozaukee, Wisconsin
- Total population: 92,497
- Share of adults reporting any physical activity: 85.1%
#21. Larimer, Colorado
- Total population: 362,533
- Share of adults reporting any physical activity: 85.1%
#20. Elbert, Colorado
- Total population: 27,128
- Share of adults reporting any physical activity: 85.3%
#19. Morgan, Utah
- Total population: 12,657
- Share of adults reporting any physical activity: 85.4%
#18. Lamoille, Vermont
- Total population: 26,126
- Share of adults reporting any physical activity: 85.4%
#17. Gallatin, Montana
- Total population: 122,713
- Share of adults reporting any physical activity: 85.4%
#16. Gunnison, Colorado
- Total population: 17,281
- Share of adults reporting any physical activity: 85.5%
#15. Summit, Colorado
- Total population: 30,941
- Share of adults reporting any physical activity: 85.7%
#14. King, Washington
- Total population: 2,252,305
- Share of adults reporting any physical activity: 85.7%
#13. San Juan, Washington
- Total population: 18,557
- Share of adults reporting any physical activity: 85.8%
#12. Arlington, Virginia
- Total population: 232,965
- Share of adults reporting any physical activity: 85.8%
#11. Summit, Utah
- Total population: 43,093
- Share of adults reporting any physical activity: 86.3%
#10. Chittenden, Vermont
- Total population: 168,865
- Share of adults reporting any physical activity: 86.3%
#9. Jefferson, Colorado
- Total population: 579,581
- Share of adults reporting any physical activity: 86.3%
#8. Falls Church, Virginia
- Total population: 14,493
- Share of adults reporting any physical activity: 86.6%
#7. Routt, Colorado
- Total population: 25,091
- Share of adults reporting any physical activity: 86.6%
#6. Marin, California
- Total population: 260,206
- Share of adults reporting any physical activity: 86.7%
#5. Los Alamos, New Mexico
- Total population: 19,330
- Share of adults reporting any physical activity: 87.7%
#4. Pitkin, Colorado
- Total population: 17,348
- Share of adults reporting any physical activity: 87.8%
#3. Broomfield, Colorado
- Total population: 75,325
- Share of adults reporting any physical activity: 87.9%
#2. Boulder, Colorado
- Total population: 329,543
- Share of adults reporting any physical activity: 88.0%
#1. Douglas, Colorado
- Total population: 393,995
- Share of adults reporting any physical activity: 88.0%
Data reporting by Elena Cox. Story editing by Jeff Inglis. Copy editing by Kristen Wegrzyn. Photo selection by Clarese Moller.