
Dong Nhat Huy // Shutterstock
1 / 10#10. Vietnamese
- 380 speakers (0.16% of population)

Stacker compiled a list of the most common languages spoken at home in the Bowling Green metro area using data from the U.S. Census Bureau. Languages are ranked by the percent of households that primarily speak the language at home according to 2025 estimates. Combined statistical areas are designated by the Office of Management and Budget and include multiple metropolitan and micropolitan areas in the same region.
You may also like: Lowest-paying jobs in Bowling Green
Dong Nhat Huy // Shutterstock
1 / 10- 380 speakers (0.16% of population)

naokita // Shutterstock
2 / 10- 406 speakers (0.17% of population)
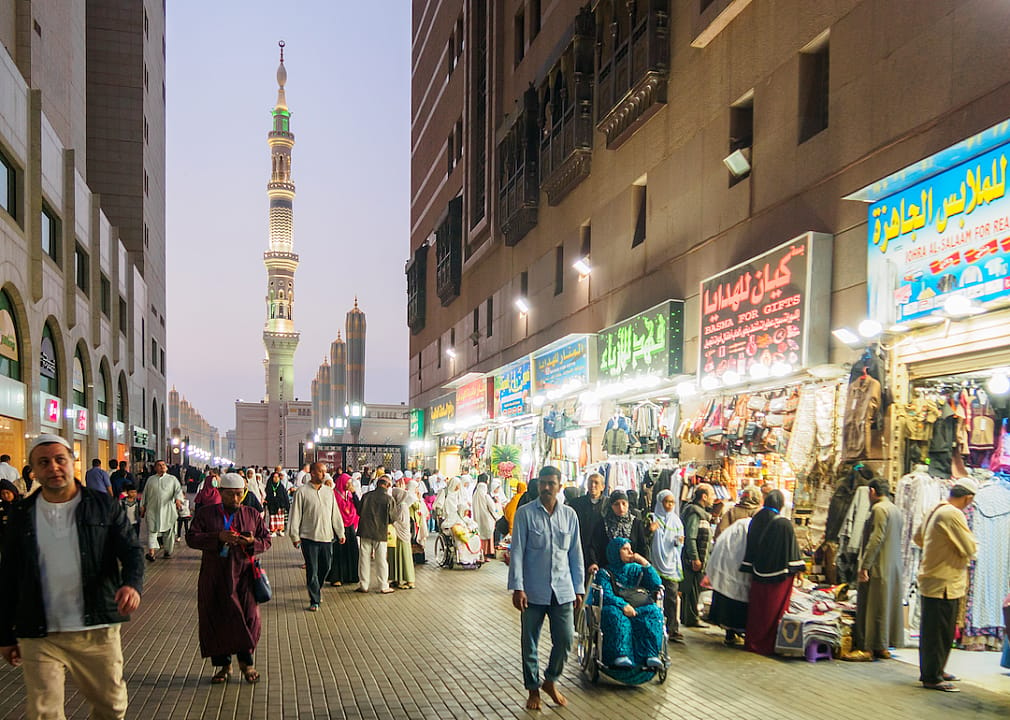
Fitria Ramli // Shutterstock
3 / 10- 436 speakers (0.18% of population)
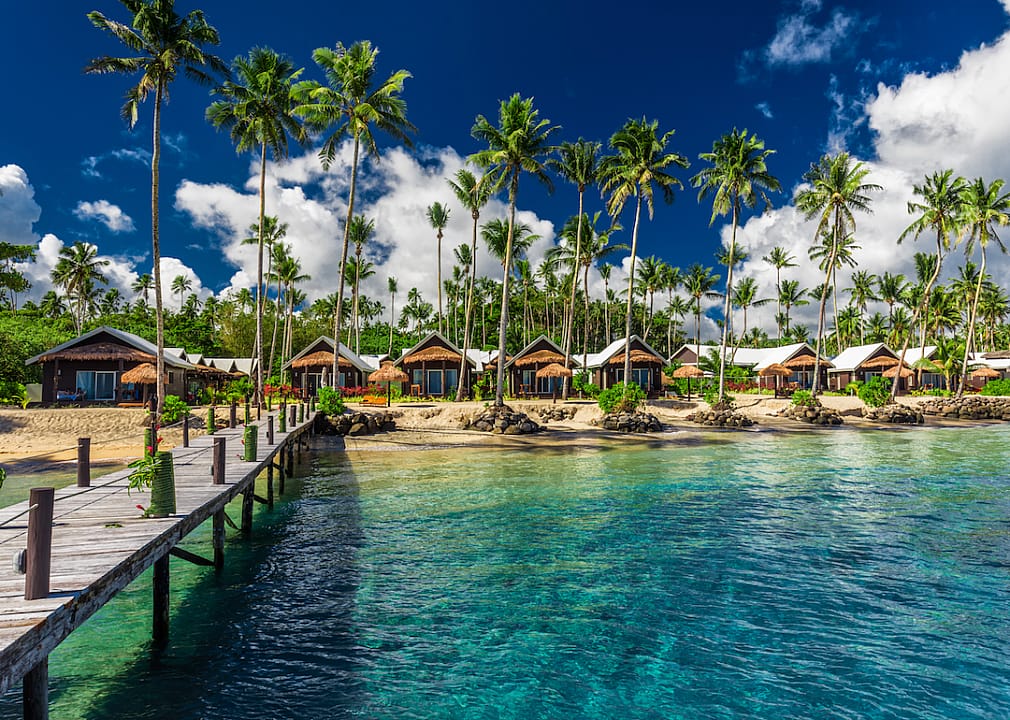
Martin Valigursky // Shutterstock
4 / 10- 561 speakers (0.23% of population)

elxeneize // Shutterstock
5 / 10- 1,087 speakers (0.45% of population)
You may also like: Highest-rated Asian restaurants in Bowling Green by diners
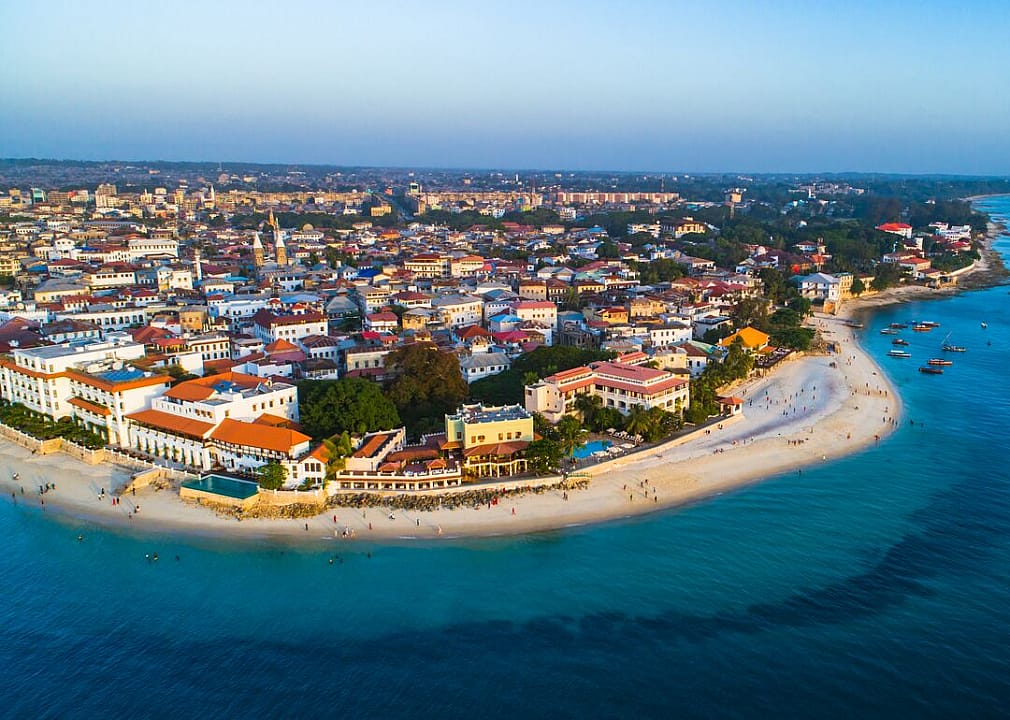
Marius Dobilas // Shutterstock
6 / 10- 1,532 speakers (0.63% of population)

hutch photography // Shutterstock
7 / 10- 1,777 speakers (0.73% of population)
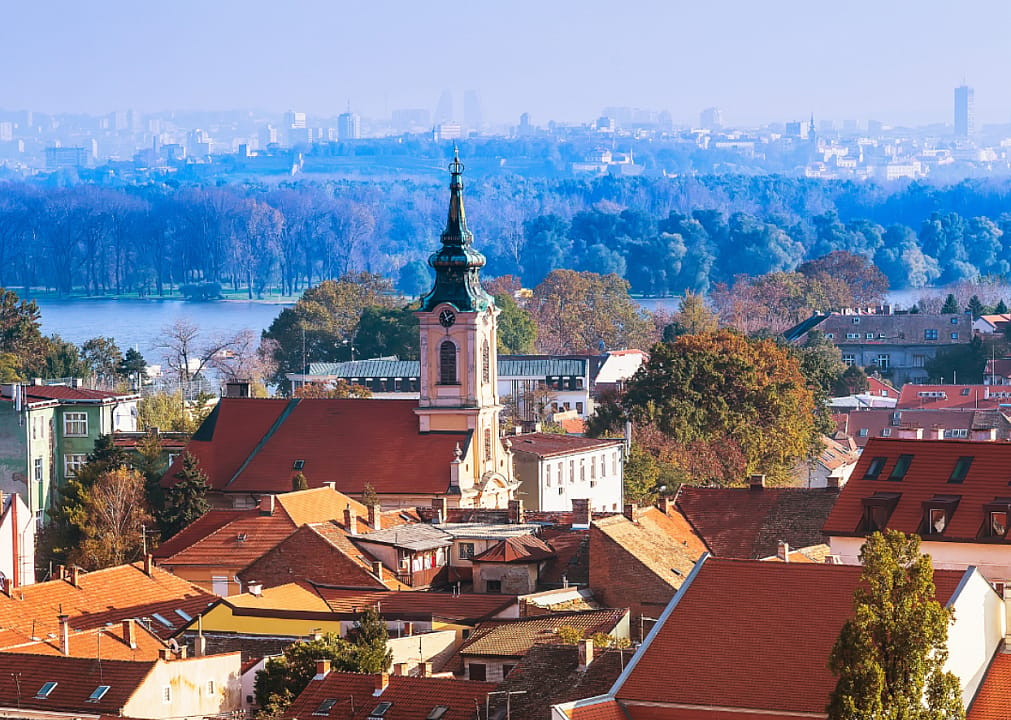
Nataliya Nazarova // Shutterstock
8 / 10- 1,857 speakers (0.77% of population)
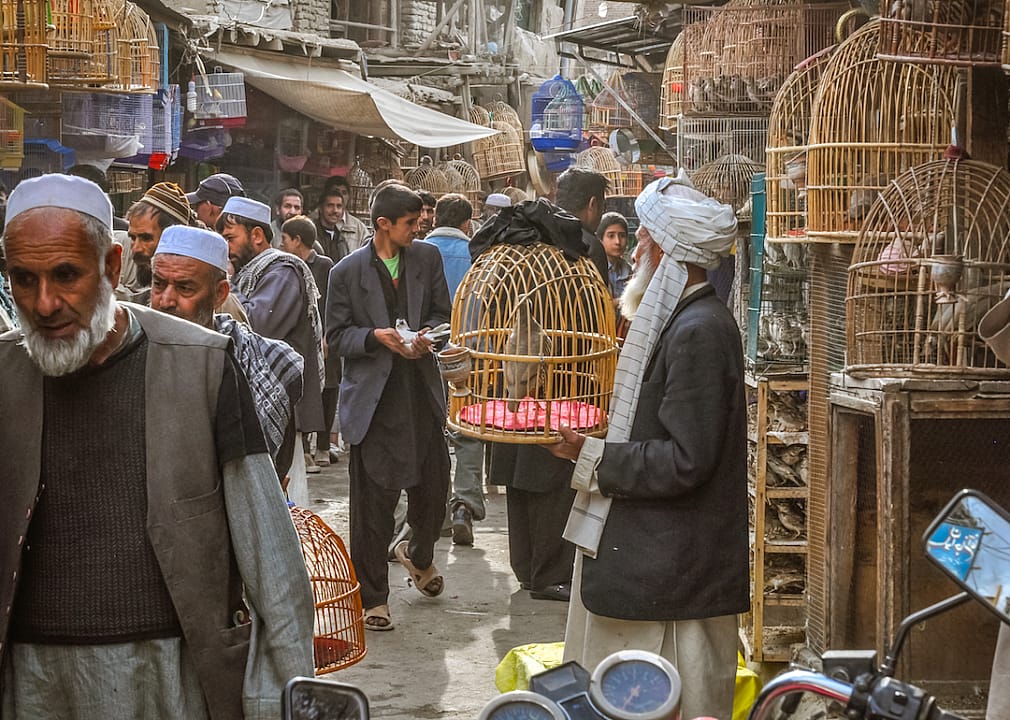
Michal Knitl // Shutterstock
9 / 10- 3,194 speakers (1.32% of population)
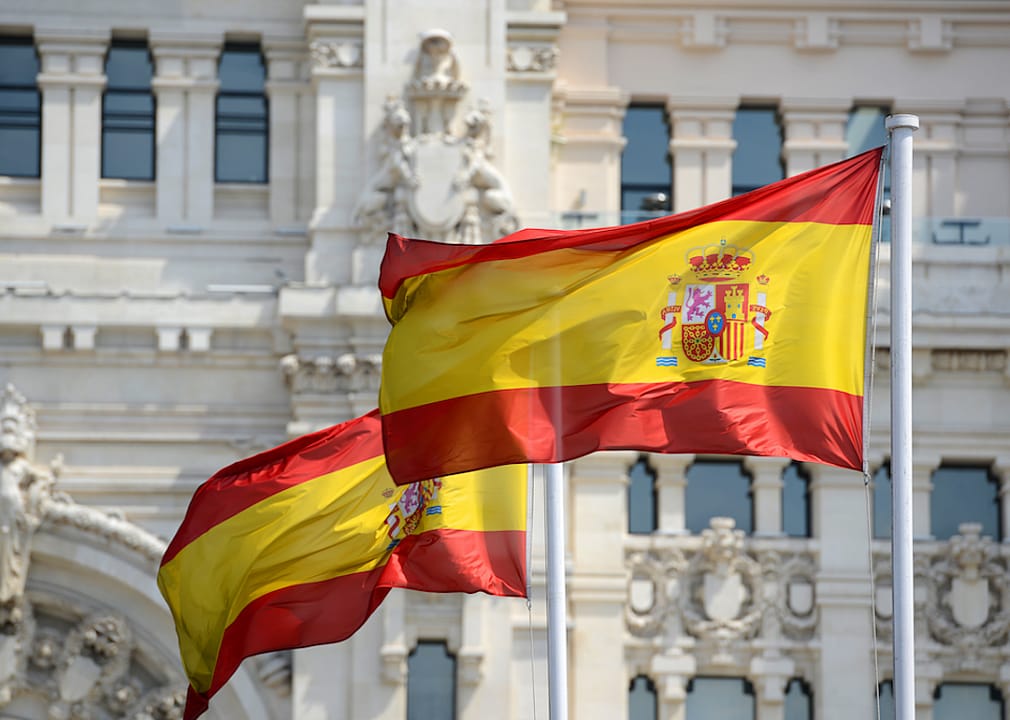
Wangkun Jia // Shutterstock
10 / 10- 8,947 speakers (3.69% of population)
You may also like: Cities with the most expensive homes in the Bowling Green metro area



