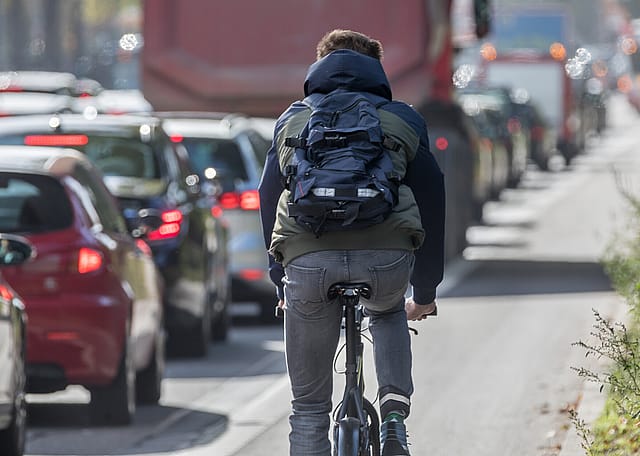
Stacker compiled a list of the counties with the best commutes in Kentucky using data from the U.S. Census Bureau. Counties are ranked by the shortest average travel time to work, with ties broken by lowest percent of residents that commute over 60 minutes, and any further ties broken by lowest percent of residents that work outside the county of residence.
You may also like: Fastest-growing jobs in Kentucky
FloNight (Sydney Poore) and Russell Poore // Wikimedia Commons
1 / 50#50. Madison County
- Mean travel time to work: 24.2
- Workers with 60+ minute commute: 6.3%
- Worked outside of county of residence: 29.4%
Ryan Emmick // Wikimedia Commons
2 / 50#49. Hancock County
- Mean travel time to work: 24.2
- Workers with 60+ minute commute: 4.9%
- Worked outside of county of residence: 26.9%
verygreen // Wikimedia Commons
3 / 50#48. Rockcastle County
- Mean travel time to work: 24.1
- Workers with 60+ minute commute: 8.1%
- Worked outside of county of residence: 43.8%
Turover // Wikimedia Commons
4 / 50#47. Greenup County
- Mean travel time to work: 24.0
- Workers with 60+ minute commute: 5.8%
- Worked outside of county of residence: 38.2%
Nyttend // Wikimedia Commons
5 / 50W.marsh // Wikimedia Commons
6 / 50#45. Harlan County
- Mean travel time to work: 23.8
- Workers with 60+ minute commute: 10.1%
- Worked outside of county of residence: 12.0%
Rdikeman // Wikimedia Commons
7 / 50#44. Campbell County
- Mean travel time to work: 23.7
- Workers with 60+ minute commute: 4.2%
- Worked outside of county of residence: 23.3%
Megangen1990 // Wikimedia Commons
8 / 50#43. Muhlenberg County
- Mean travel time to work: 23.6
- Workers with 60+ minute commute: 9.4%
- Worked outside of county of residence: 32.1%
Nyttend // Wikimedia Commons
9 / 50#42. Bell County
- Mean travel time to work: 23.6
- Workers with 60+ minute commute: 6.4%
- Worked outside of county of residence: 11.7%
Nyttend // Wikimedia Commons
10 / 50W.marsh // Wikimedia Commons
11 / 50#40. Bourbon County
- Mean travel time to work: 23.6
- Workers with 60+ minute commute: 4.2%
- Worked outside of county of residence: 49.5%
Brian Stansberry // Wikimedia Commons
12 / 50#39. Washington County
- Mean travel time to work: 23.4
- Workers with 60+ minute commute: 10.2%
- Worked outside of county of residence: 38.0%
Nyttend // Wikimedia Commons
13 / 50#38. Wolfe County
- Mean travel time to work: 23.3
- Workers with 60+ minute commute: 10.4%
- Worked outside of county of residence: 49.5%
JERRYE & ROY KLOTZ MD // Wikimedia Commons
14 / 50#37. Wayne County
- Mean travel time to work: 23.3
- Workers with 60+ minute commute: 5.4%
- Worked outside of county of residence: 28.1%
Greg5030 // Wikimedia Commons
15 / 50Christopher L. Riley // Wikimedia Commons
16 / 50#35. Jessamine County
- Mean travel time to work: 23.3
- Workers with 60+ minute commute: 4.2%
- Worked outside of county of residence: 47.1%
Nyttend // Wikimedia Commons
17 / 50#34. Barren County
- Mean travel time to work: 23.1
- Workers with 60+ minute commute: 4.9%
- Worked outside of county of residence: 29.0%
W.marsh // Wikimedia Commons
18 / 50#33. Woodford County
- Mean travel time to work: 23.0
- Workers with 60+ minute commute: 5.1%
- Worked outside of county of residence: 46.8%
w:User:Malepheasant // Wikimedia Commons
19 / 50#32. Boyd County
- Mean travel time to work: 22.9
- Workers with 60+ minute commute: 5.9%
- Worked outside of county of residence: 11.5%
Nyttend // Wikimedia Commons
20 / 50Nyttend // Wikimedia Commons
21 / 50#30. Metcalfe County
- Mean travel time to work: 22.5
- Workers with 60+ minute commute: 6.3%
- Worked outside of county of residence: 47.5%
Nyttend // Wikimedia Commons
22 / 50#29. Pulaski County
- Mean travel time to work: 22.5
- Workers with 60+ minute commute: 5.7%
- Worked outside of county of residence: 13.2%
Chris Watson // Wikicommons
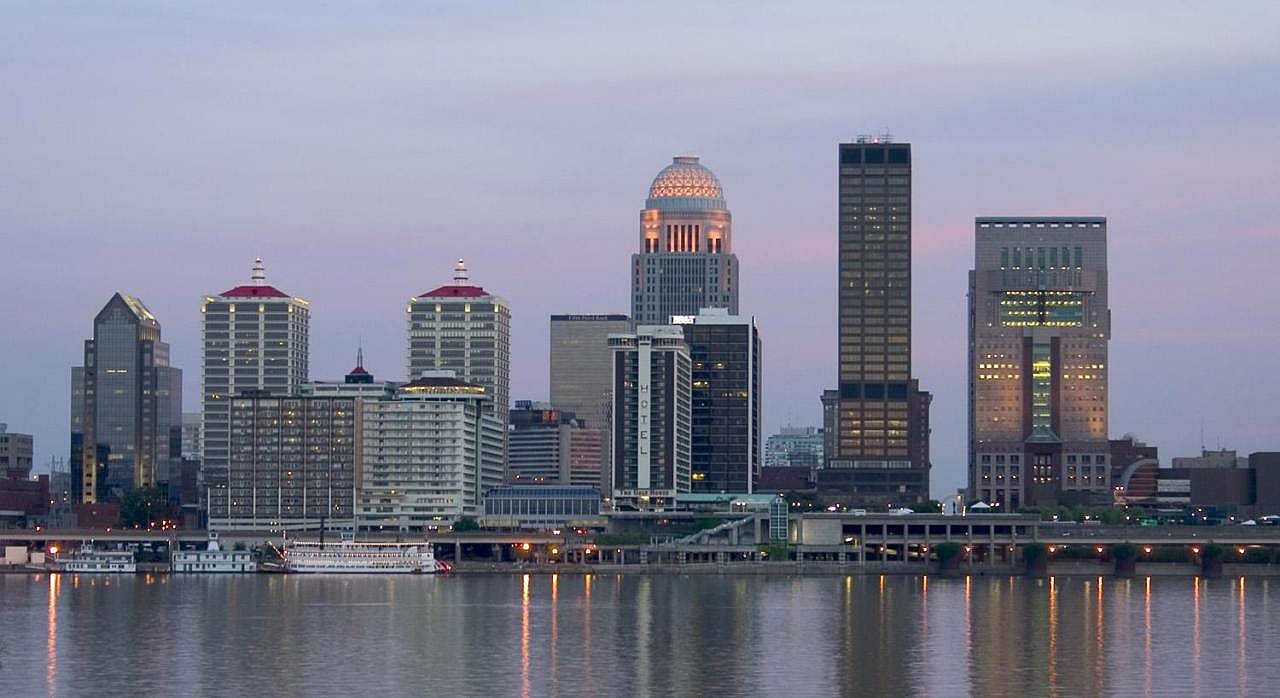
23 / 50#28. Jefferson County
- Mean travel time to work: 22.3
- Workers with 60+ minute commute: 3.2%
- Worked outside of county of residence: 5.1%
W.marsh // Wikimedia Commons
24 / 50#27. Rowan County
- Mean travel time to work: 22.2
- Workers with 60+ minute commute: 10.2%
- Worked outside of county of residence: 22.5%
Nyttend // Wikimedia Commons
25 / 50Nyttend // Wikimedia Commons
26 / 50#25. Lyon County
- Mean travel time to work: 22.1
- Workers with 60+ minute commute: 4.7%
- Worked outside of county of residence: 44.1%
w.marsh // Wikimedia Commons
27 / 50#24. Henderson County
- Mean travel time to work: 22.1
- Workers with 60+ minute commute: 4.0%
- Worked outside of county of residence: 9.4%
Jonathunder // Wikimedia Commons
28 / 50#23. Ballard County
- Mean travel time to work: 22.0
- Workers with 60+ minute commute: 4.1%
- Worked outside of county of residence: 52.1%
Smceuen // Wikimedia Commons
29 / 50#22. Carroll County
- Mean travel time to work: 21.9
- Workers with 60+ minute commute: 5.2%
- Worked outside of county of residence: 23.9%
Christopher L. Riley // Wikimedia Commons
30 / 50No machine-readable author provided. Blinutne assumed (based on copyright claims). // Wikimedia Commons
31 / 50#20. Whitley County
- Mean travel time to work: 21.8
- Workers with 60+ minute commute: 6.2%
- Worked outside of county of residence: 30.8%
Jim.henderson // Wikimedia Commons
32 / 50#19. Hopkins County
- Mean travel time to work: 21.7
- Workers with 60+ minute commute: 6.6%
- Worked outside of county of residence: 21.3%
W.marsh // Wikimedia Commons
33 / 50#18. Scott County
- Mean travel time to work: 21.7
- Workers with 60+ minute commute: 4.2%
- Worked outside of county of residence: 38.7%
W.marsh // Wikimedia Commons
34 / 50#17. Laurel County
- Mean travel time to work: 21.6
- Workers with 60+ minute commute: 4.6%
- Worked outside of county of residence: 22.2%
Nyttend // Wikimedia Commons
35 / 50Bfreas // Wikimedia Commons
36 / 50#15. Simpson County
- Mean travel time to work: 21.1
- Workers with 60+ minute commute: 4.4%
- Worked outside of county of residence: 20.6%
Calvin Beale // Wikimedia Commons
37 / 50#14. Fulton County
- Mean travel time to work: 20.9
- Workers with 60+ minute commute: 3.6%
- Worked outside of county of residence: 19.7%
Christopher L. Riley // Wikimedia Commons
38 / 50#13. Fayette County
- Mean travel time to work: 20.7
- Workers with 60+ minute commute: 4.2%
- Worked outside of county of residence: 14.5%
Wdzinc // Wikimedia Commons
39 / 50#12. Marion County
- Mean travel time to work: 20.4
- Workers with 60+ minute commute: 6.0%
- Worked outside of county of residence: 27.2%
OPMaster // Wikimedia Commons
40 / 50Paul Sableman // Wikimedia Commons
41 / 50#10. Graves County
- Mean travel time to work: 20.1
- Workers with 60+ minute commute: 2.7%
- Worked outside of county of residence: 31.8%
Nyttend // Wikimedia Commons
42 / 50#9. Russell County
- Mean travel time to work: 19.7
- Workers with 60+ minute commute: 6.2%
- Worked outside of county of residence: 22.2%
Nyttend // Wikimedia Commons
43 / 50#8. Cumberland County
- Mean travel time to work: 19.7
- Workers with 60+ minute commute: 5.8%
- Worked outside of county of residence: 23.7%
Farragutful // Wikimedia Commons
44 / 50#7. Daviess County
- Mean travel time to work: 19.7
- Workers with 60+ minute commute: 4.7%
- Worked outside of county of residence: 8.2%
Nyttend // Wikimedia Commons
45 / 50JERRYE & ROY KLOTZ MD // Wikimedia Commons
46 / 50#5. Franklin County
- Mean travel time to work: 19.2
- Workers with 60+ minute commute: 3.4%
- Worked outside of county of residence: 20.4%
Brian Stansberry // Wikimedia Commons
47 / 50#4. Hickman County
- Mean travel time to work: 18.3
- Workers with 60+ minute commute: 5.1%
- Worked outside of county of residence: 39.5%
Brian Stansberry // Wikimedia Commons
48 / 50#3. Christian County
- Mean travel time to work: 17.9
- Workers with 60+ minute commute: 4.9%
- Worked outside of county of residence: 5.1%
Smallbones // Wikimedia Commons
49 / 50#2. McCracken County
- Mean travel time to work: 16.8
- Workers with 60+ minute commute: 2.9%
- Worked outside of county of residence: 9.6%
Murray State // Wikimedia Commons
50 / 50#1. Calloway County
- Mean travel time to work: 16.3
- Workers with 60+ minute commute: 3.3%
- Worked outside of county of residence: 16.4%
You may also like: Best NFL players born in Kentucky