
These cities offer the most financial security for seniors
These cities offer the most financial security for seniors
Financial security among seniors is tantamount to quality of life. A recent MIT study revealed that Americans are living longer – more than ten years longer just over the last few decades, in fact – requiring a greater amount of retirement savings than ever. Because of this, some retirees are running out of money in retirement. And where seniors are less financially secure, other economic complications may follow.
To find out where retirees are most and least financially secure, SmartAsset examined poverty, housing, income and government assistance data for the population aged 65 and older for 37 of the largest U.S. cities. Cities are ranked by six metrics measuring the financial security of seniors.
Key findings
- Seniors in Mesa, AZ are most financially secure. Mesa ranks in the top 10 for each individual metric, for a first-place rank overall. Seniors here have the highest percentage of homeownership (79.60%), lowest percentage reliant on food stamps/snap benefits (5.50%), and the second-lowest percentage of senior poverty (10.10%).
- New York City has the tightest housing market for seniors. NYC ranked 35th out of 37 cities when it comes to financial stability among seniors. It has the lowest rate of homeownership among this age group at 45.20%, and the second-highest rate of seniors who are housing-cost burdened: More than half pay more than 30% of their gross income toward housing. This group is also particularly reliant (25.00%) on food stamps/SNAP benefits here.
- More than 75% of seniors own their homes in these cities. In addition to Mesa, the high rates of senior homeownership in Jacksonville, FL (78.70%); Oklahoma City, OK (78.30%); Nashville, TN (78.00%); Louisville, KY (77.90%); Albuquerque, NM (76.20%); Phoenix, AZ (76.00%); Indianapolis, IN (76.00%); and San Antonio, TX (75.70%) indicate a manageable housing market for seniors.
- Seniors have the highest retirement incomes in Washington D.C. Including Social Security and private retirement income, seniors in D.C. bring in $62,686 per year. Those in Seattle ($58,956) and San Jose ($55,871) make second- and third-most.
- More than 45% of retiree income goes toward housing costs in these major California cities. Seniors are most housing-cost burdened in San Jose, where they pay 52.90% of their gross income toward housing on average. San Francisco (52.19%), Los Angeles (45.18%) and San Diego (44.35%) also have exceptionally high income-to-housing-costs ratios.
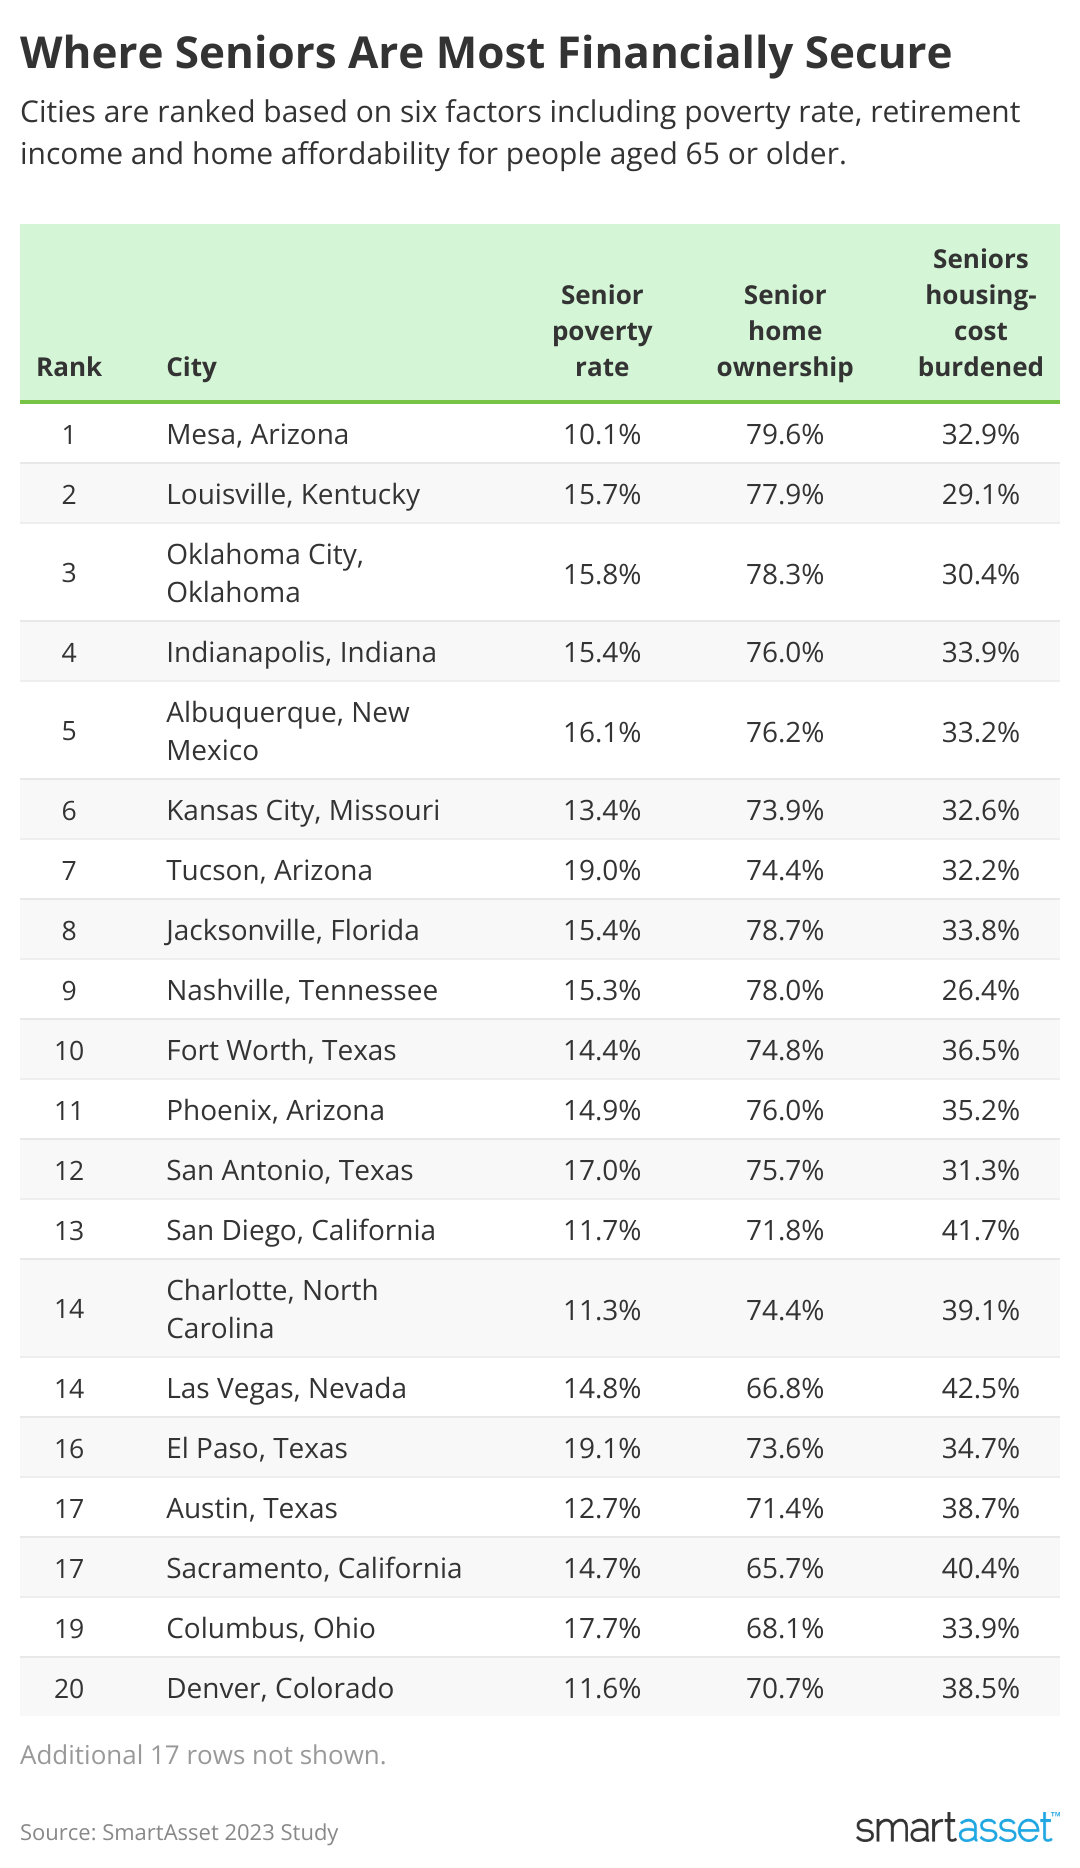
These are the top cities where seniors are most financially secure
- Mesa, AZ
Mesa ranks in the top 10 across all six metrics. It has the lowest proportion of seniors receiving food stamps or SNAP benefits (5.50%), and the highest rate of homeownership among the same group (79.60%). At 10.10%, it also ranks second-best for the lowest senior poverty rate. Nearly one-quarter (24.30%) of seniors have private retirement income, third-best study-wide, and housing is relatively affordable when compared to the median senior income ($53,380). - Louisville, KY
Louisville has the highest percentage of seniors with private retirement income (25.80%) in addition to Social Security. It also has the second-lowest percentage of seniors who are housing-cost burdened (29.14%), which are those paying more than 30% of their income toward housing costs. Nine percent of seniors here are dependent on food stamps/SNAP benefits, while 15.80% are below the poverty line. - Oklahoma City, OK
Oklahoma City doesn't fare best in any particular metric, but it ranks well across the board. The average total retirement income is $46,005 – 25.64% of which typically goes to housing costs. Nearly four in five seniors are homeowners, while 15.80% are below the poverty line. - Indianapolis, IN
Indianapolis seniors experience low rates of poverty (15.40%), high rates of homeownership (76.00%) and low housing costs relative to their income (26.85%). Including Social Security and private retirement income, the total average senior income is $43,802 here. - Albuquerque, NM
When it comes to the lowest percentage of gross income that goes toward housing costs, Albuquerque places first at just 24.26%. It also has the second-highest rate of seniors with private retirement income at 25.20%. Just over 16% of seniors are below the poverty line here and 12.90% are reliant on food stamps or SNAP benefits. - Kansas City, MO
The total average retirement income in Kansas City is $45,757. Just about one-fifth of seniors have private retirement income contributing to that figure in addition to Social Security. Only 8.20% of seniors are reliant on food stamps, though 13.40% are in poverty (10th-best). Meanwhile, 73.90% are homeowners. - Tucson, AZ
In Tucson, 74.40% of seniors own their homes. The average total retirement income is $45,246, 25.22% of which goes toward housing (fourth-best). Nearly one in five (19.00%) seniors are below the poverty line, the highest rate in the top 10. - Jacksonville, FL
Jacksonville boasts the second-highest rate of homeownership by seniors at 78.70%. The income-to-housing-costs ratio spares seniors from being housing-cost burdened on average: 29.26% of gross retirement income ($47,333) goes toward housing costs. - Nashville, TN
Nashville has the lowest proportion of seniors who are housing cost-burden in the major cities at 26.43%, while nearly four in five (78.00%) seniors own their own homes. Roughly 15.30% seniors are in poverty, while 8.70% are dependent on government assistance like food stamps. - Fort Worth, TX
About 17.50% of Fort Worth's roughly 100,000 seniors have private retirement income. On average, total retirement income including Social Security is $53,513 here. Most seniors own their homes (74.80%), but poverty amongst seniors is still at 14.40%.
Data and methodology
37 major U.S. cities for which data was available were ranked across the following six metrics:
- Percentage of seniors below the poverty line. This is the percentage of seniors who live below the federal poverty line.
- Percentage of seniors who receive food stamps/SNAP benefits. This is the percentage of households that receive food stamps for households in which the head of household is 65 or older.
- Percentage of seniors who own their homes. This is the percentage of households in which the head of household is 65 or older and the residents own their home.
- Percentage of seniors with private retirement income. This is the percentage of households in which the head of household is 65 or older which have retirement income from private means. This includes money from income streams such as annuities, insurance, IRAs and retirement pensions.
- Percentage of seniors who are housing cost-burdened. This is the percentage of households in which the head of household is 65 or older and spends 30% or more of income on housing costs. This includes both owners and renters.
- Housing costs as a percentage of average senior retirement income. This is median annual housing costs divided by average senior retirement income, from both private means along with Social Security income.
Data for all metrics comes from the Census Bureau's 2021 1-year American Community Survey. Seniors are defined as those aged 65 or older.
This story was produced by SmartAsset and reviewed and distributed by Stacker Media.