Who gets the most spam calls: A ranking of every state

·Jill Jaracz

wisely // Shutterstock

Gone are the days when a phone ringing off the hook signaled popularity.

Unwanted calls are the most common complaint to the Federal Communication Commission. So far this year, people in all 50 states and the District of Columbia have reported more than 41,000 unwanted calls.

Spam calls come in many forms, including robocalls that use automatic dialing software to quickly call a list of numbers and send a pre-recorded message or use an artificial voice to make their pitch. The robots are busy, too—the FCC notes that robocallers make about 4 billion calls a month.

Robocalls have become such a nuisance that many people have stopped answering their phones. This trend can have serious implications in the case of emergencies, as it could prevent people from getting critical information.

Consumers across the country who do report spam calls to the FCC complain most about live voice calls. However, spam texts increased by 25% from 2021 to 2022. In March 2023, the FCC released its first ruling designed to combat the rise of spam texts by targeting and eliminating illegal texts. The agency hopes this decreases the number of text-based scams and phishing schemes that unlawfully try to get information or money from people.

In partnership with Visible, Stacker analyzed the FCC's Consumer Complaints data and ranked each state based on the least to the most spam calls received in 2023 so far. The data is self-reported and does not represent all spam calls. The number of spam calls reported per 100,000 residents determined the states' ranking. The type of call (pre-recorded calls, live voice calls, or text messages) is listed when available. However, not all complaints included the call type, meaning percentages may not add up to 100.

If you're trying to reduce the number of spam calls you get, register your cell number with the FCC's Do Not Call Registry. Being on the registry can lessen—but not necessarily eliminate—sales calls from legitimate companies. If you're on the registry, nonsales calls from political organizations, charities, debt collectors, surveyors, and those containing information are still allowed to contact you.


New Orleans near the water at dusk.

Canva

1 / 51

#51. Louisiana

- 6 spam calls reported for every 100,000 residents
- Total spam calls reported so far in 2023: 263
-- Live voice: 91 (34.6% of total)
-- Pre-recorded: 68 (25.9% of total)
-- Text message: 24 (9.1% of total)

An aerial view of downtown Charleston at sunset.

Canva

2 / 51

#50. West Virginia

- 6 spam calls reported for every 100,000 residents
- Total spam calls reported so far in 2023: 113
-- Live voice: 40 (35.4% of total)
-- Pre-recorded: 29 (25.7% of total)
-- Text message: 3 (2.7% of total)

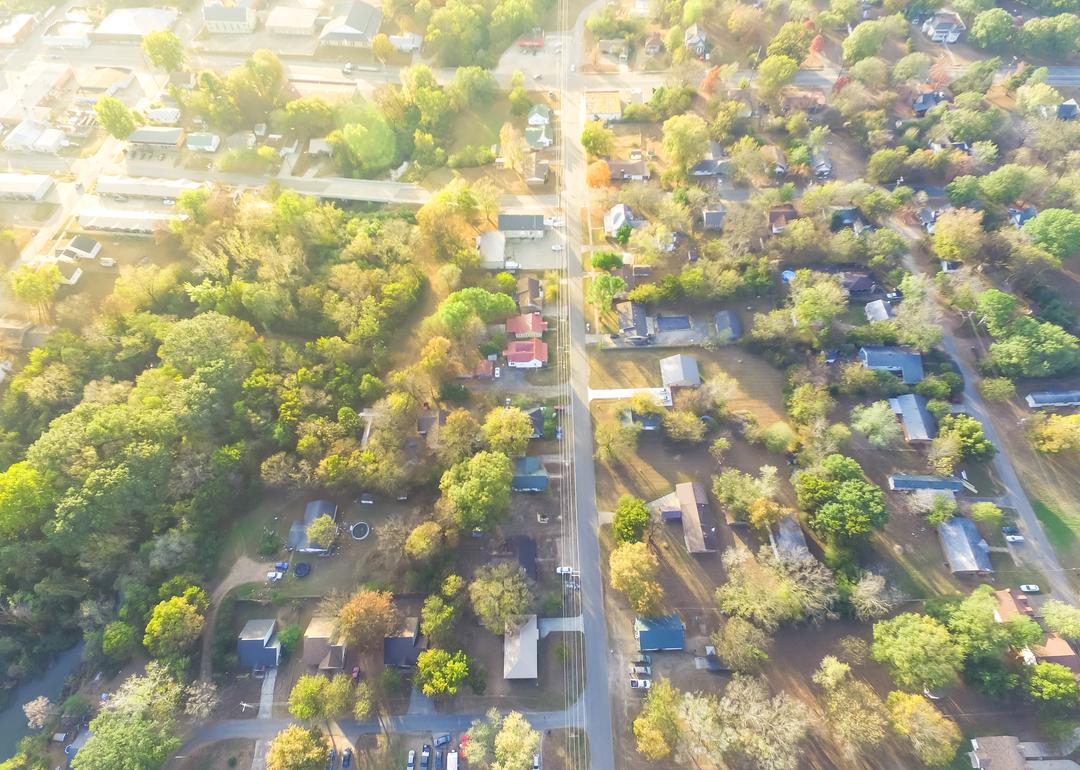
A scenic suburb in Ozark.

Trong Nguyen // Shutterstock

3 / 51

#49. Arkansas

- 7 spam calls reported for every 100,000 residents
- Total spam calls reported so far in 2023: 209
-- Live voice: 72 (34.4% of total)
-- Pre-recorded: 50 (23.9% of total)
-- Text message: 24 (11.5% of total)

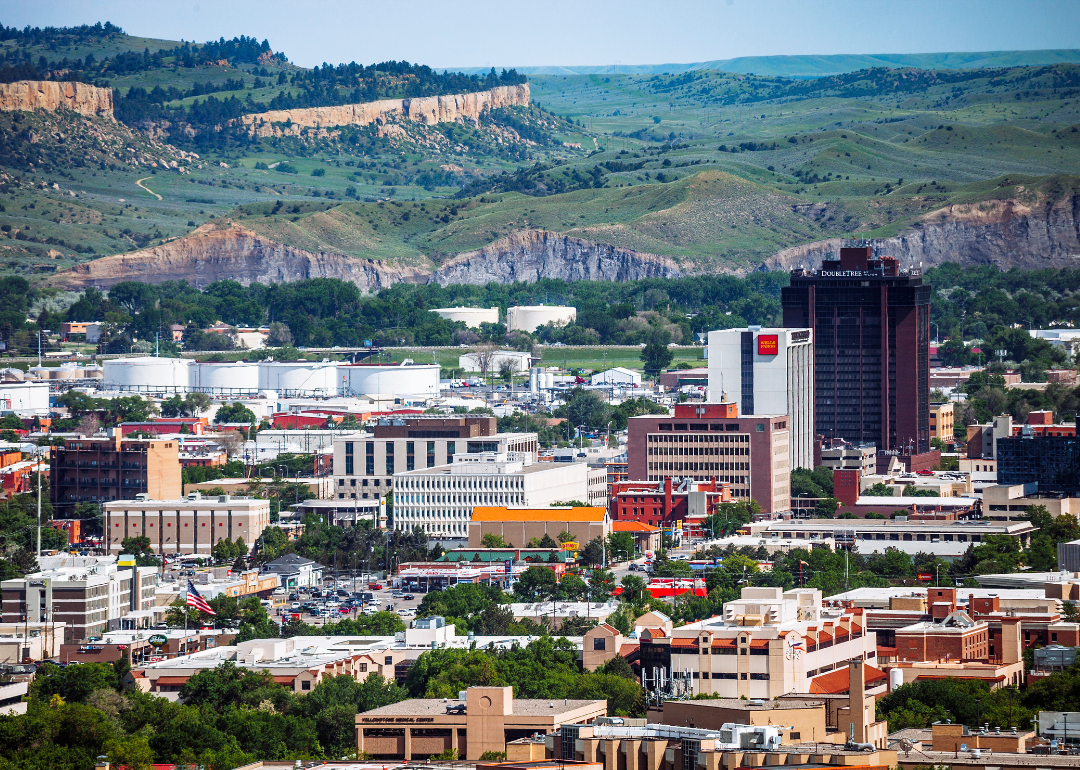
Buildings in Billings with scenic hills in the background.

Canva

4 / 51

#48. Montana

- 7 spam calls reported for every 100,000 residents
- Total spam calls reported so far in 2023: 82
-- Live voice: 22 (26.8% of total)
-- Pre-recorded: 30 (36.6% of total)
-- Text message: 8 (9.8% of total)

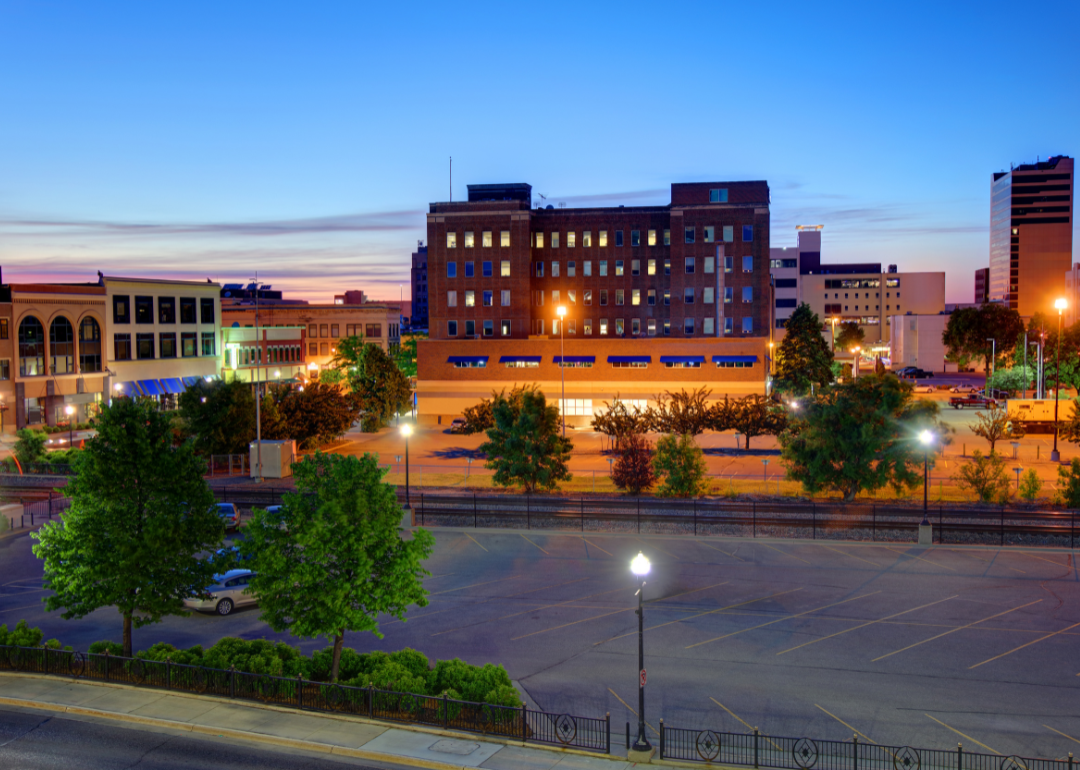
Buildings in Fargo as seen at night.

Canva

5 / 51

#47. North Dakota

- 8 spam calls reported for every 100,000 residents
- Total spam calls reported so far in 2023: 62
-- Live voice: 19 (30.6% of total)
-- Pre-recorded: 21 (33.9% of total)
-- Text message: 4 (6.5% of total)

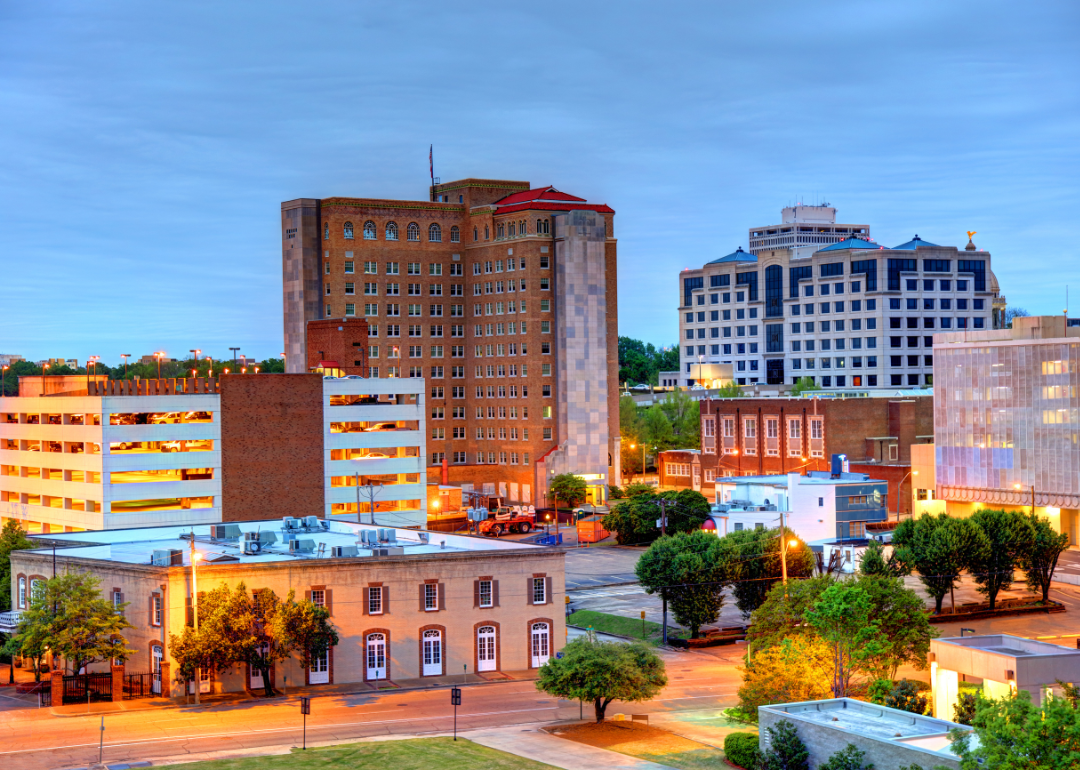
A parking garage and buildings in downtown Jackson.

Canva

6 / 51

#46. Mississippi

- 8 spam calls reported for every 100,000 residents
- Total spam calls reported so far in 2023: 236
-- Live voice: 51 (21.6% of total)
-- Pre-recorded: 114 (48.3% of total)
-- Text message: 18 (7.6% of total)

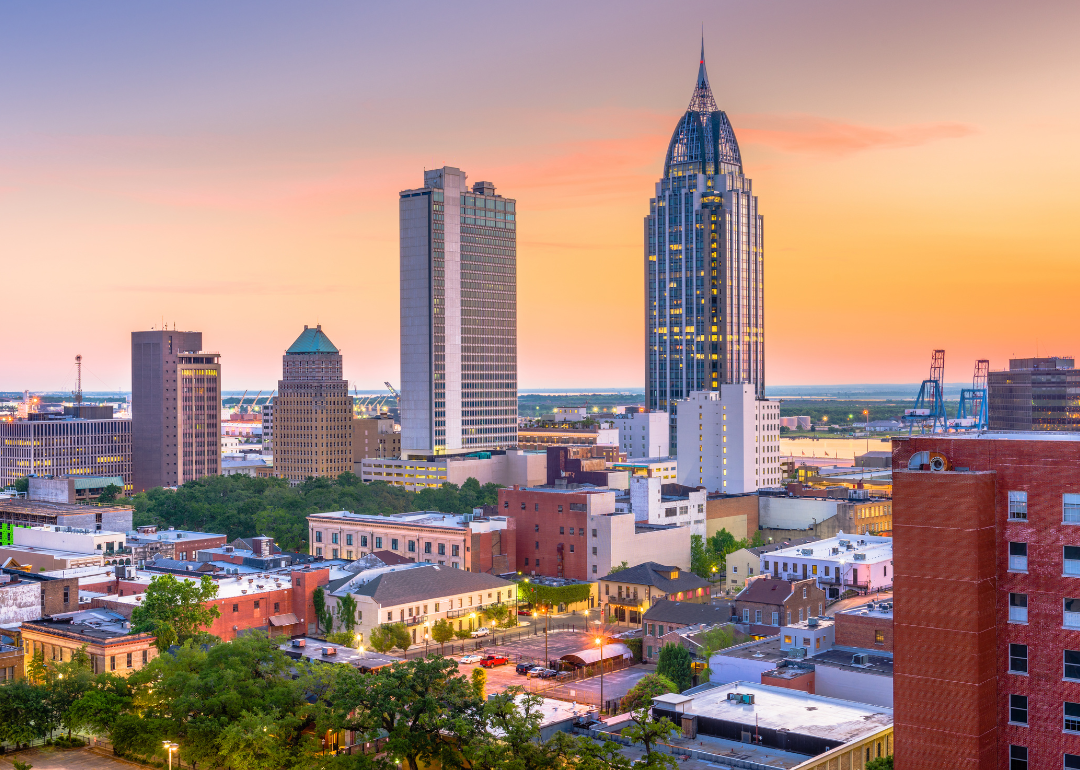
The Mobile skyline as seen at dusk.

Canva

7 / 51

#45. Alabama

- 8 spam calls reported for every 100,000 residents
- Total spam calls reported so far in 2023: 416
-- Live voice: 145 (34.9% of total)
-- Pre-recorded: 117 (28.1% of total)
-- Text message: 27 (6.5% of total)

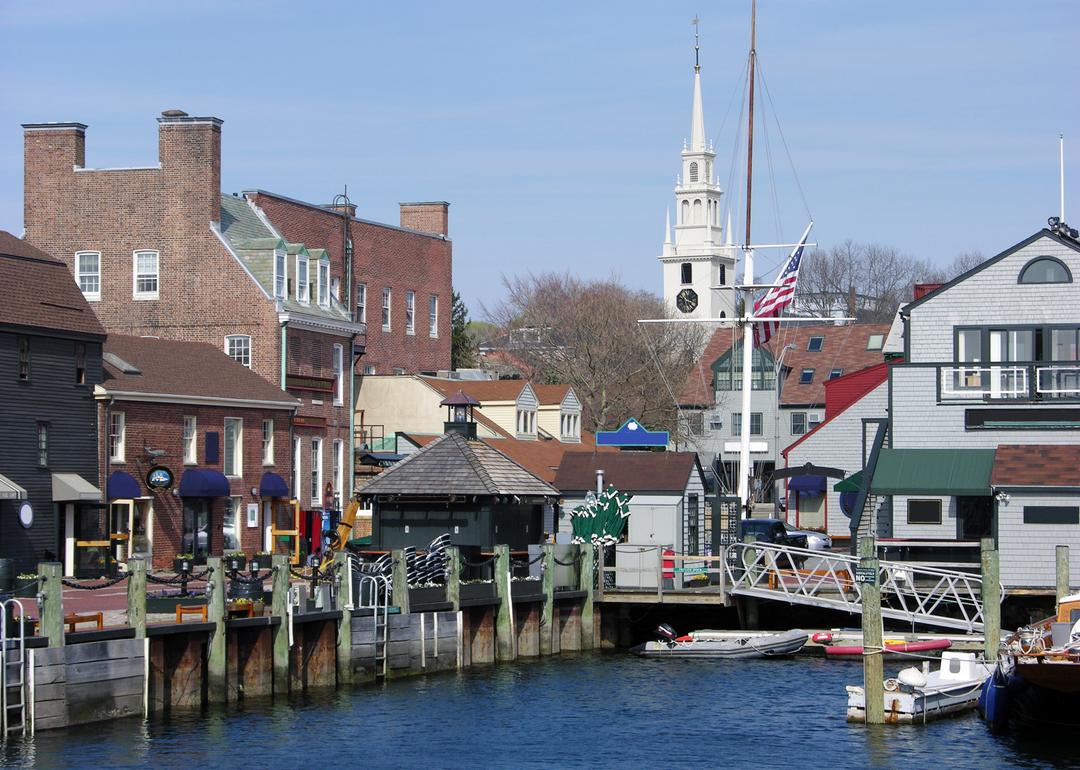
Building, boats, and docks at old harbor in Newport.

Ramunas Bruzas // Shutterstock

8 / 51

#44. Rhode Island

- 8 spam calls reported for every 100,000 residents
- Total spam calls reported so far in 2023: 91
-- Live voice: 24 (26.4% of total)
-- Pre-recorded: 30 (33.0% of total)
-- Text message: 9 (9.9% of total)

Train tracks as seen outside Omaha at night.

Canva

9 / 51

#43. Nebraska

- 8 spam calls reported for every 100,000 residents
- Total spam calls reported so far in 2023: 165
-- Live voice: 57 (34.5% of total)
-- Pre-recorded: 38 (23.0% of total)
-- Text message: 21 (12.7% of total)

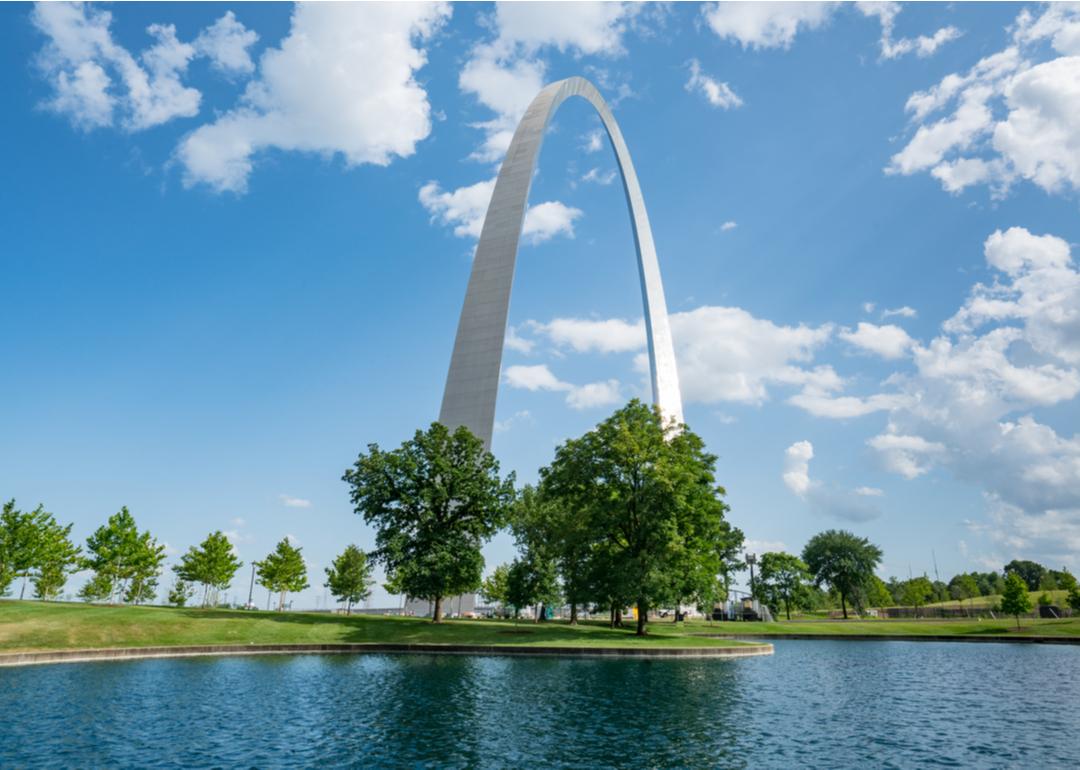
The St. Louis Gateway Arch in Missouri.

Paul Brady Photography // Shutterstock

10 / 51

#42. Missouri

- 8 spam calls reported for every 100,000 residents
- Total spam calls reported so far in 2023: 521
-- Live voice: 154 (29.6% of total)
-- Pre-recorded: 124 (23.8% of total)
-- Text message: 62 (11.9% of total)

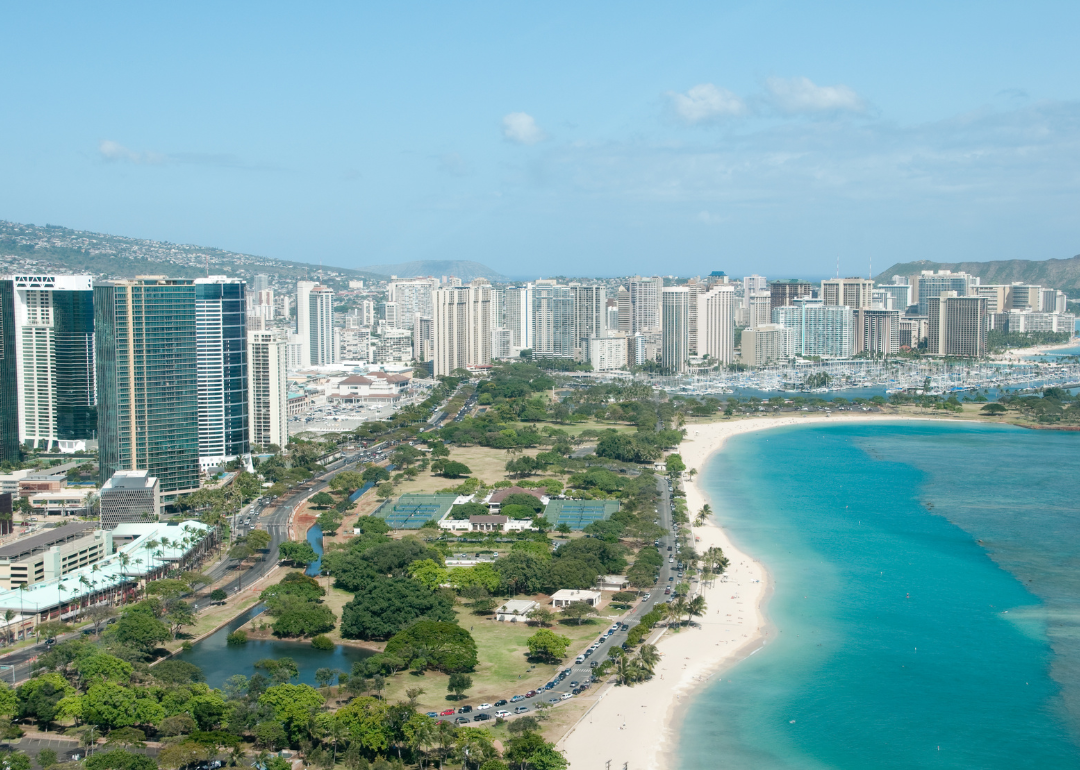
The coastline and luxury hotels and apartments in Honolulu.
Canva

11 / 51

#41. Hawaii
- 9 spam calls reported for every 100,000 residents
- Total spam calls reported so far in 2023: 126
-- Live voice: 35 (27.8% of total)
-- Pre-recorded: 43 (34.1% of total)
-- Text message: 11 (8.7% of total)

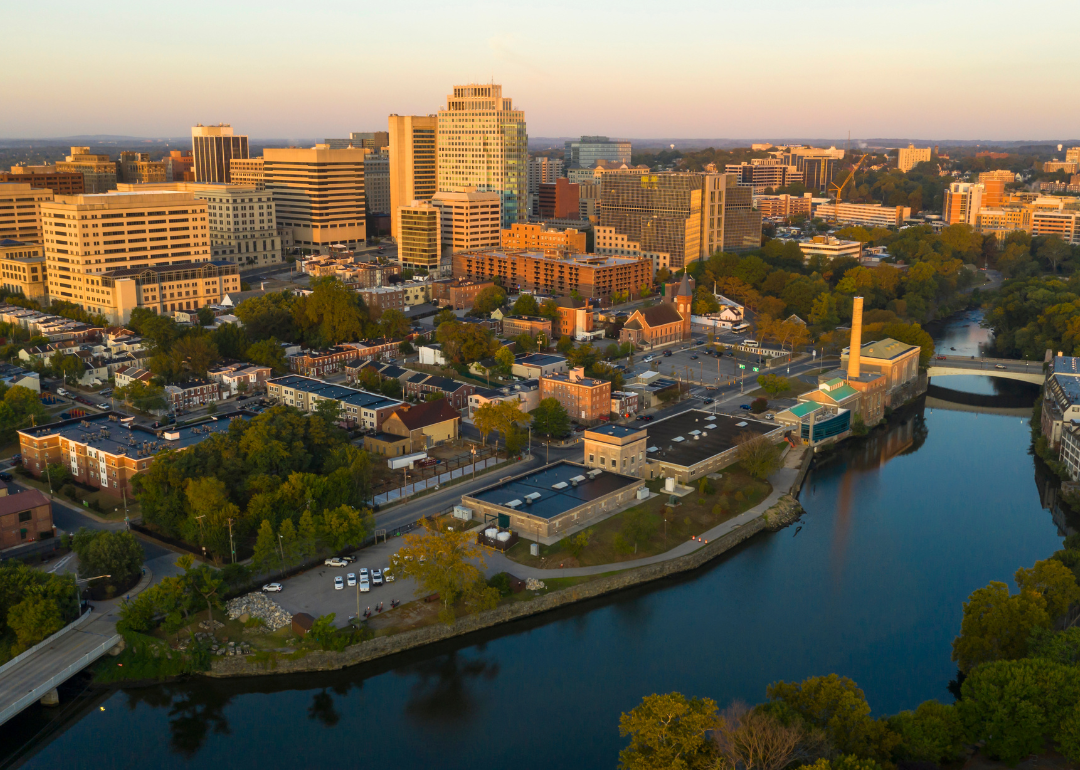
Wilmington as seen during late afternoon.

Canva

12 / 51

#40. Delaware

- 9 spam calls reported for every 100,000 residents
- Total spam calls reported so far in 2023: 90
-- Live voice: 33 (36.7% of total)
-- Pre-recorded: 27 (30.0% of total)
-- Text message: 5 (5.6% of total)

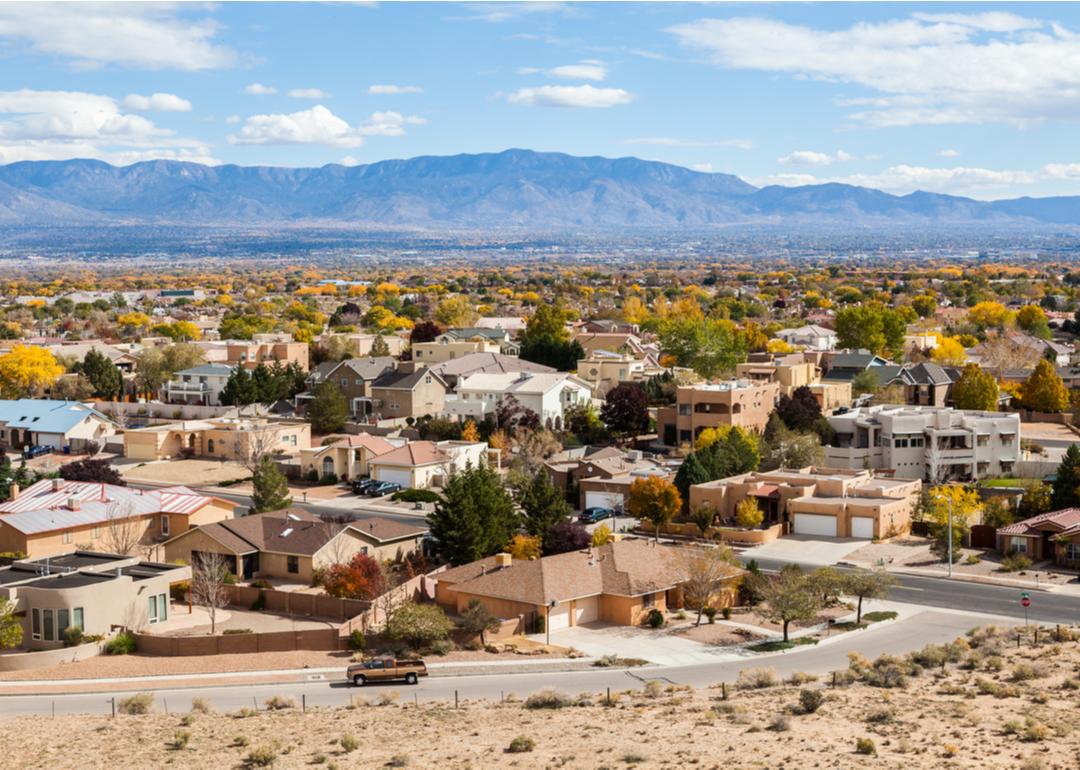
Residential suburbs in Albuquerque.

turtix // Shutterstock

13 / 51

#39. New Mexico

- 9 spam calls reported for every 100,000 residents
- Total spam calls reported so far in 2023: 187
-- Live voice: 45 (24.1% of total)
-- Pre-recorded: 46 (24.6% of total)
-- Text message: 20 (10.7% of total)

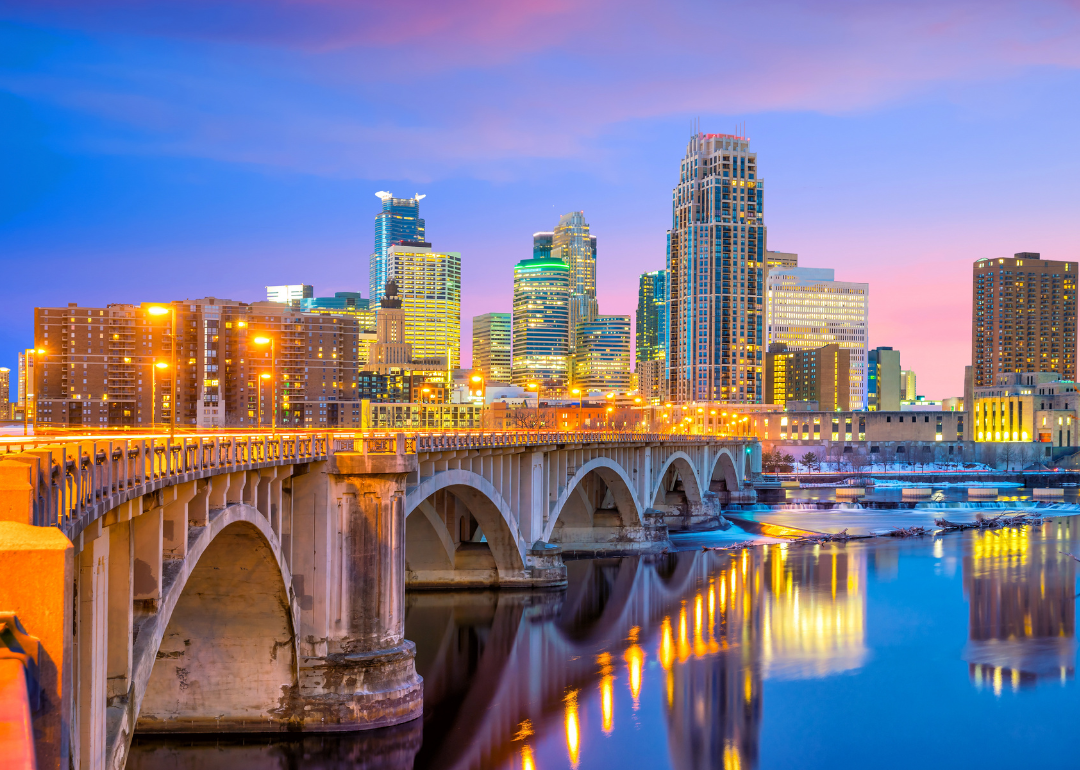
The downtown Minneapolis skyline as seen at night.

Canva

14 / 51

#38. Minnesota

- 9 spam calls reported for every 100,000 residents
- Total spam calls reported so far in 2023: 513
-- Live voice: 125 (24.4% of total)
-- Pre-recorded: 131 (25.5% of total)
-- Text message: 94 (18.3% of total)

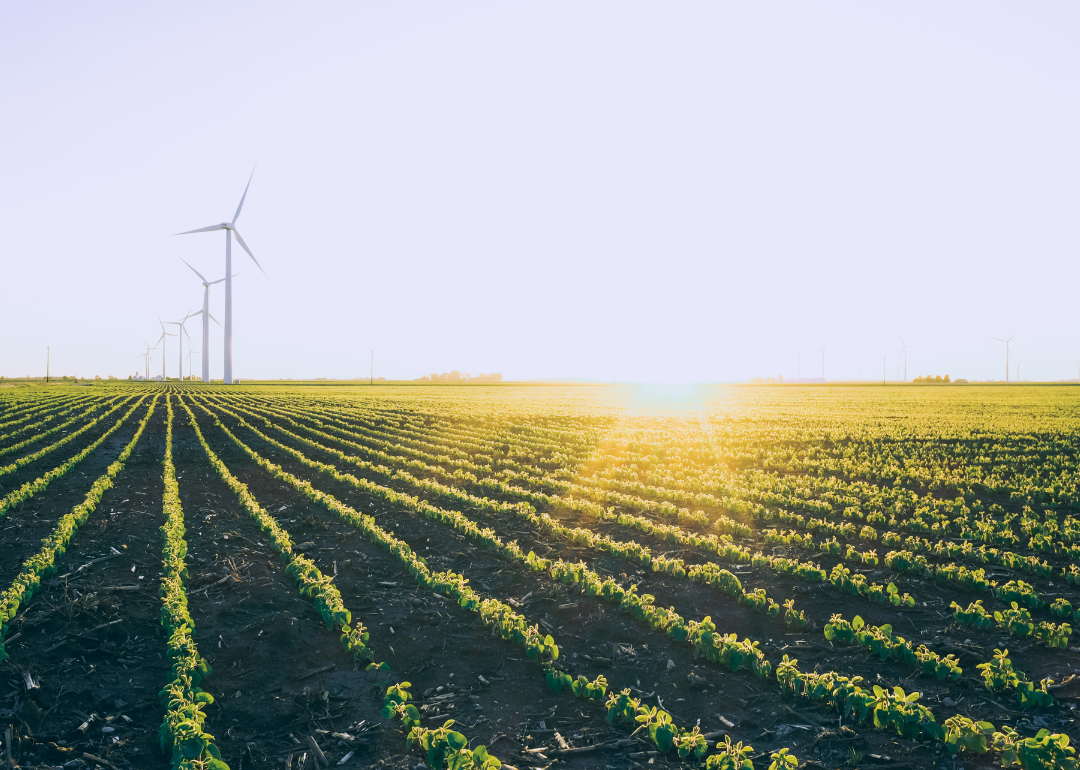
Soybean fields in Indiana at sunset.

Canva

15 / 51

#37. Indiana

- 9 spam calls reported for every 100,000 residents
- Total spam calls reported so far in 2023: 629
-- Live voice: 181 (28.8% of total)
-- Pre-recorded: 170 (27.0% of total)
-- Text message: 96 (15.3% of total)

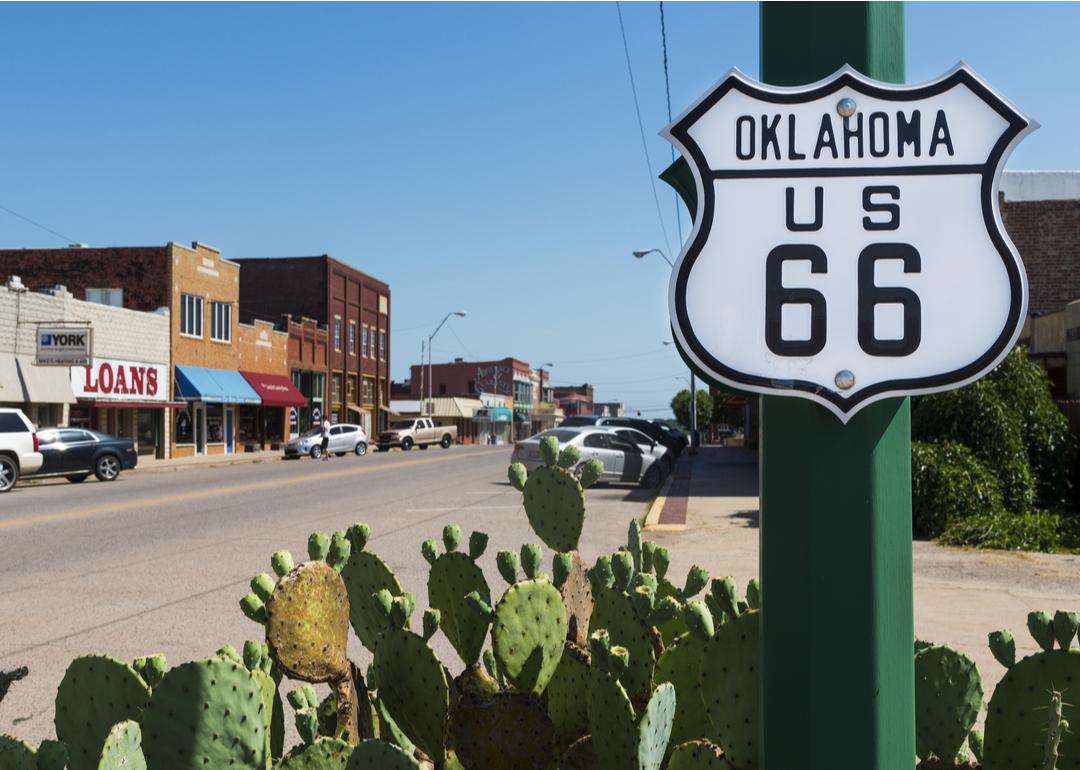
Buildings along US Route 66 in Oklahoma.

TLF Images // Shutterstock

16 / 51

#36. Oklahoma

- 9 spam calls reported for every 100,000 residents
- Total spam calls reported so far in 2023: 377
-- Live voice: 141 (37.4% of total)
-- Pre-recorded: 92 (24.4% of total)
-- Text message: 44 (11.7% of total)

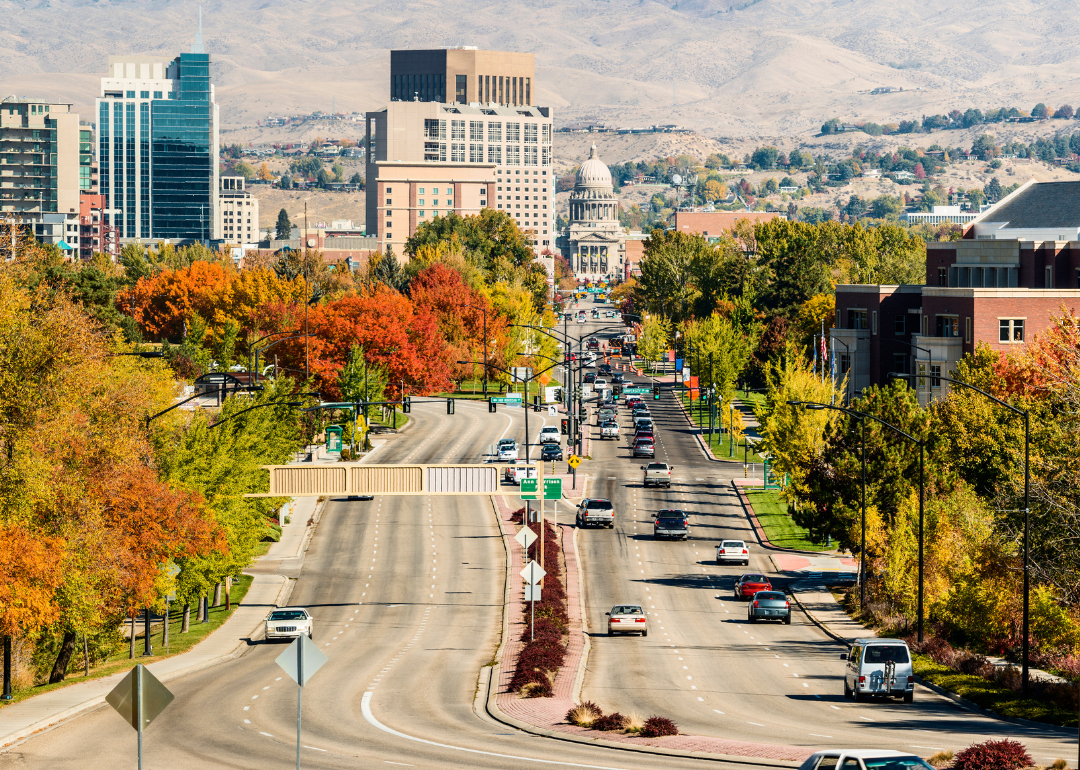
Cars driving down Capitol Boulevard in Boise.

Canva

17 / 51

#35. Idaho

- 10 spam calls reported for every 100,000 residents
- Total spam calls reported so far in 2023: 186
-- Live voice: 54 (29.0% of total)
-- Pre-recorded: 31 (16.7% of total)
-- Text message: 27 (14.5% of total)

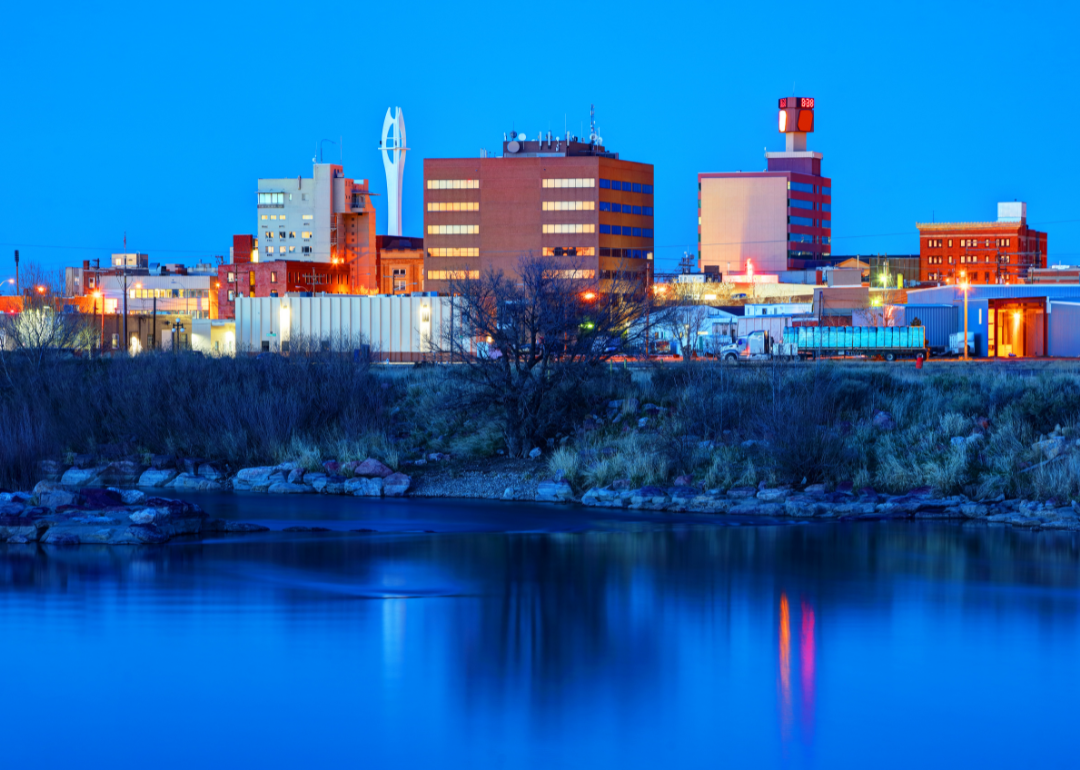
Buildings in Casper as seen at night.

Canva

18 / 51

#34. Wyoming

- 10 spam calls reported for every 100,000 residents
- Total spam calls reported so far in 2023: 57
-- Live voice: 14 (24.6% of total)
-- Pre-recorded: 7 (12.3% of total)
-- Text message: 27 (47.4% of total)

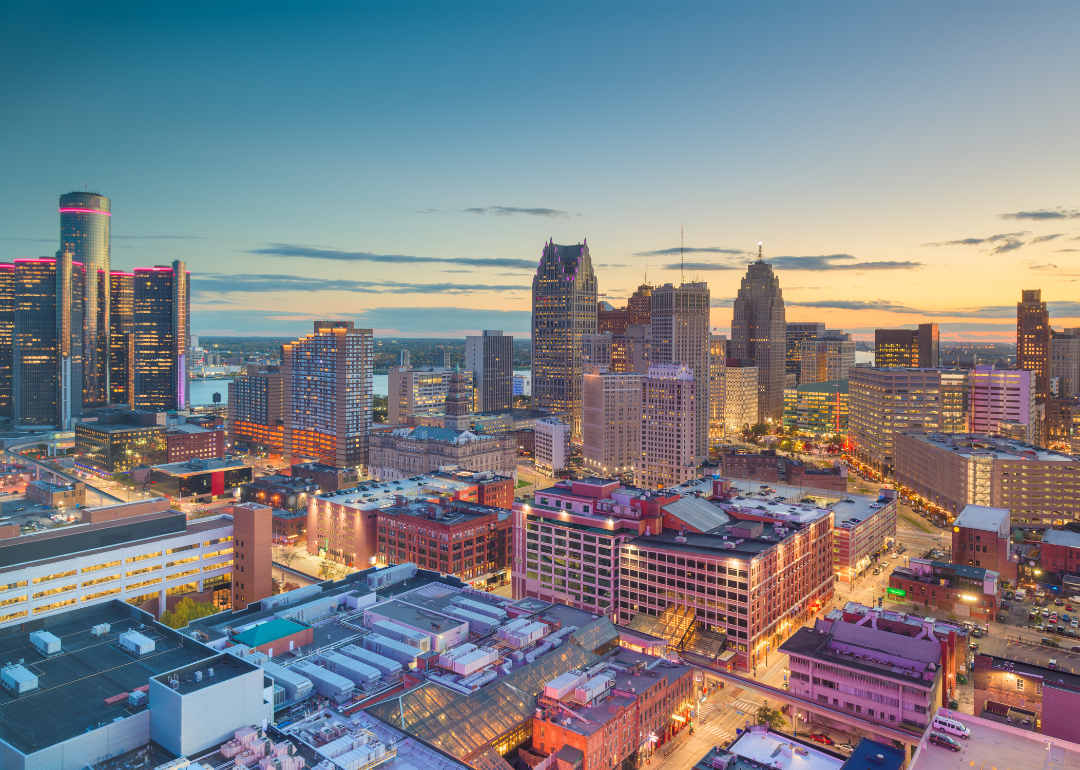
An aerial view of downtown Deroit at dusk.

Canva

19 / 51

#33. Michigan

- 10 spam calls reported for every 100,000 residents
- Total spam calls reported so far in 2023: 1,003
-- Live voice: 356 (35.5% of total)
-- Pre-recorded: 228 (22.7% of total)
-- Text message: 114 (11.4% of total)

An aerial view of Jersey City at sunset.

f11photo // Shutterstock

20 / 51

#32. New Jersey

- 10 spam calls reported for every 100,000 residents
- Total spam calls reported so far in 2023: 938
-- Live voice: 326 (34.8% of total)
-- Pre-recorded: 203 (21.6% of total)
-- Text message: 94 (10.0% of total)

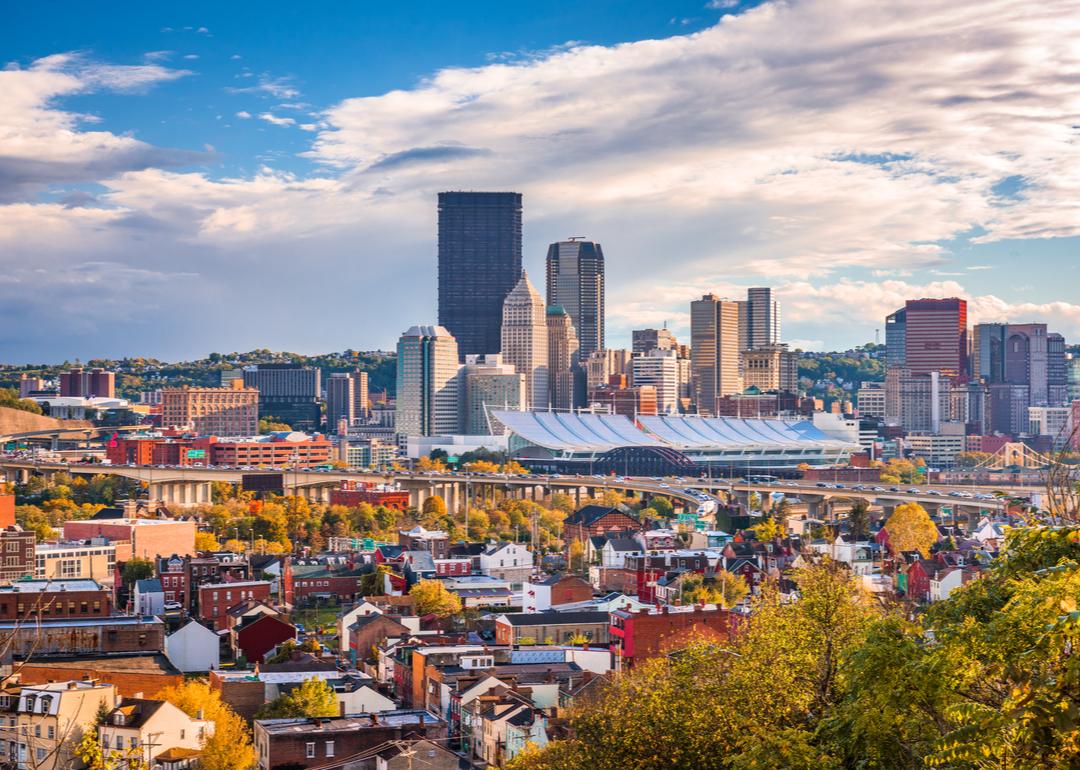
The Pittsburgh skyline as viewed from the hills.

Sean Pavone // Shutterstock

21 / 51

#31. Pennsylvania

- 10 spam calls reported for every 100,000 residents
- Total spam calls reported so far in 2023: 1,356
-- Live voice: 450 (33.2% of total)
-- Pre-recorded: 437 (32.2% of total)
-- Text message: 125 (9.2% of total)

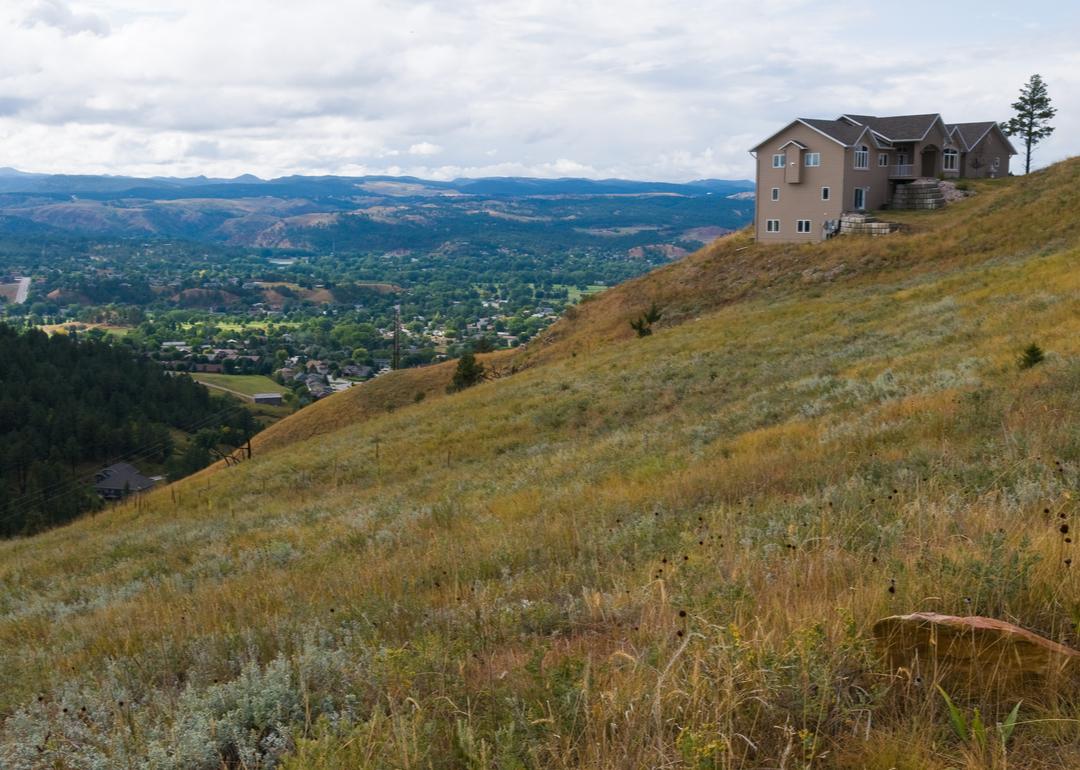
The western suburbs of Rapid City.

Hank Shiffman // Shutterstock

22 / 51

#30. South Dakota

- 11 spam calls reported for every 100,000 residents
- Total spam calls reported so far in 2023: 96
-- Live voice: 31 (32.3% of total)
-- Pre-recorded: 31 (32.3% of total)
-- Text message: 8 (8.3% of total)

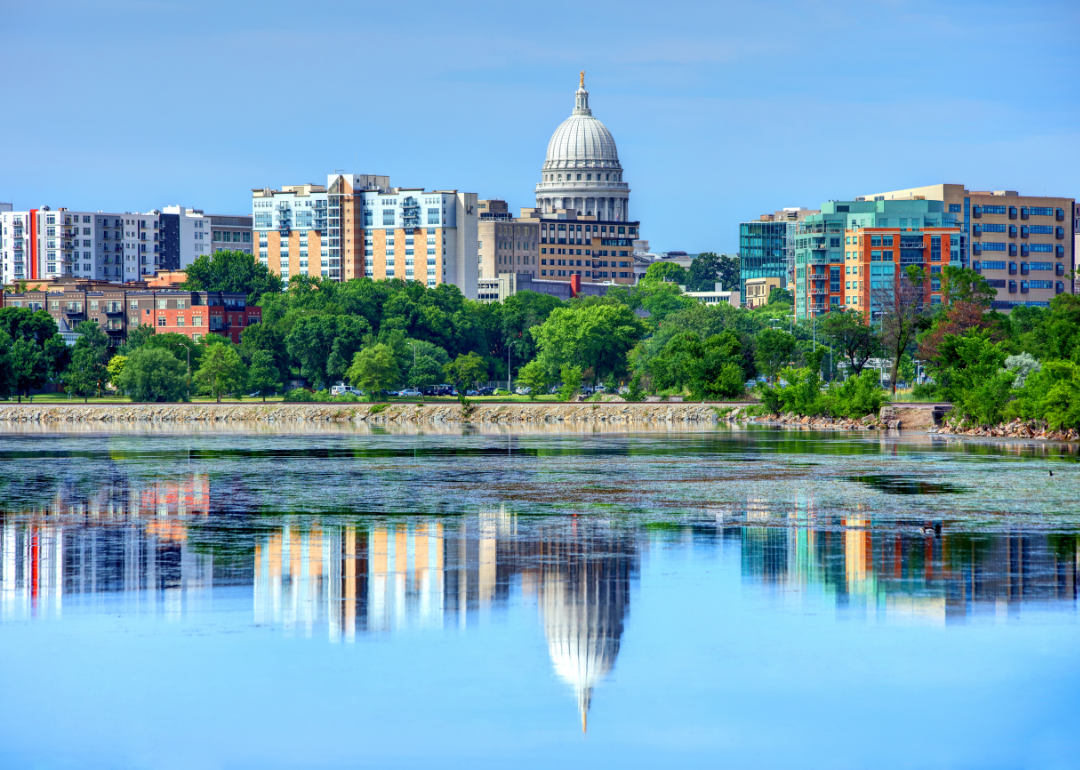
Madison as viewed from across the water on a bright, sunny day.

Canva

23 / 51

#29. Wisconsin

- 11 spam calls reported for every 100,000 residents
- Total spam calls reported so far in 2023: 632
-- Live voice: 146 (23.1% of total)
-- Pre-recorded: 243 (38.4% of total)
-- Text message: 75 (11.9% of total)

A night view of buildings along a river in Wichita.

Canva

24 / 51

#28. Kansas

- 11 spam calls reported for every 100,000 residents
- Total spam calls reported so far in 2023: 317
-- Live voice: 123 (38.8% of total)
-- Pre-recorded: 98 (30.9% of total)
-- Text message: 23 (7.3% of total)

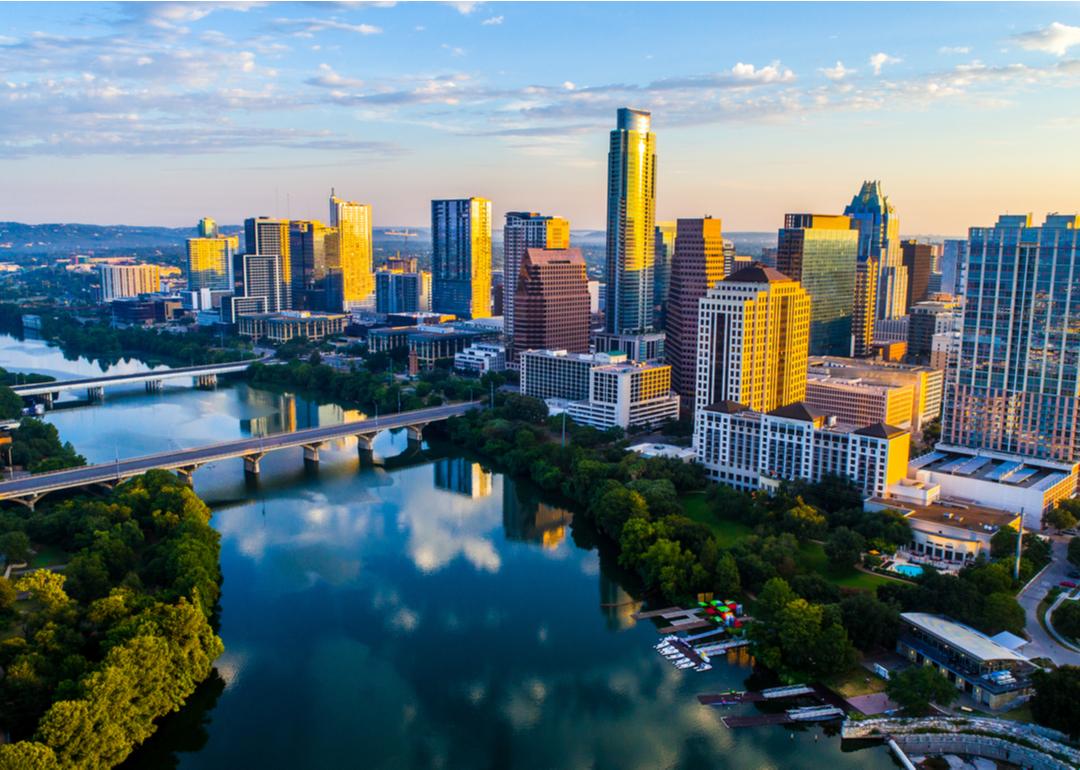
An aerial view of Austin and Lady Bird Lake.

Roschetzky Photography // Shutterstock

25 / 51

#27. Texas

- 11 spam calls reported for every 100,000 residents
- Total spam calls reported so far in 2023: 3,340
-- Live voice: 1127 (33.7% of total)
-- Pre-recorded: 825 (24.7% of total)
-- Text message: 388 (11.6% of total)

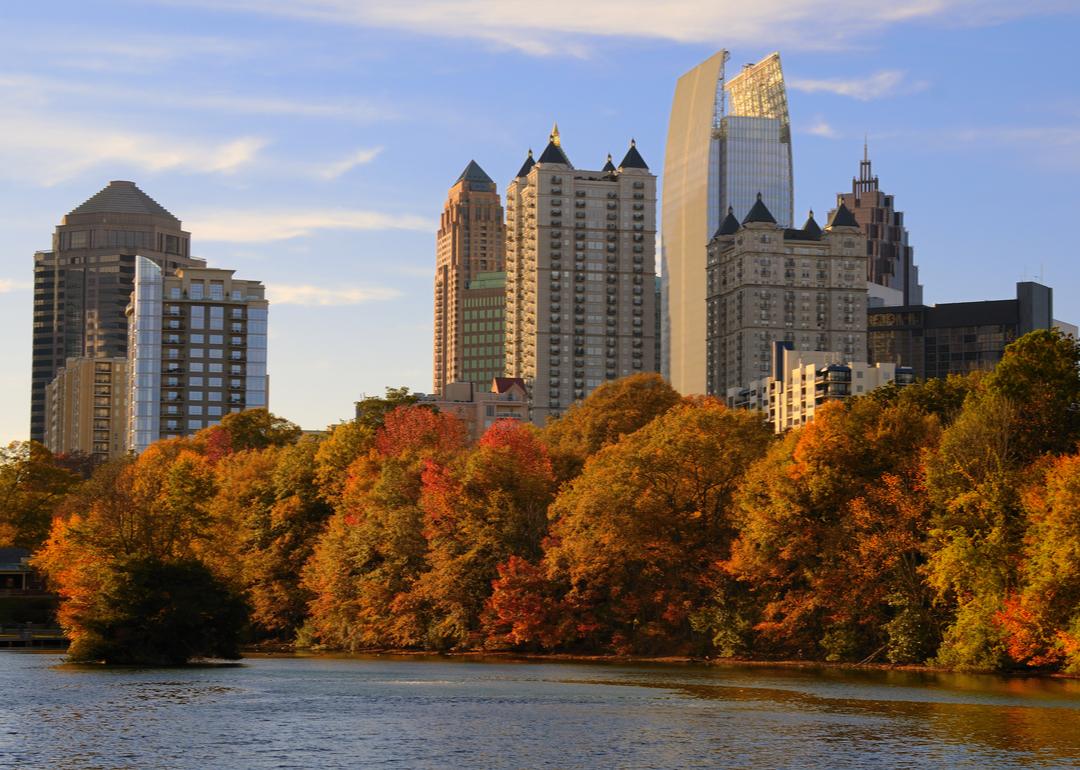
A view of Atlanta's skyline from Lake Meer in Piedmont Park.

ESB Professional // Shutterstock

26 / 51

#26. Georgia

- 11 spam calls reported for every 100,000 residents
- Total spam calls reported so far in 2023: 1,218
-- Live voice: 362 (29.7% of total)
-- Pre-recorded: 307 (25.2% of total)
-- Text message: 146 (12.0% of total)

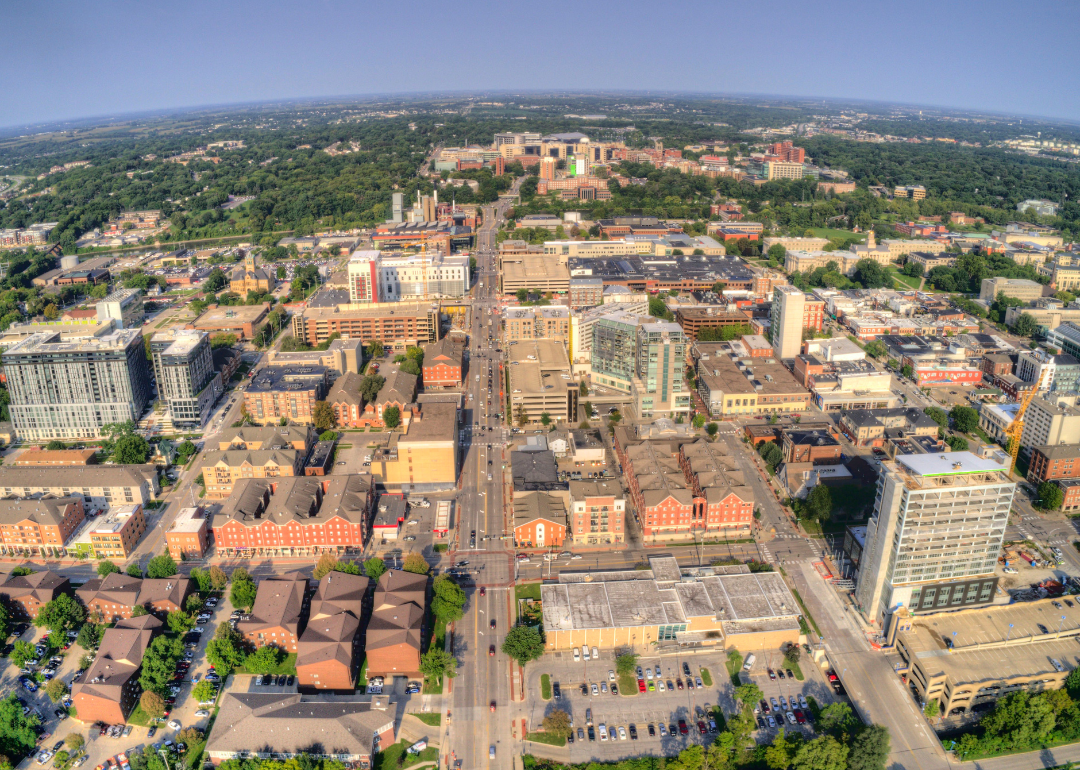
An aerial view of Iowa City on a sunny day.

Canva

27 / 51

#25. Iowa

- 11 spam calls reported for every 100,000 residents
- Total spam calls reported so far in 2023: 359
-- Live voice: 75 (20.9% of total)
-- Pre-recorded: 167 (46.5% of total)
-- Text message: 44 (12.3% of total)

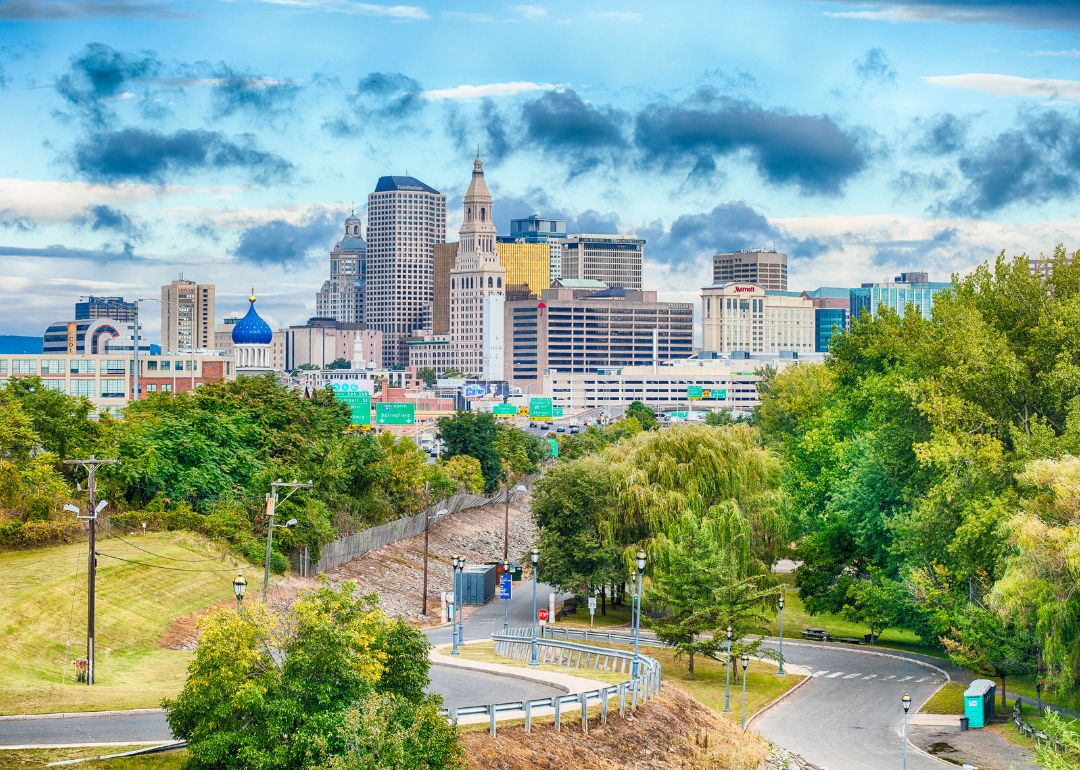
Hartford's skyline as seen from a distance.

Canva

28 / 51

#24. Connecticut

- 11 spam calls reported for every 100,000 residents
- Total spam calls reported so far in 2023: 408
-- Live voice: 124 (30.4% of total)
-- Pre-recorded: 144 (35.3% of total)
-- Text message: 31 (7.6% of total)

The river leading into Columbus at night.

Canva

29 / 51

#23. Ohio

- 11 spam calls reported for every 100,000 residents
- Total spam calls reported so far in 2023: 1,340
-- Live voice: 428 (31.9% of total)
-- Pre-recorded: 393 (29.3% of total)
-- Text message: 138 (10.3% of total)

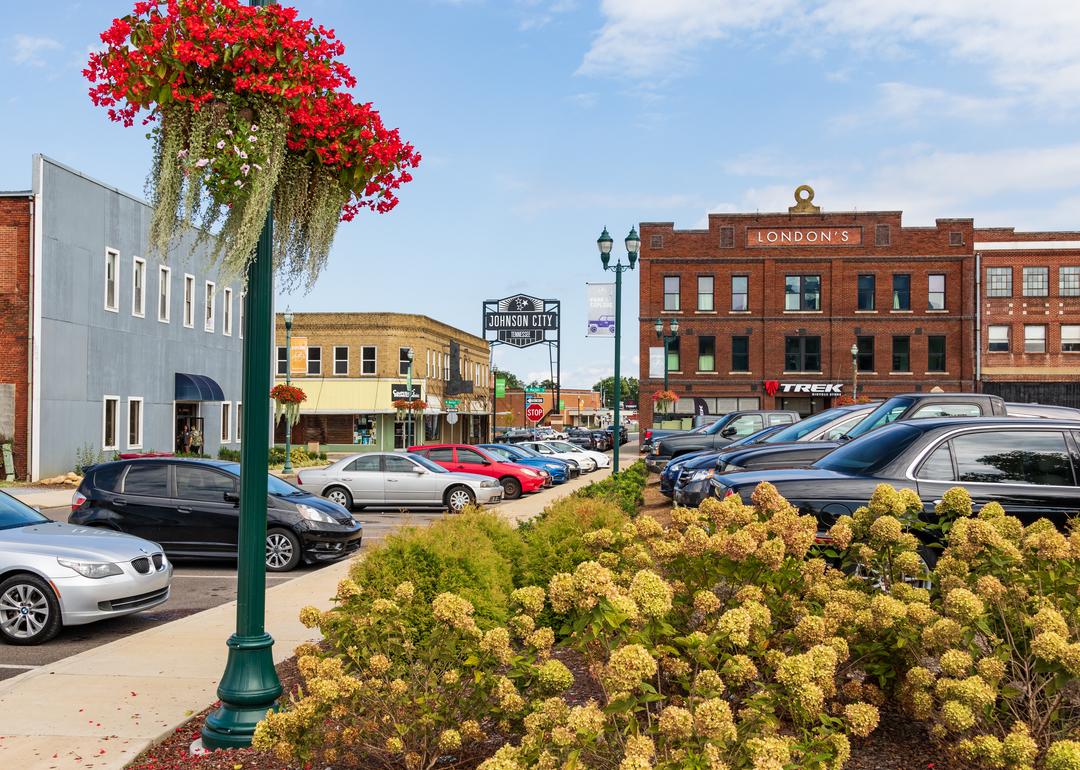
Cars parked along the street in Johnson City.

Nolichuckyjake // Shutterstock

30 / 51

#22. Tennessee

- 11 spam calls reported for every 100,000 residents
- Total spam calls reported so far in 2023: 805
-- Live voice: 264 (32.8% of total)
-- Pre-recorded: 217 (27.0% of total)
-- Text message: 86 (10.7% of total)

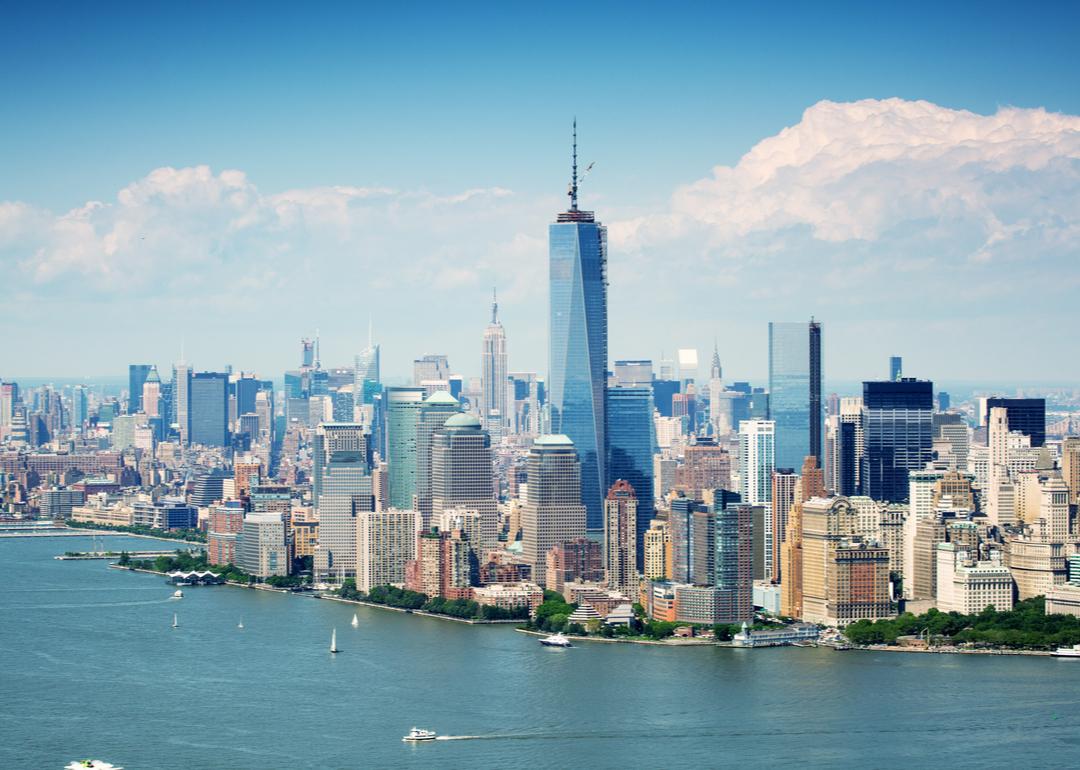
A cityscape view of Lower Manhattan in New York CIty.

GagliardiPhotography // Shutterstock

31 / 51

#21. New York

- 12 spam calls reported for every 100,000 residents
- Total spam calls reported so far in 2023: 2,324
-- Live voice: 591 (25.4% of total)
-- Pre-recorded: 770 (33.1% of total)
-- Text message: 192 (8.3% of total)

Downtown Louisville as seen at night.

Canva

32 / 51

#20. Kentucky

- 12 spam calls reported for every 100,000 residents
- Total spam calls reported so far in 2023: 533
-- Live voice: 237 (44.5% of total)
-- Pre-recorded: 110 (20.6% of total)
-- Text message: 89 (16.7% of total)

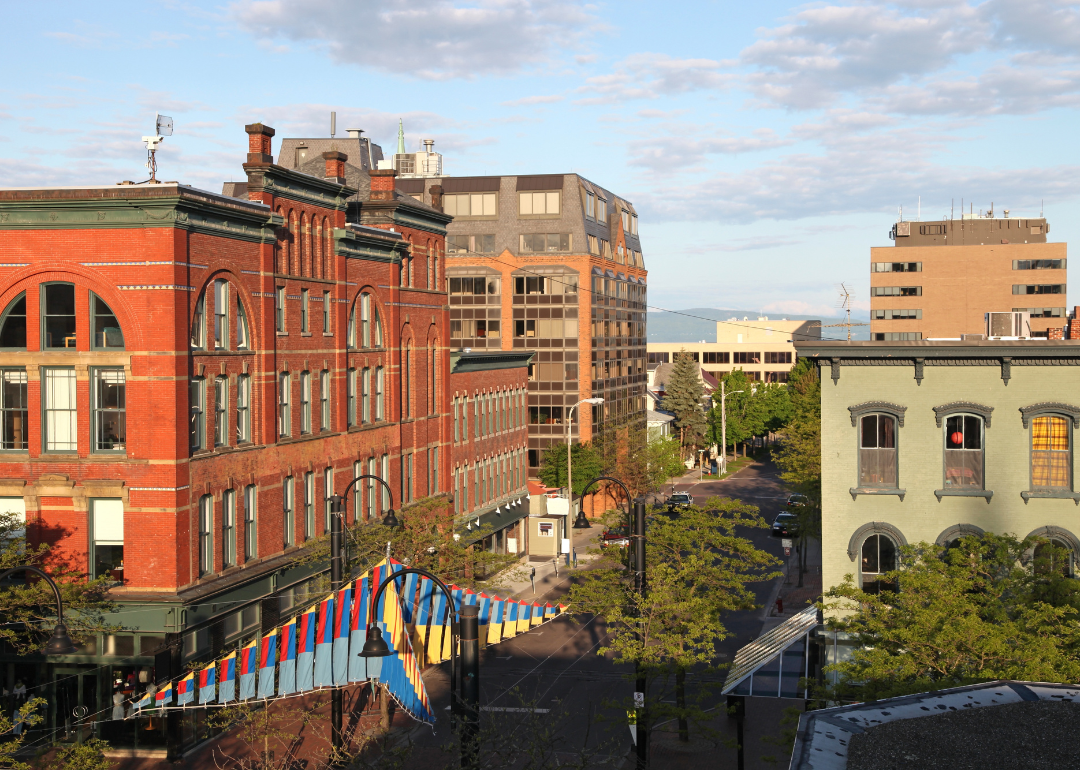
Buildings lining a street in downtown Burlington.

Canva

33 / 51

#19. Vermont

- 12 spam calls reported for every 100,000 residents
- Total spam calls reported so far in 2023: 77
-- Live voice: 24 (31.2% of total)
-- Pre-recorded: 31 (40.3% of total)
-- Text message: 3 (3.9% of total)

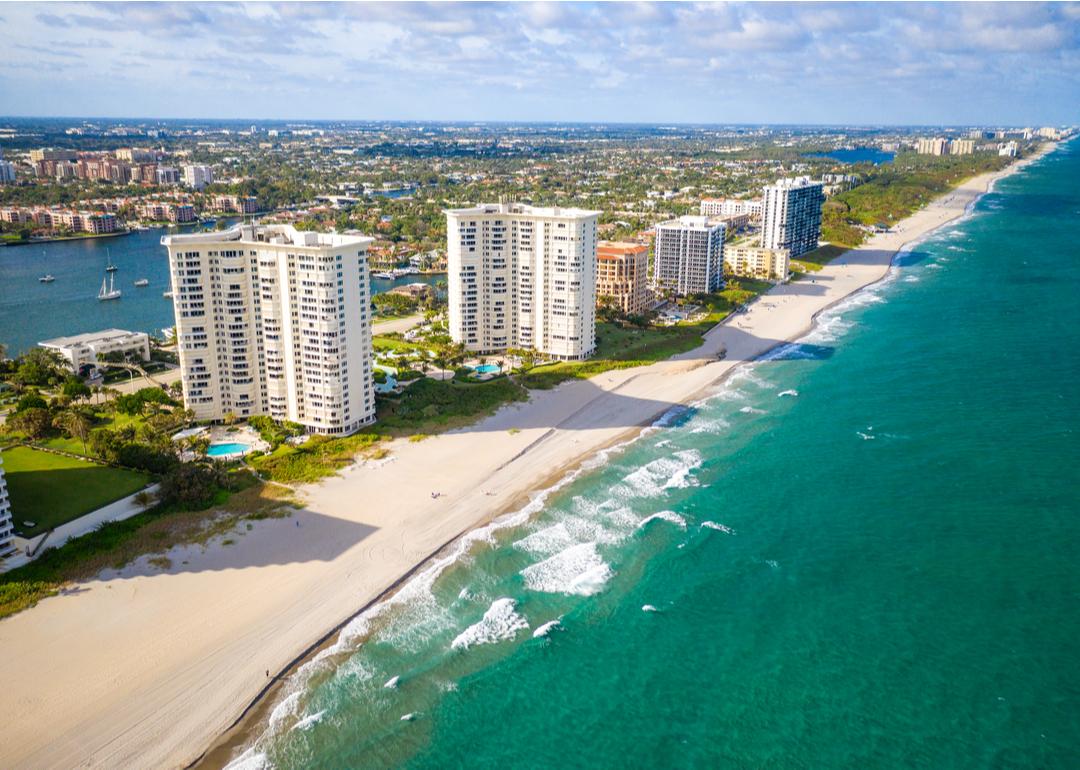
An aerial view of Boca Raton's coastline.

FotosForTheFuture // Shutterstock

34 / 51

#18. Florida

- 12 spam calls reported for every 100,000 residents
- Total spam calls reported so far in 2023: 2,701
-- Live voice: 847 (31.4% of total)
-- Pre-recorded: 702 (26.0% of total)
-- Text message: 310 (11.5% of total)

The skyline in downtown Manchester at dusk.

Canva

35 / 51

#17. New Hampshire

- 12 spam calls reported for every 100,000 residents
- Total spam calls reported so far in 2023: 170
-- Live voice: 48 (28.2% of total)
-- Pre-recorded: 51 (30.0% of total)
-- Text message: 25 (14.7% of total)

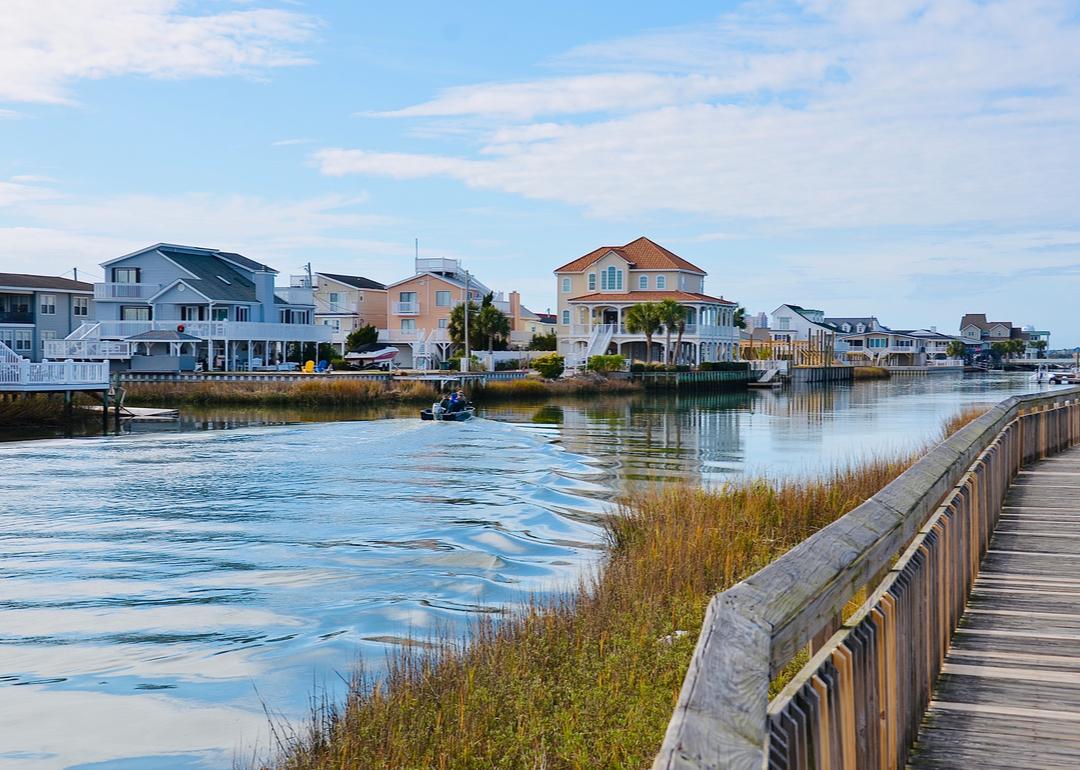
The scenic river view and waterfront houses in North Myrtle Beach.

PQK // Shutterstock

36 / 51

#16. South Carolina

- 13 spam calls reported for every 100,000 residents
- Total spam calls reported so far in 2023: 672
-- Live voice: 207 (30.8% of total)
-- Pre-recorded: 187 (27.8% of total)
-- Text message: 81 (12.1% of total)

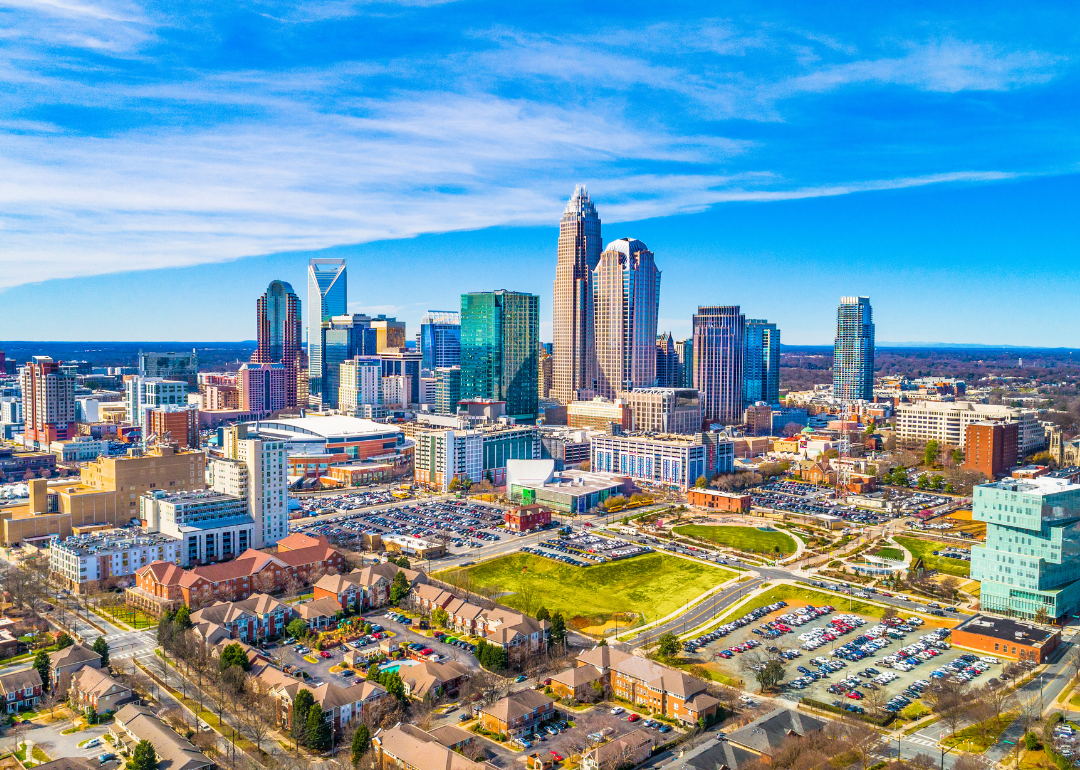
An aerial view of Charlotte on a sunny day.

Canva

37 / 51

#15. North Carolina

- 13 spam calls reported for every 100,000 residents
- Total spam calls reported so far in 2023: 1,362
-- Live voice: 405 (29.7% of total)
-- Pre-recorded: 310 (22.8% of total)
-- Text message: 178 (13.1% of total)

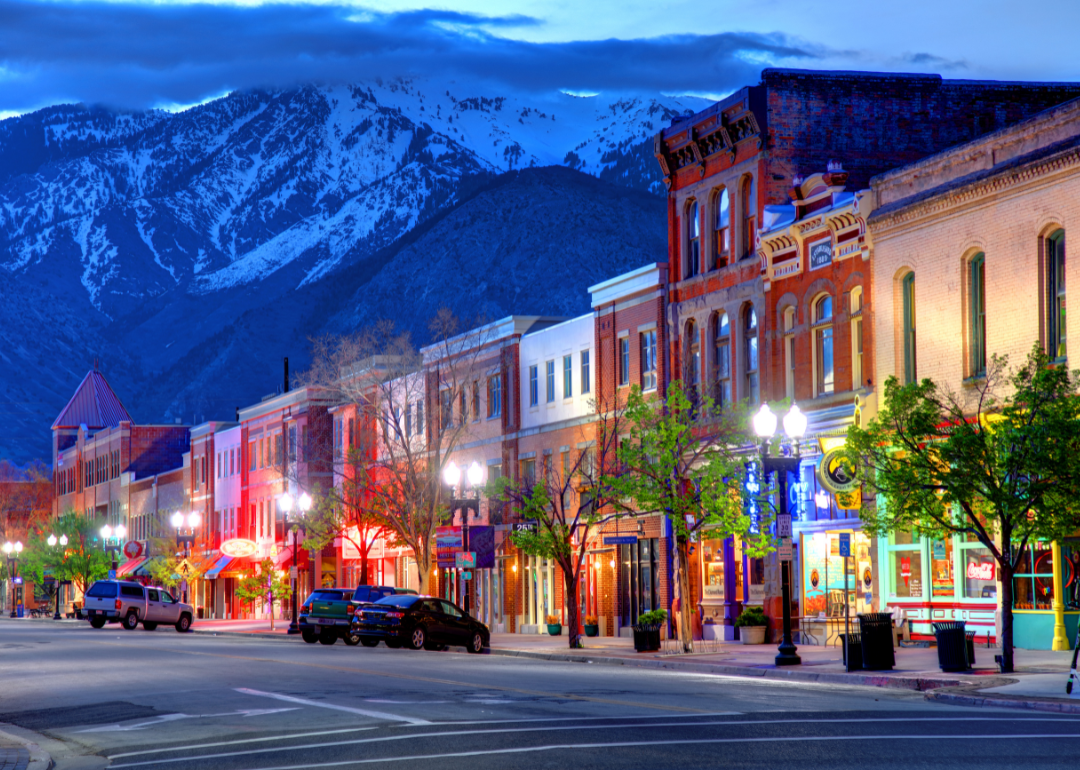
Downtown Ogden as seen at night.

Canva

38 / 51

#14. Utah

- 13 spam calls reported for every 100,000 residents
- Total spam calls reported so far in 2023: 431
-- Live voice: 137 (31.8% of total)
-- Pre-recorded: 146 (33.9% of total)
-- Text message: 54 (12.5% of total)

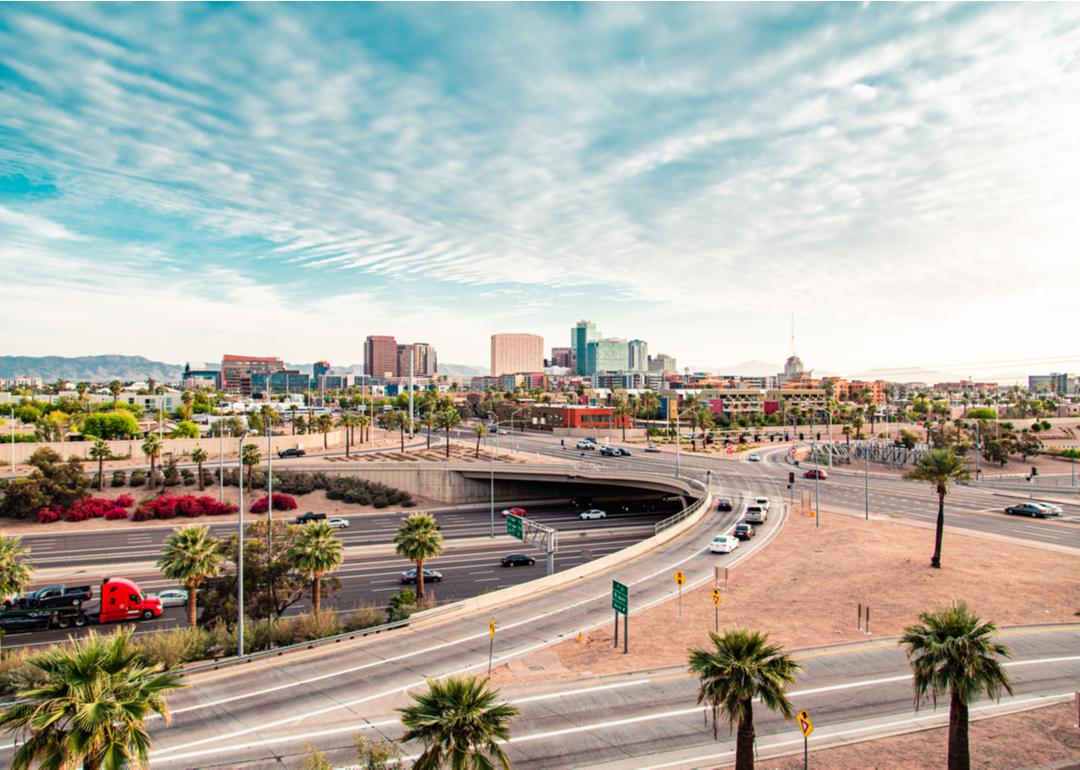
A highway leading into downtown Phoenix.

Brandon Burris // Shutterstock

39 / 51

#13. Arizona

- 14 spam calls reported for every 100,000 residents
- Total spam calls reported so far in 2023: 997
-- Live voice: 313 (31.4% of total)
-- Pre-recorded: 259 (26.0% of total)
-- Text message: 148 (14.8% of total)

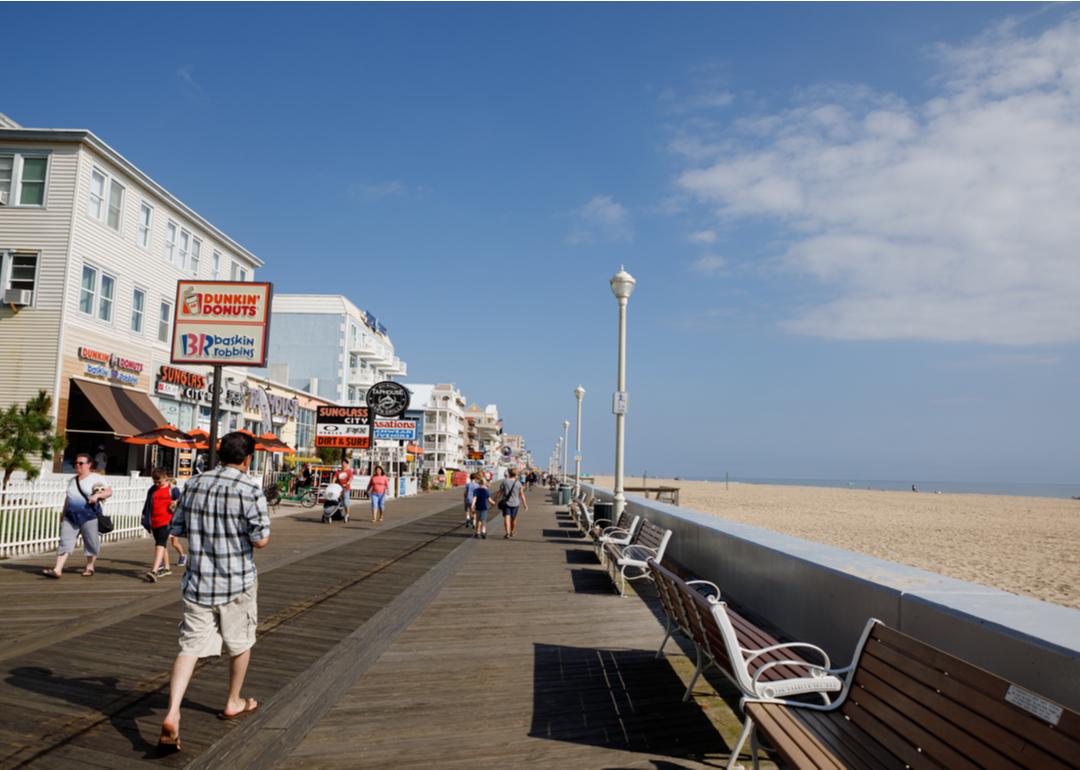
Pedestrians strolling on a boardwalk in Ocean City.

eurobanks // Shutterstock

40 / 51

#12. Maryland

- 14 spam calls reported for every 100,000 residents
- Total spam calls reported so far in 2023: 872
-- Live voice: 304 (34.9% of total)
-- Pre-recorded: 206 (23.6% of total)
-- Text message: 136 (15.6% of total)

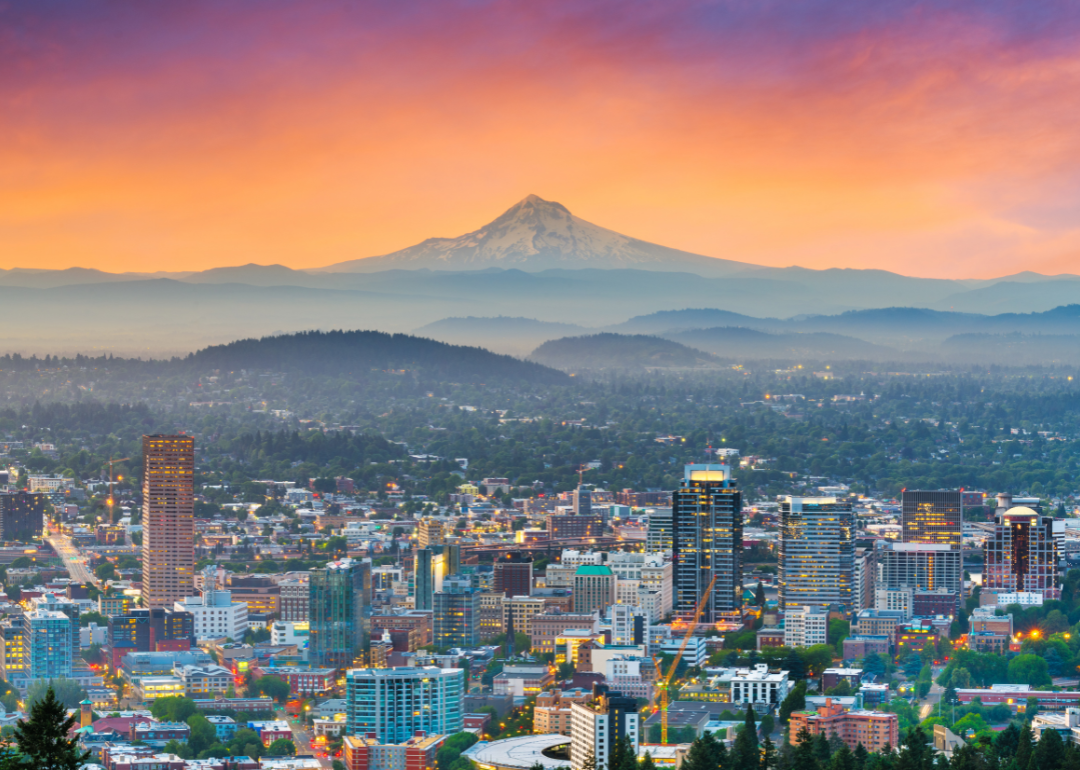
Portland at sunset with a mountain in the background.

Canva

41 / 51

#11. Oregon

- 14 spam calls reported for every 100,000 residents
- Total spam calls reported so far in 2023: 607
-- Live voice: 193 (31.8% of total)
-- Pre-recorded: 221 (36.4% of total)
-- Text message: 69 (11.4% of total)

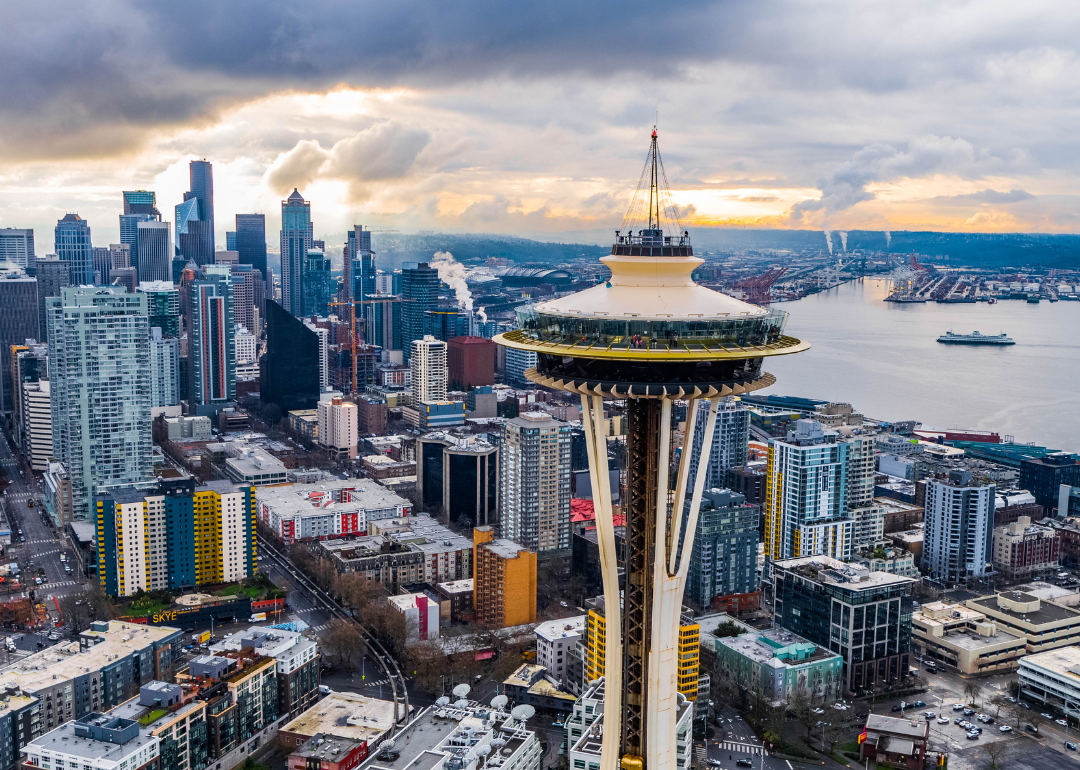
An aerial view of Seattle with the Space Needle in the foreground.

Canva

42 / 51

#10. Washington

- 14 spam calls reported for every 100,000 residents
- Total spam calls reported so far in 2023: 1,128
-- Live voice: 375 (33.2% of total)
-- Pre-recorded: 363 (32.2% of total)
-- Text message: 139 (12.3% of total)

The skyline of Richmond at sunset.

Canva

43 / 51

#9. Virginia

- 15 spam calls reported for every 100,000 residents
- Total spam calls reported so far in 2023: 1,284
-- Live voice: 417 (32.5% of total)
-- Pre-recorded: 354 (27.6% of total)
-- Text message: 180 (14.0% of total)

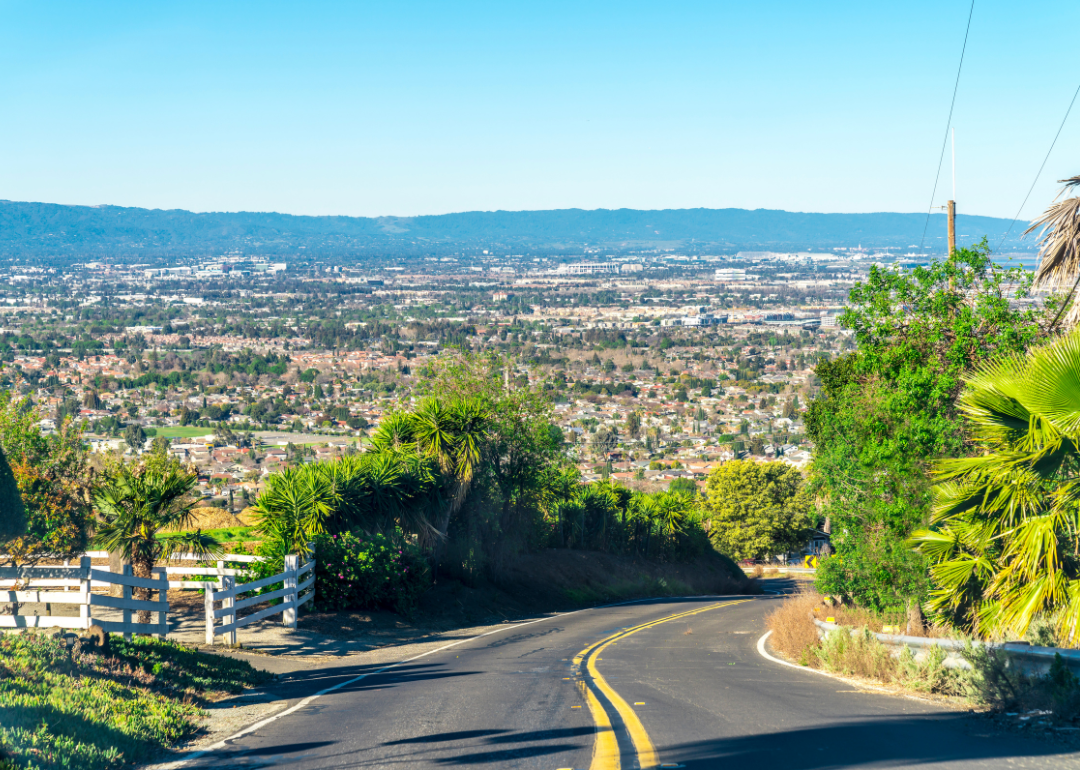
A road leading into Silicon Valley.

Canva

44 / 51

#8. California

- 15 spam calls reported for every 100,000 residents
- Total spam calls reported so far in 2023: 5,834
-- Live voice: 1893 (32.4% of total)
-- Pre-recorded: 2081 (35.7% of total)
-- Text message: 561 (9.6% of total)

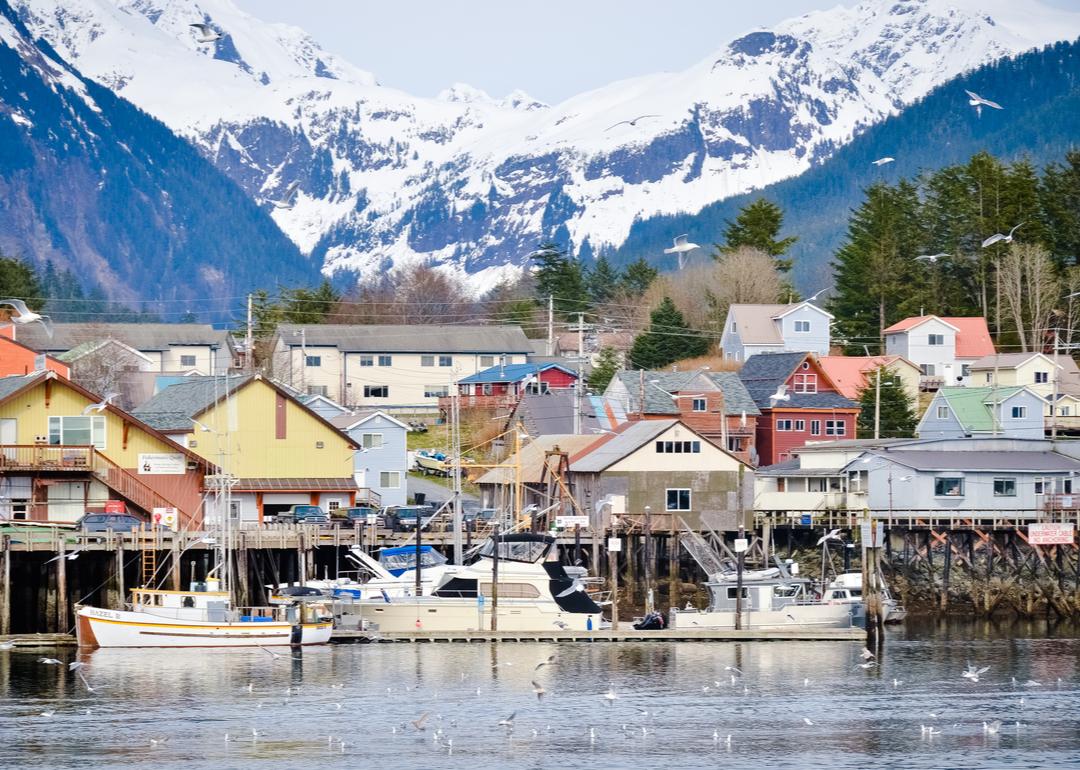
Boats and buildings in Sitka.

Marc Cappelletti // Shutterstock

45 / 51

#7. Alaska

- 15 spam calls reported for every 100,000 residents
- Total spam calls reported so far in 2023: 110
-- Live voice: 29 (26.4% of total)
-- Pre-recorded: 49 (44.5% of total)
-- Text message: 10 (9.1% of total)

An aerial view of downtown Boston at dusk.

Canva

46 / 51

#6. Massachusetts

- 15 spam calls reported for every 100,000 residents
- Total spam calls reported so far in 2023: 1,080
-- Live voice: 354 (32.8% of total)
-- Pre-recorded: 455 (42.1% of total)
-- Text message: 62 (5.7% of total)

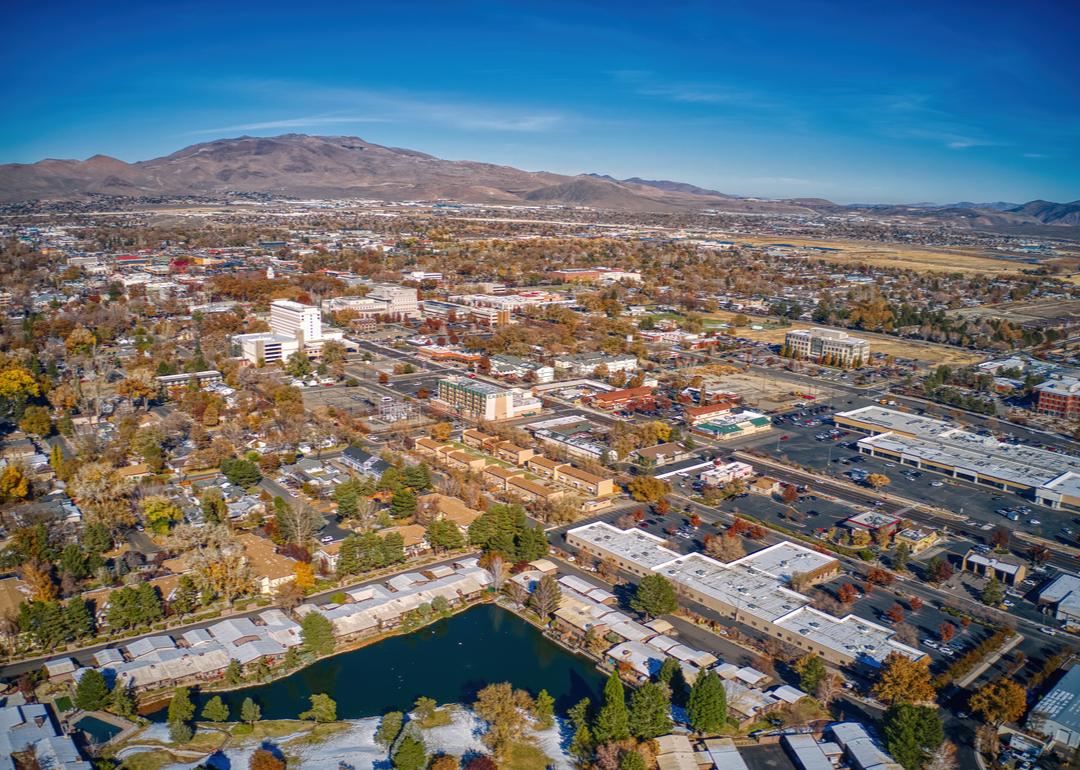
An aerial View of Carson City.

Jacob Boomsma // Shutterstock

47 / 51

#5. Nevada

- 18 spam calls reported for every 100,000 residents
- Total spam calls reported so far in 2023: 563
-- Live voice: 222 (39.4% of total)
-- Pre-recorded: 158 (28.1% of total)
-- Text message: 41 (7.3% of total)

The waterfront with ferry's docked in Portland.

Canva

48 / 51

#4. Maine

- 18 spam calls reported for every 100,000 residents
- Total spam calls reported so far in 2023: 255
-- Live voice: 123 (48.2% of total)
-- Pre-recorded: 56 (22.0% of total)
-- Text message: 17 (6.7% of total)

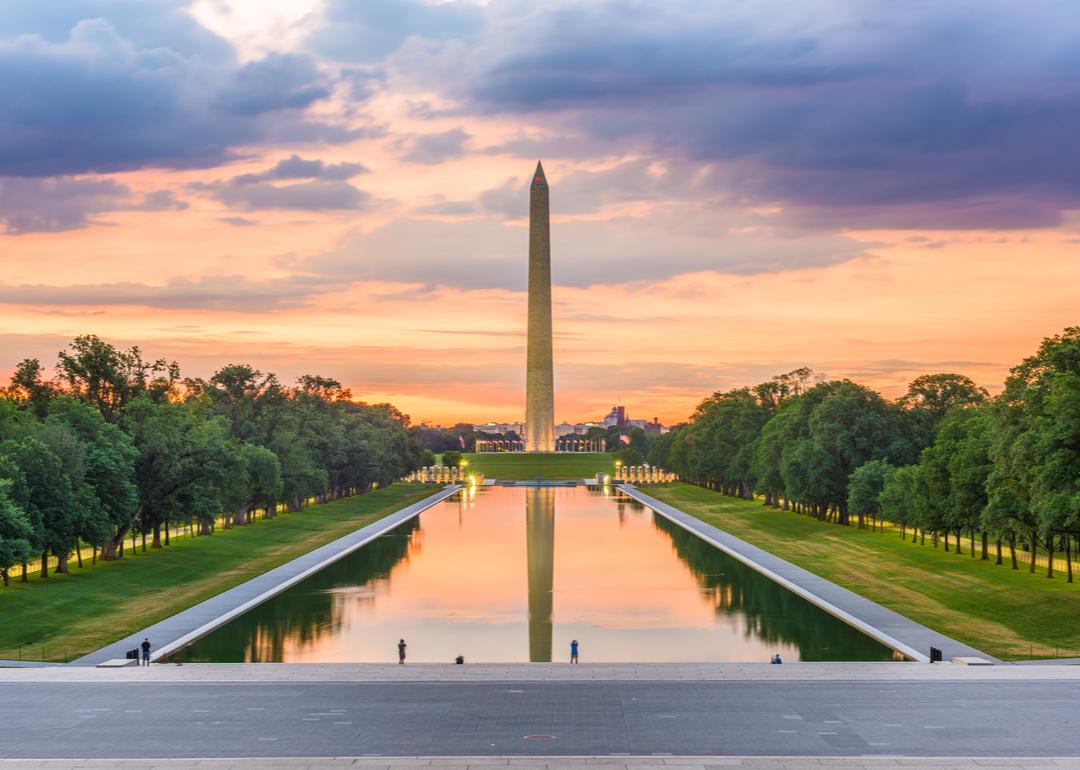
The Washington Monument and Reflecting Pool.

Sean Pavone // Shutterstock

49 / 51

#3. Washington DC

- 20 spam calls reported for every 100,000 residents
- Total spam calls reported so far in 2023: 134
-- Live voice: 33 (24.6% of total)
-- Pre-recorded: 45 (33.6% of total)
-- Text message: 23 (17.2% of total)

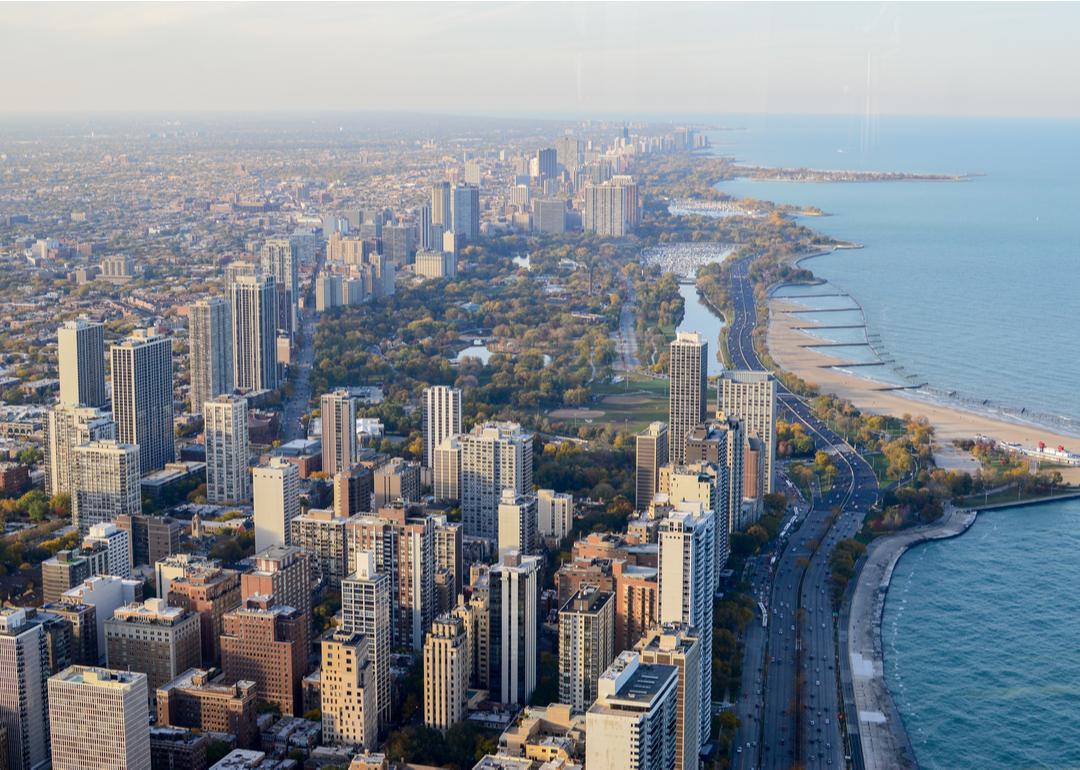
Skyscrapers and Lake Michigan in Chicago.

DiegoMariottini // Shutterstock

50 / 51

#2. Illinois

- 20 spam calls reported for every 100,000 residents
- Total spam calls reported so far in 2023: 2,512
-- Live voice: 964 (38.4% of total)
-- Pre-recorded: 1003 (39.9% of total)
-- Text message: 161 (6.4% of total)

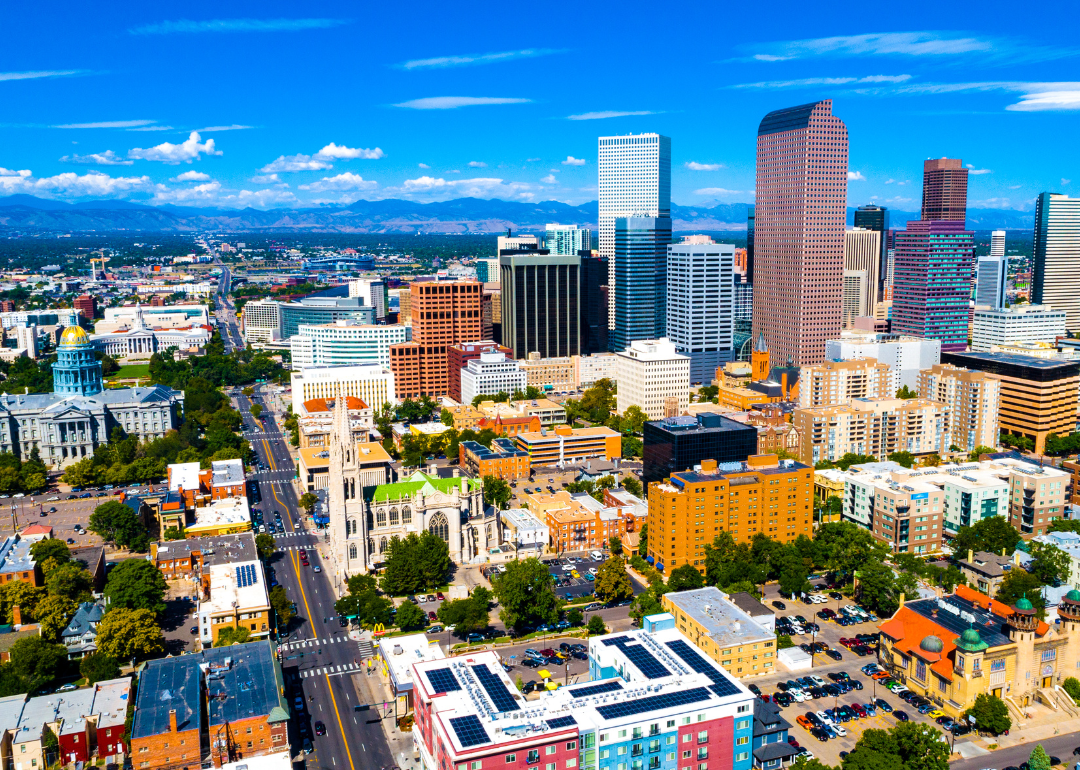
An aerial view of downtown Denver on a sunny day.

Canva

51 / 51

#1. Colorado

- 22 spam calls reported for every 100,000 residents
- Total spam calls reported so far in 2023: 1,272
-- Live voice: 500 (39.3% of total)
-- Pre-recorded: 376 (29.6% of total)
-- Text message: 155 (12.2% of total)

Data reporting by Elena Cox. Story editing by Jeff Inglis. Copy editing by Kristen Wegrzyn. Photo selection by Abigail Renaud.