Cities with the fastest-growing home prices in Montana
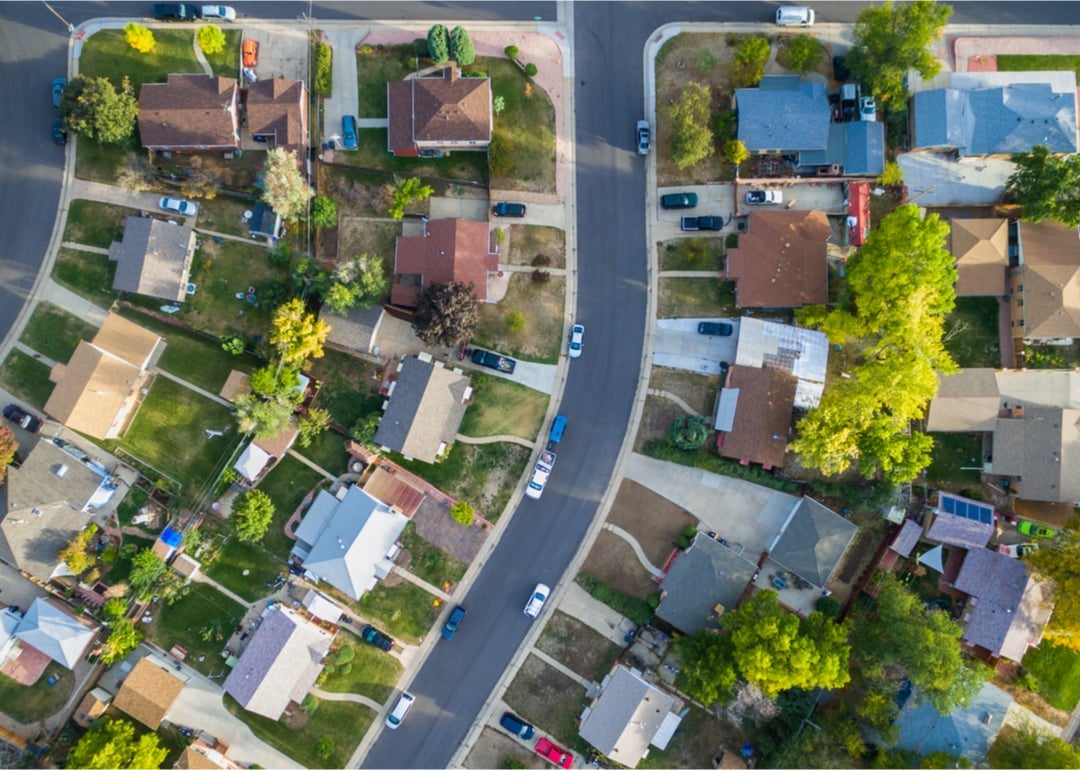
The real estate frenzy spurred by the coronavirus pandemic continues, though at a slower pace. Buyers are still competing for a limited supply of housing, driving up prices for affordable properties.
The typical home value in the United States was $356,776 in January, 2.6% higher than the year before.
Increasing mortgage rates have slowed growth, with prices even declining in some places. But some areas are still seeing price jumps compared to the year before.
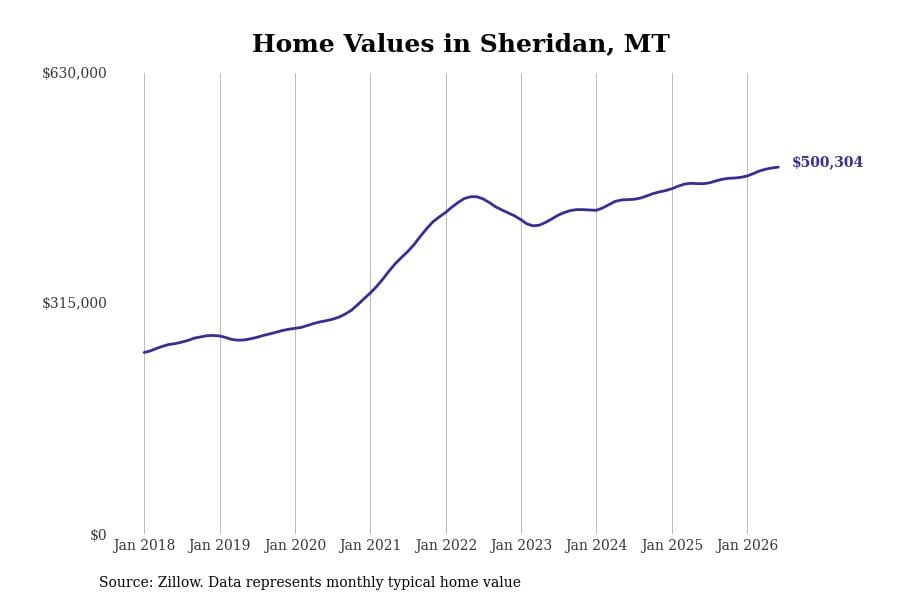
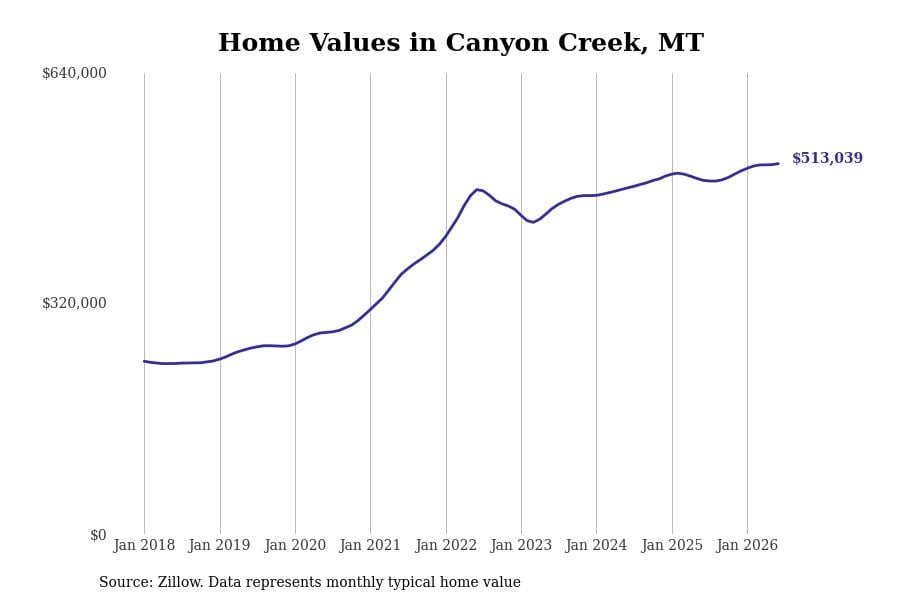
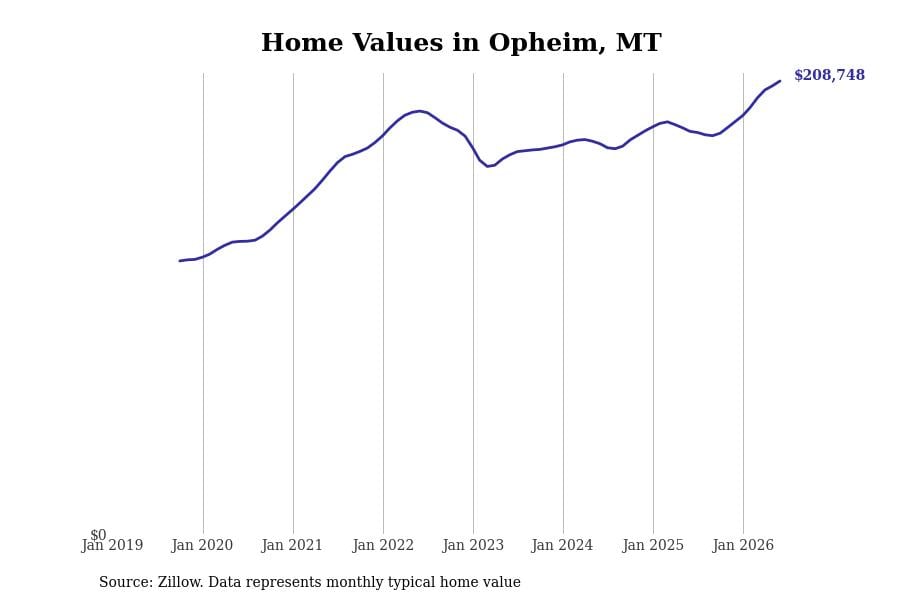
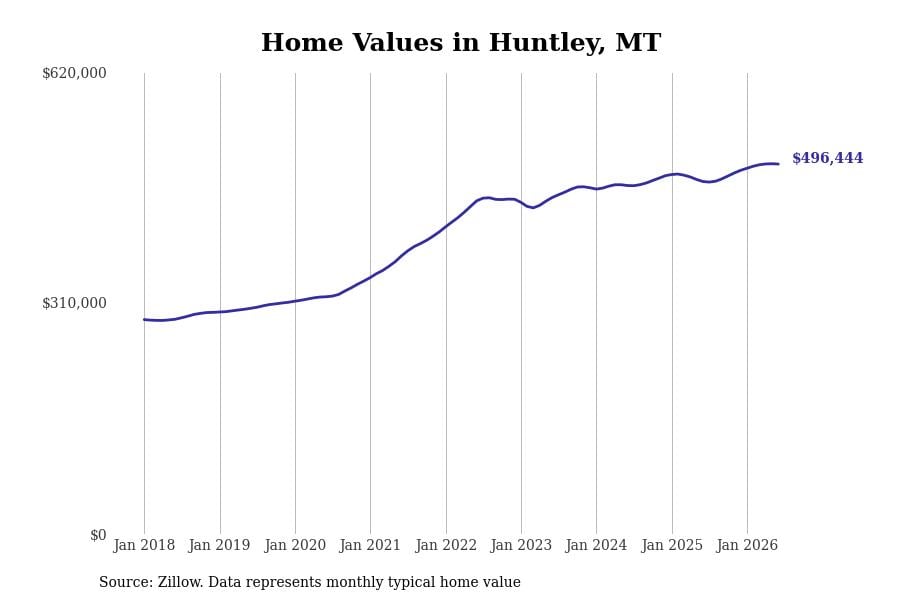
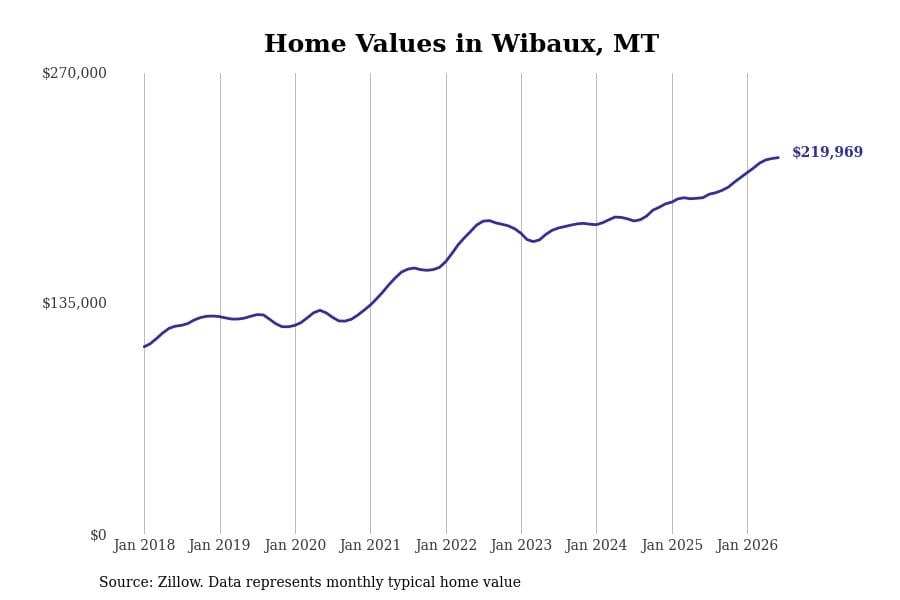
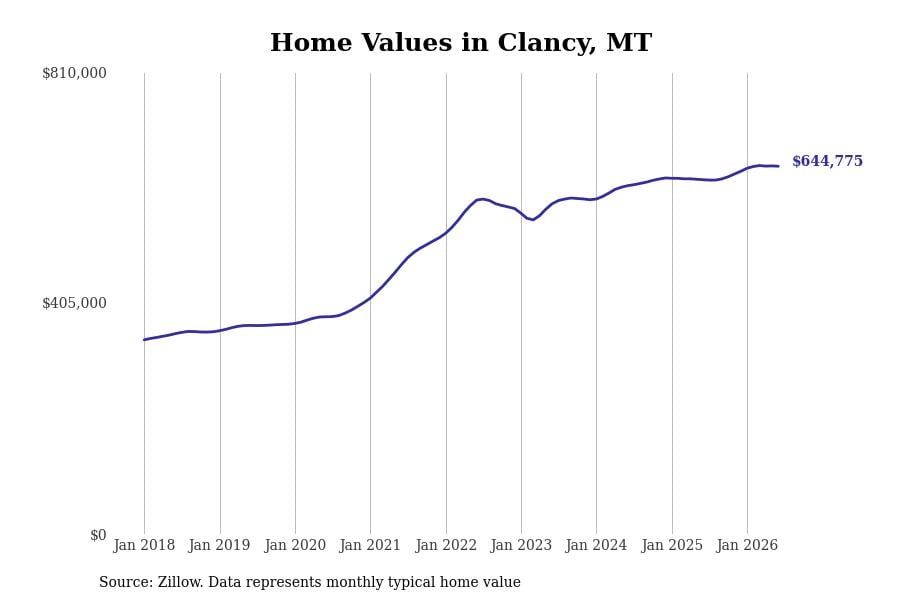
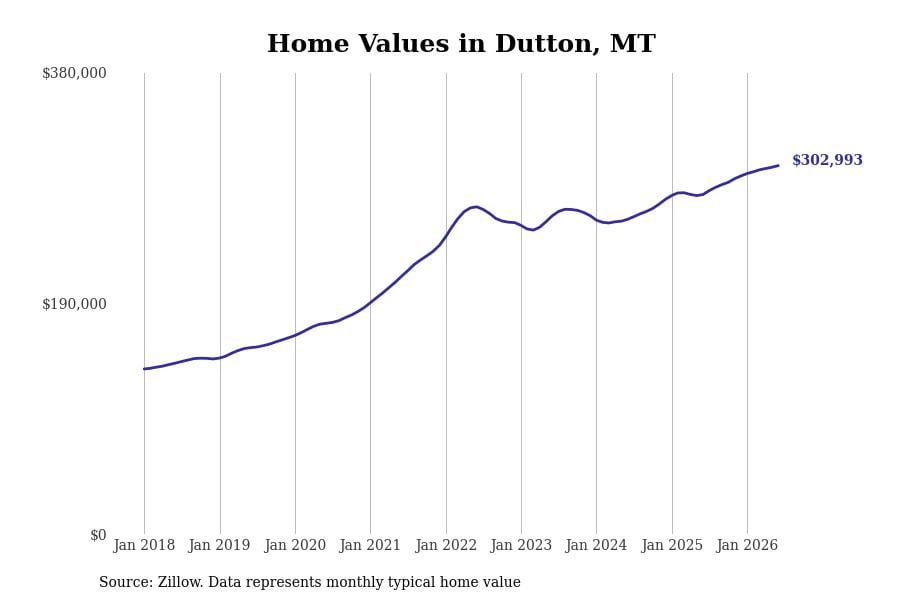
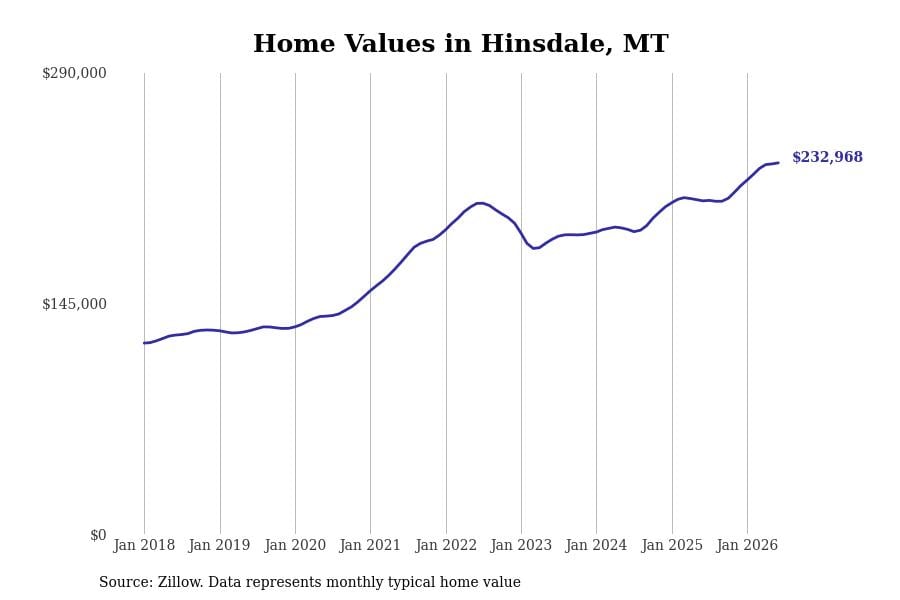
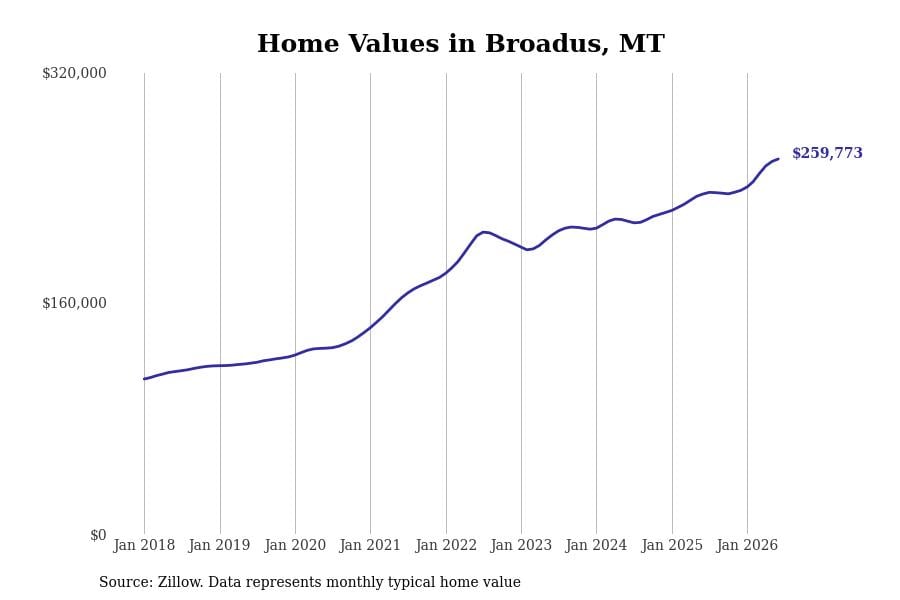
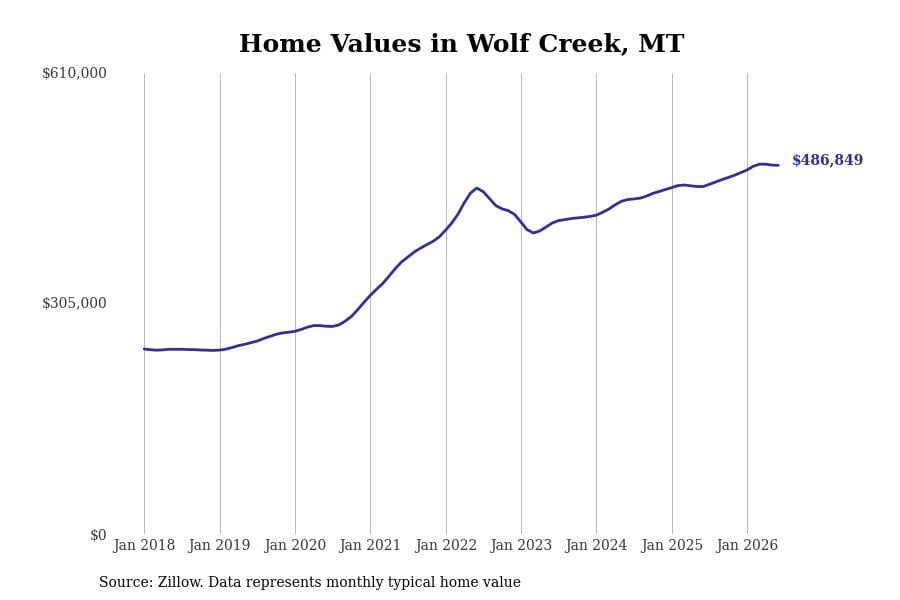
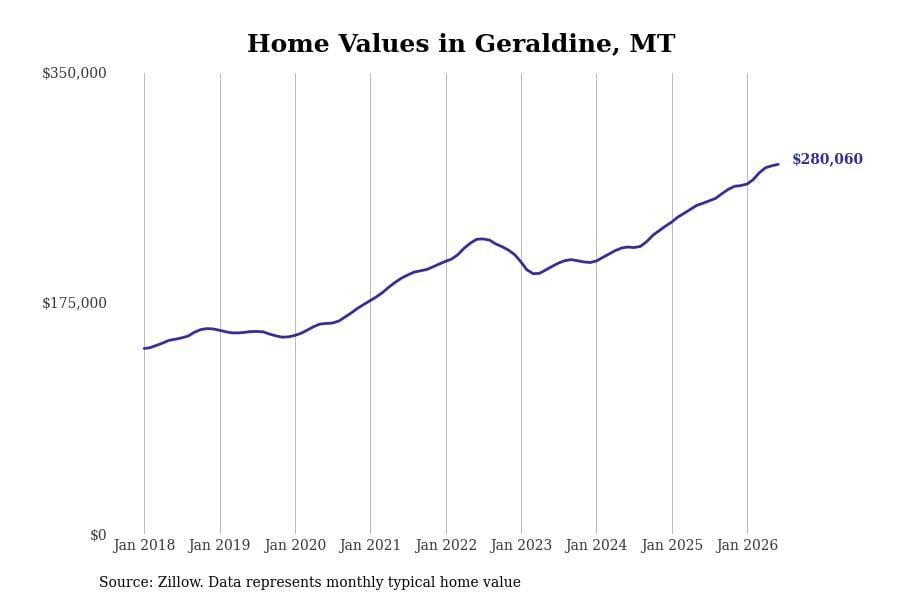
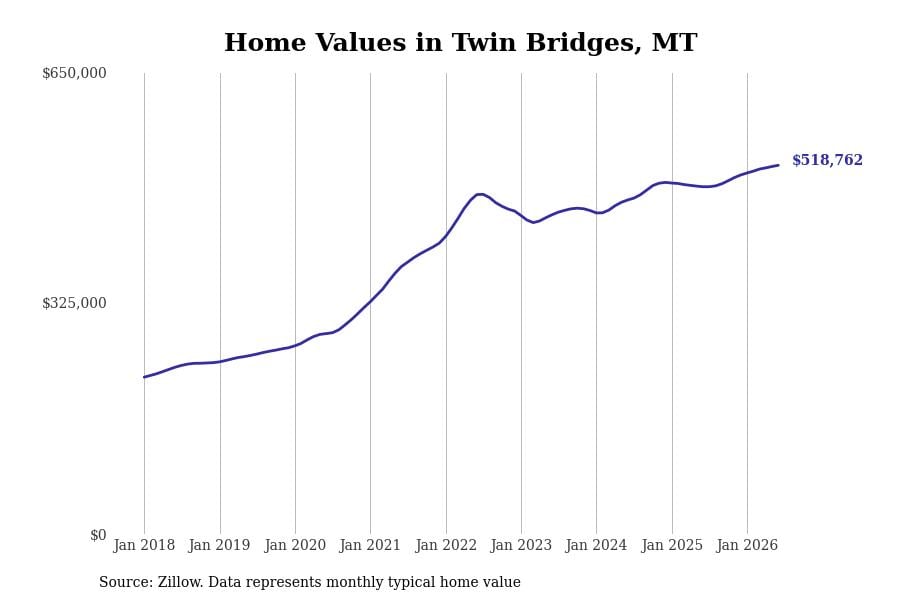
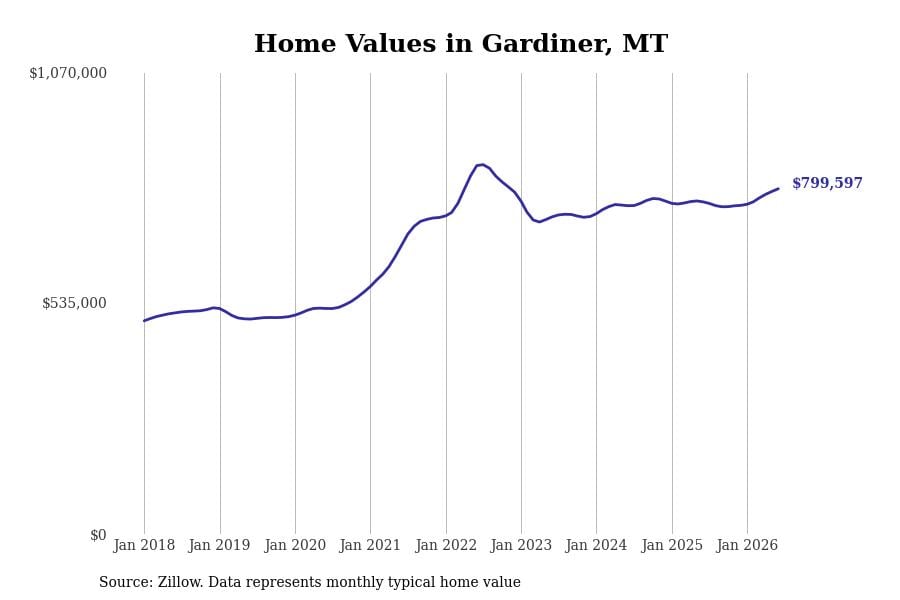
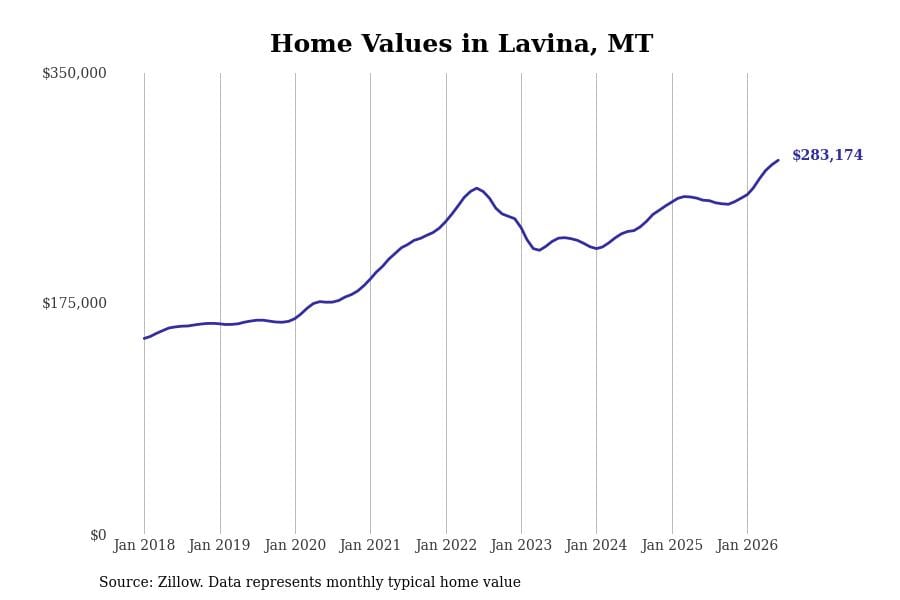
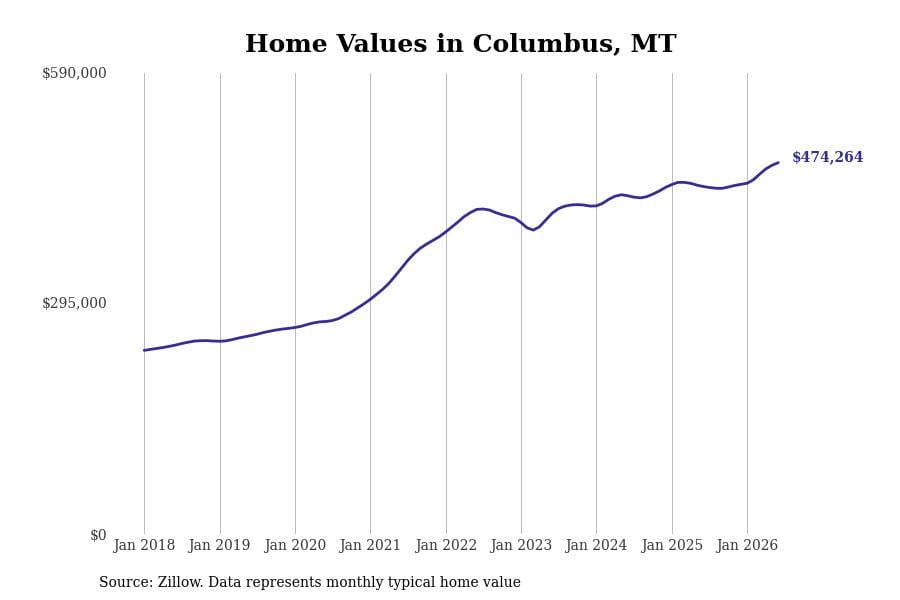
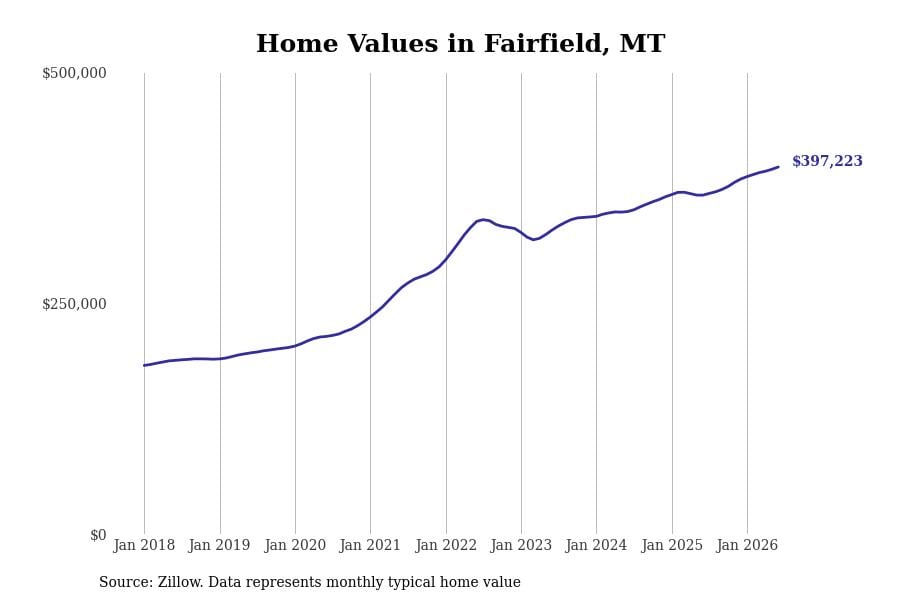
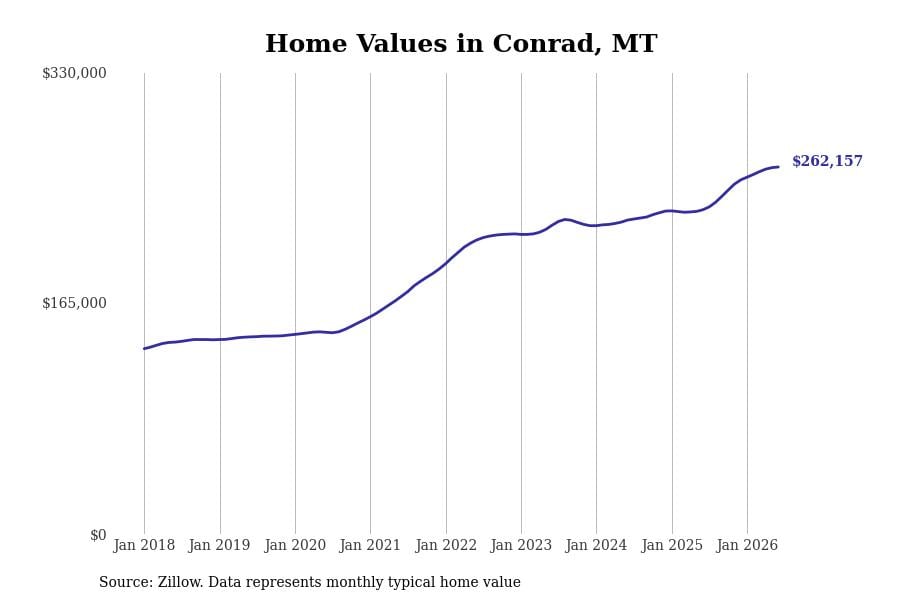
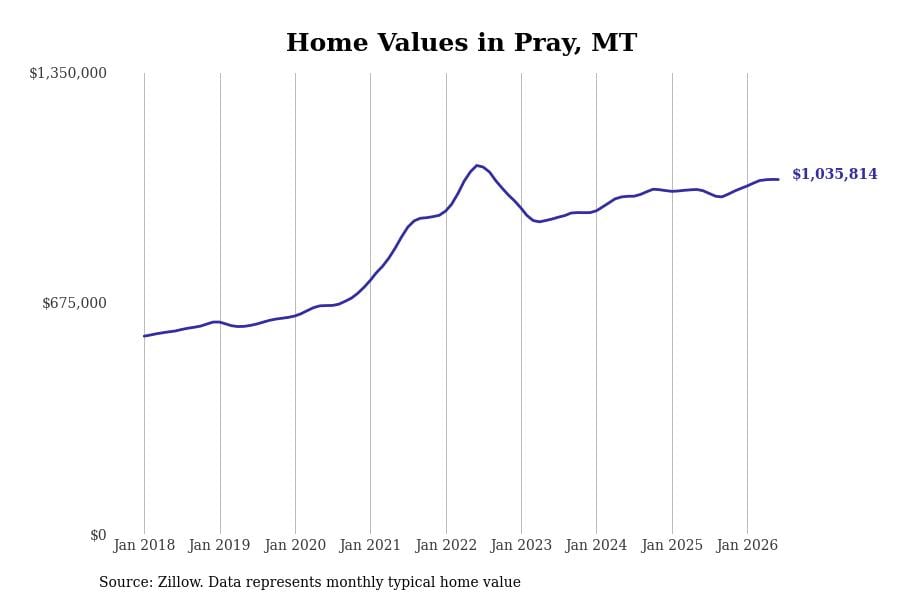
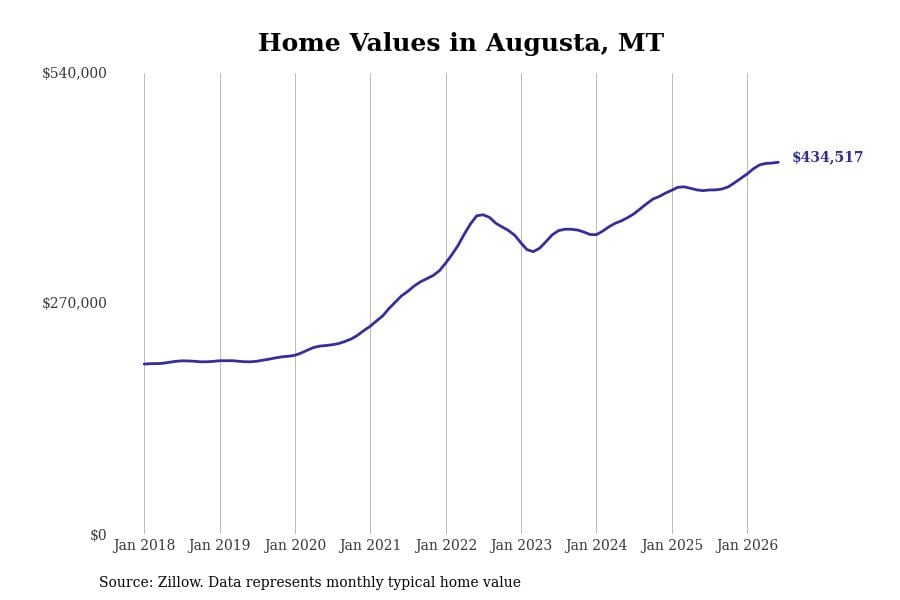
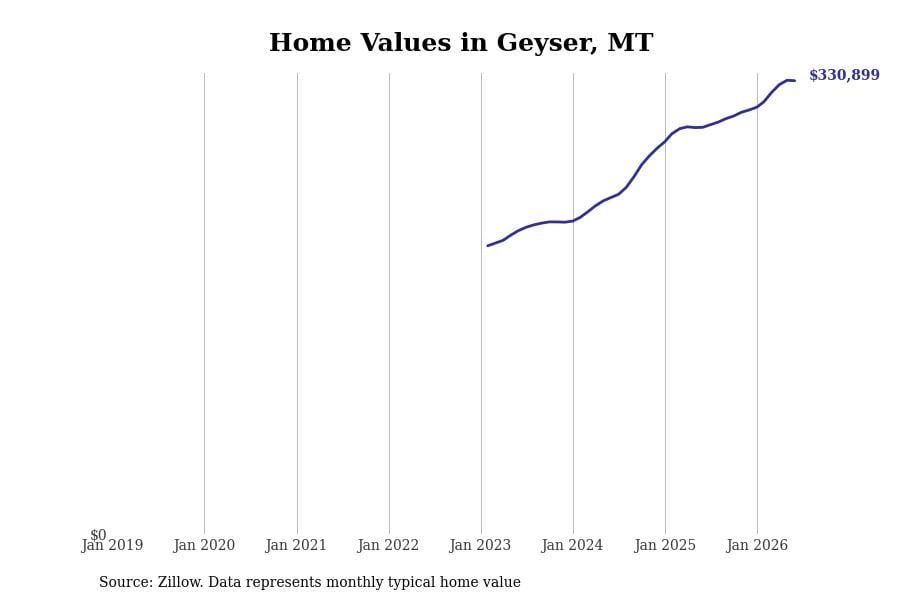
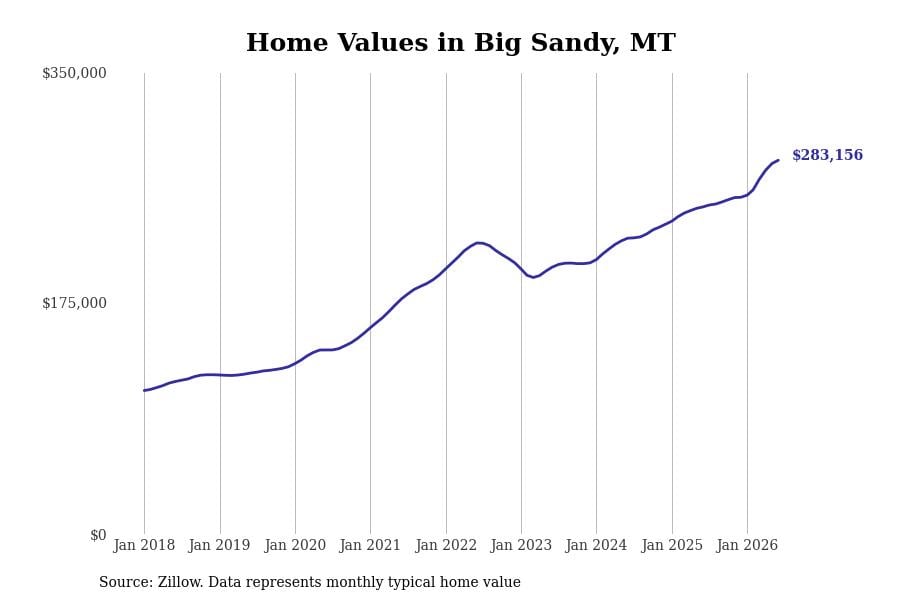
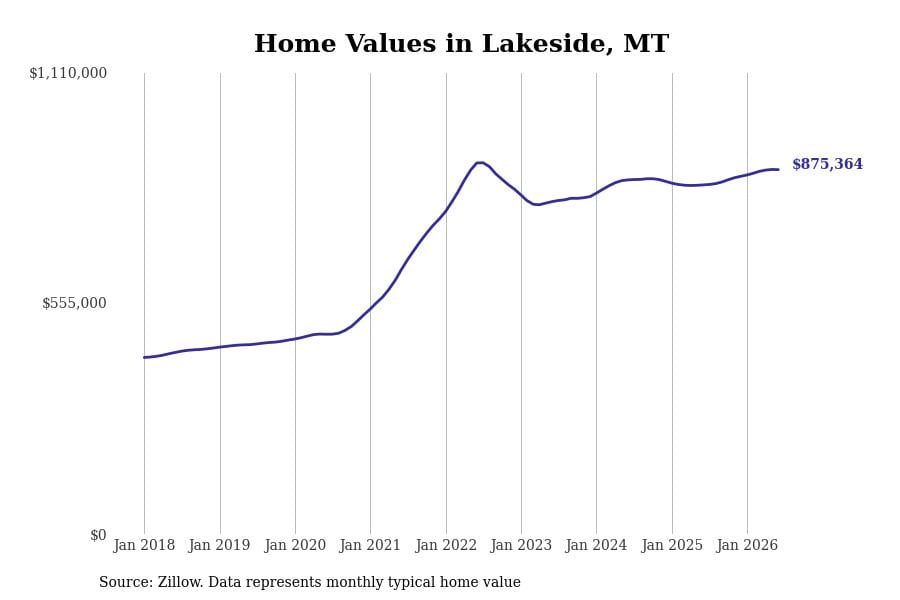
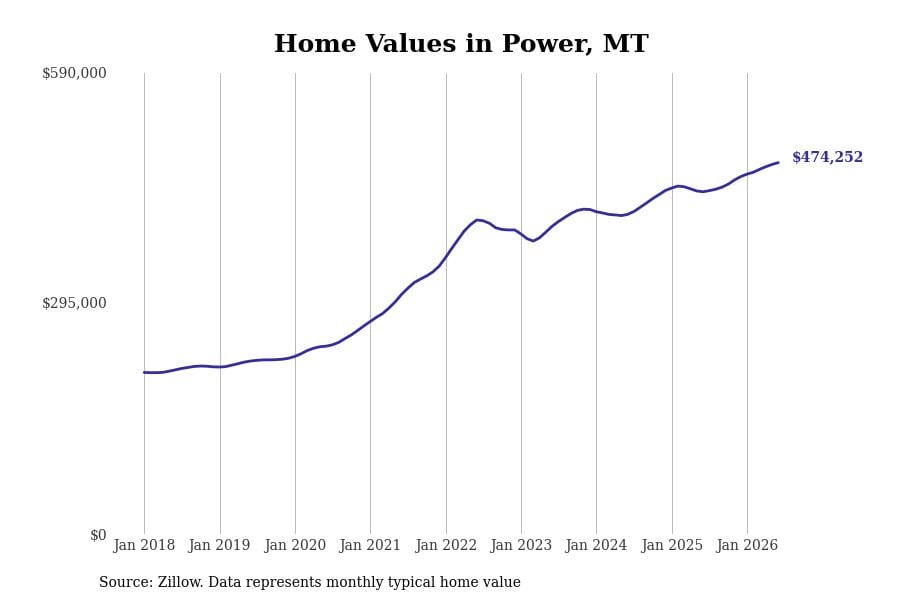
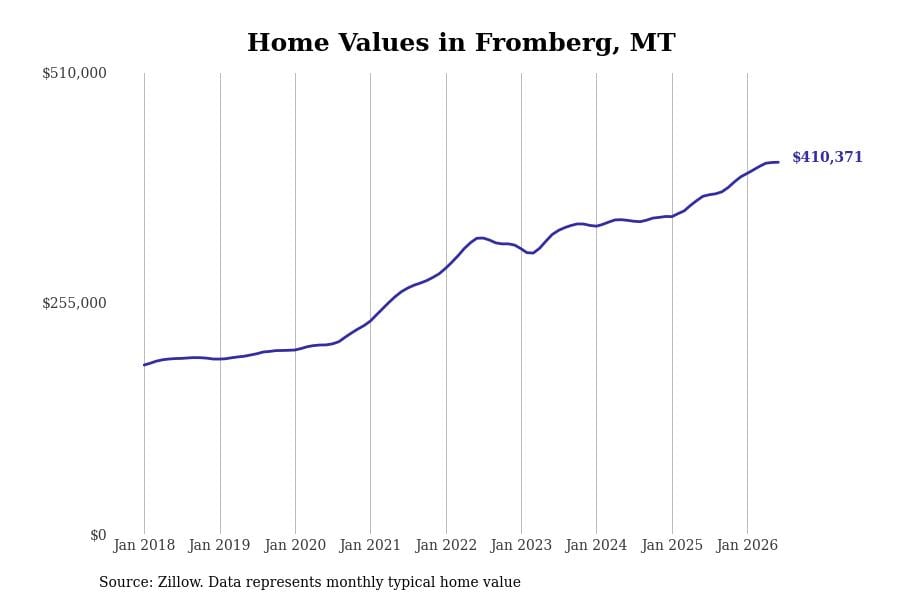
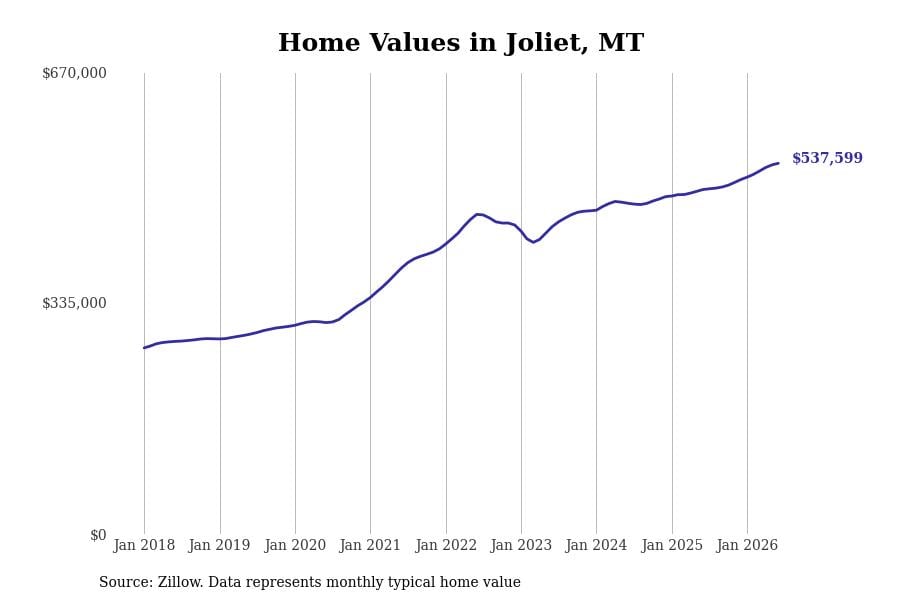
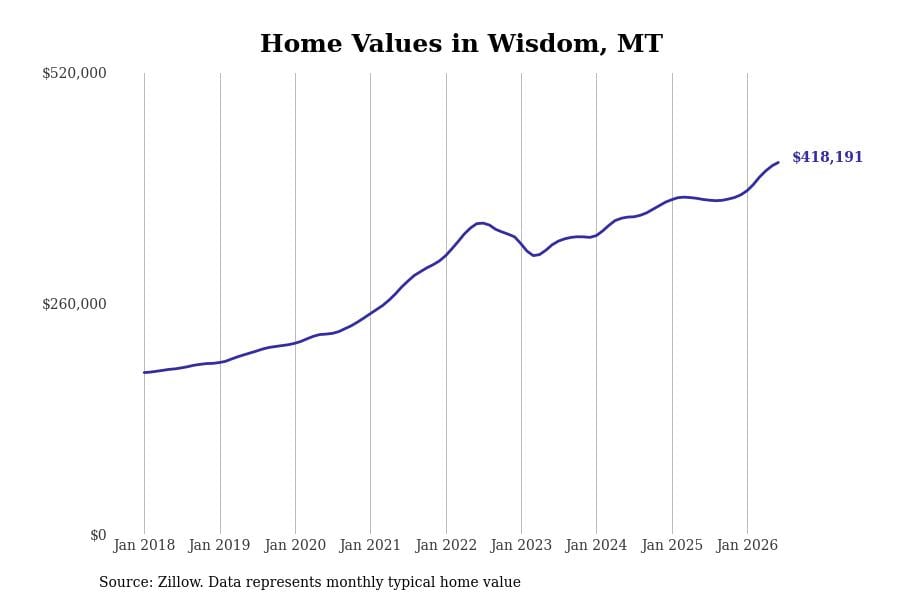
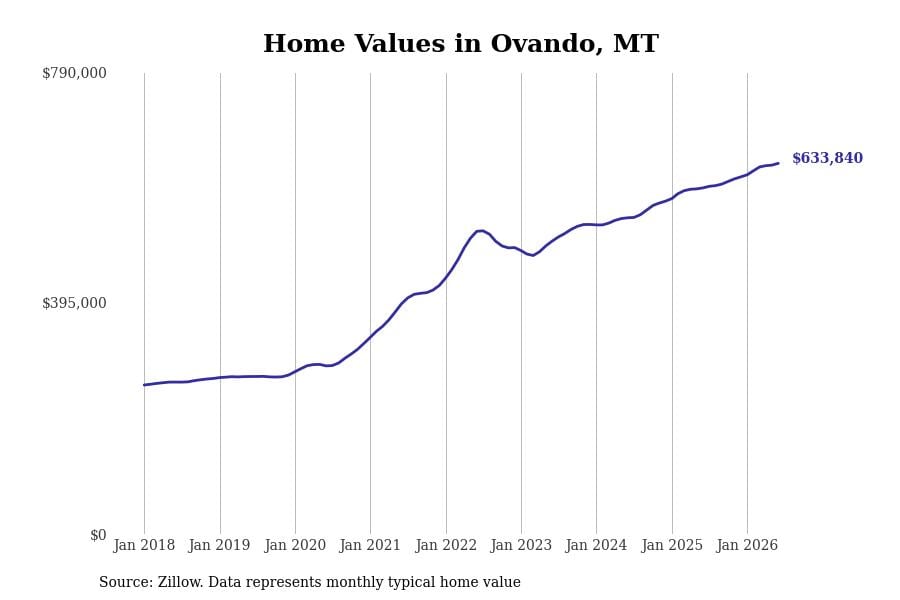
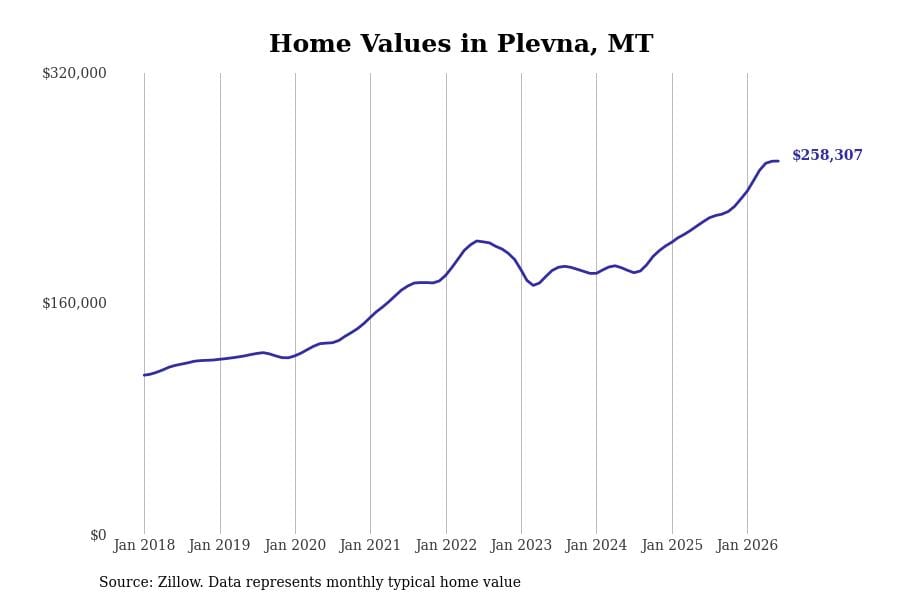
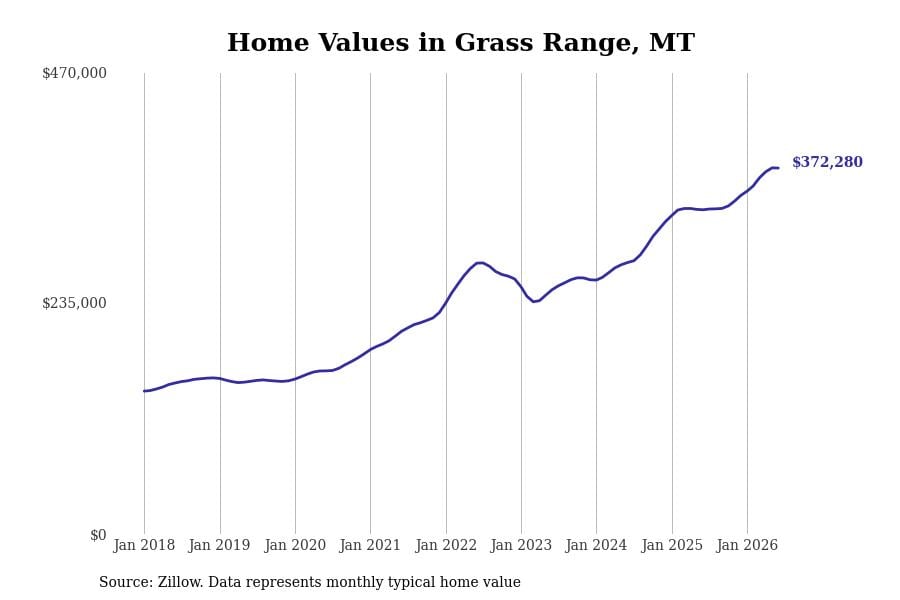
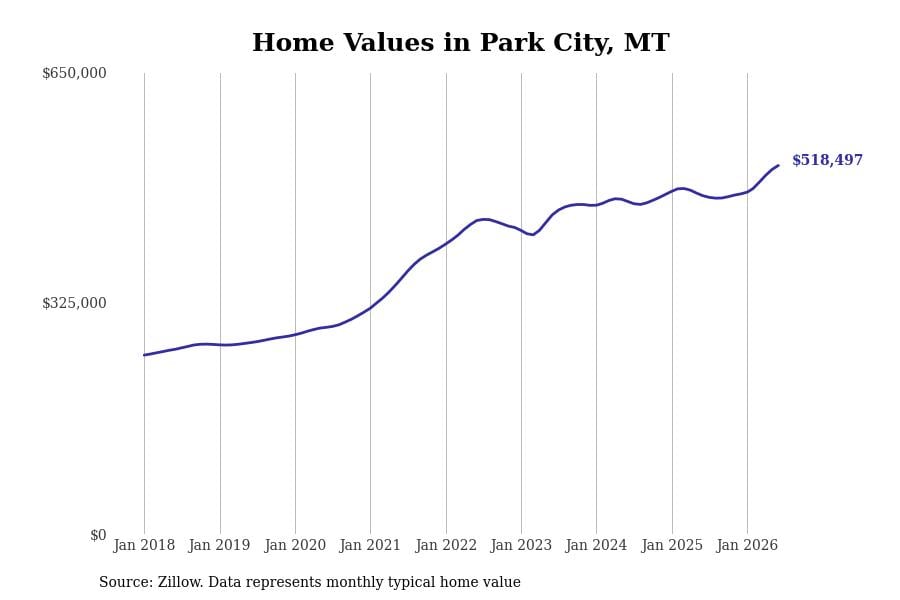
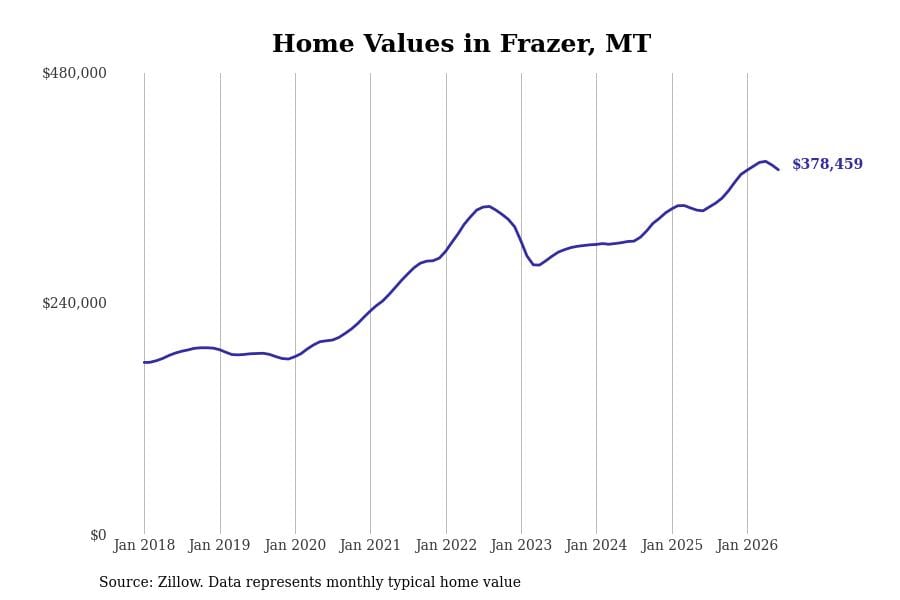
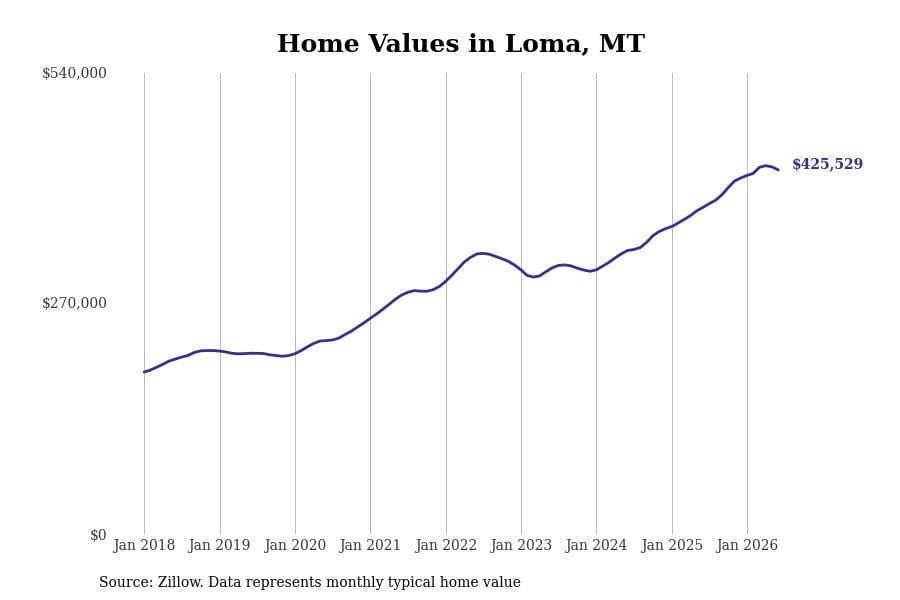
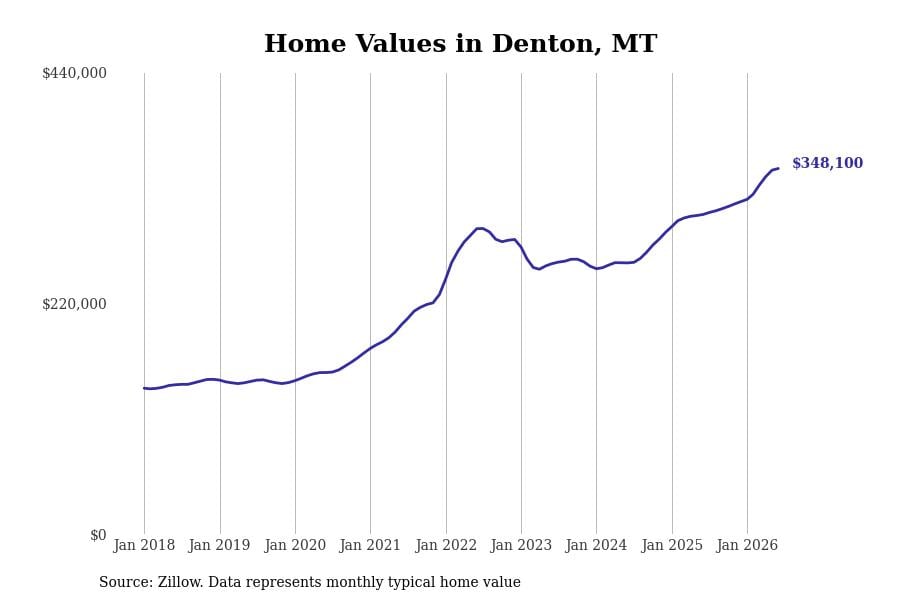
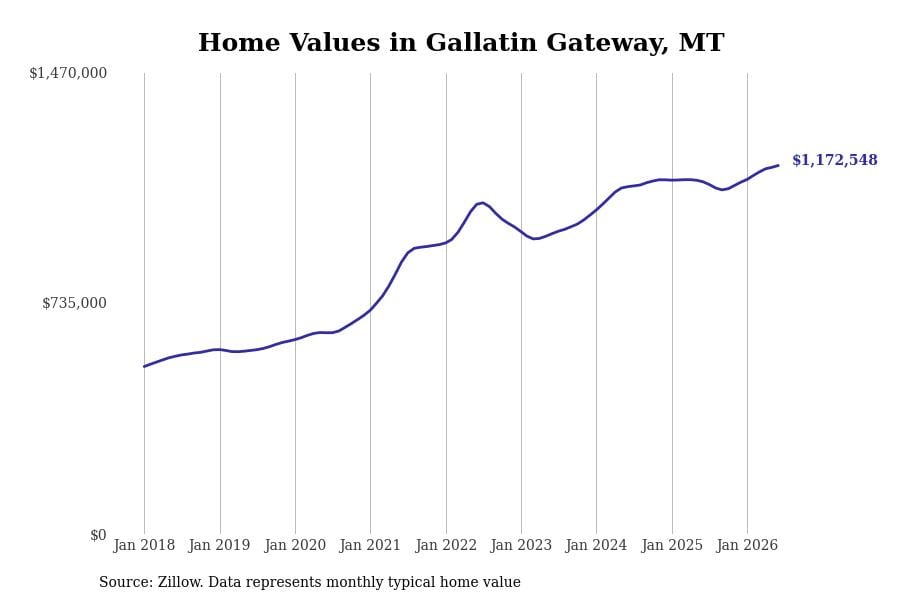
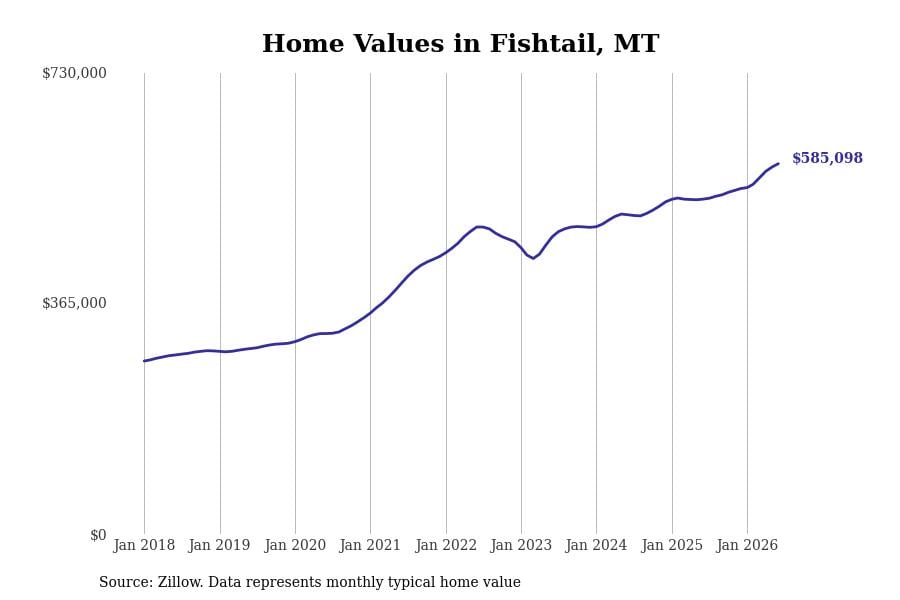
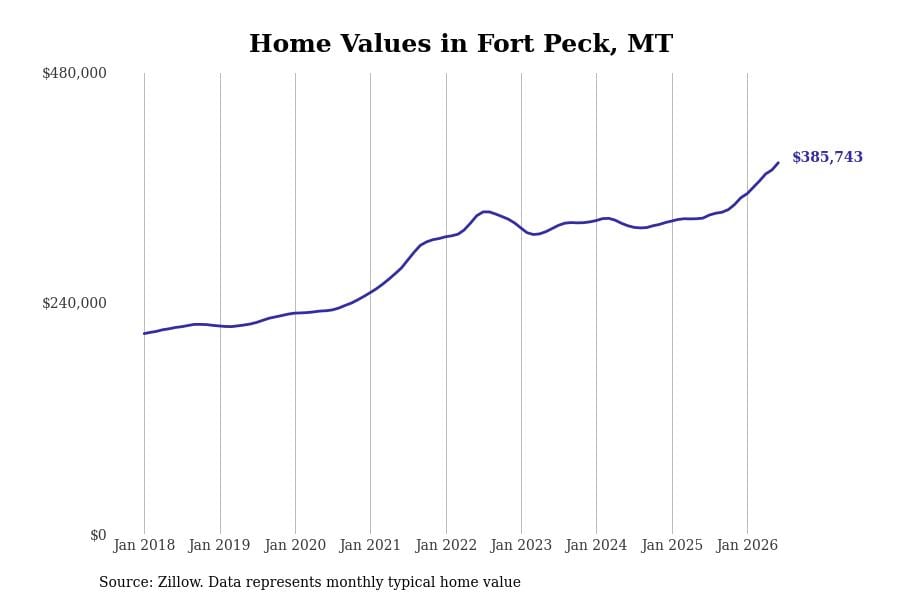
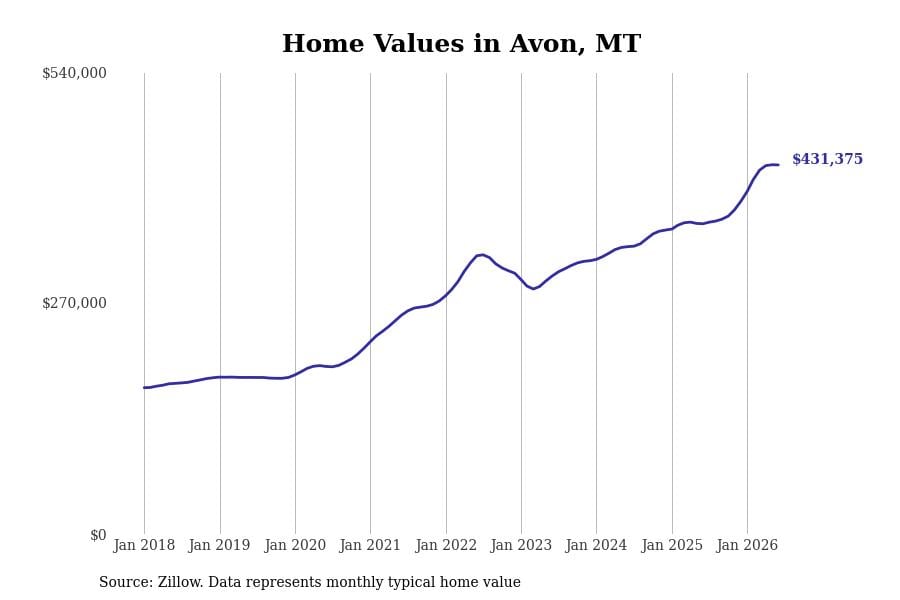
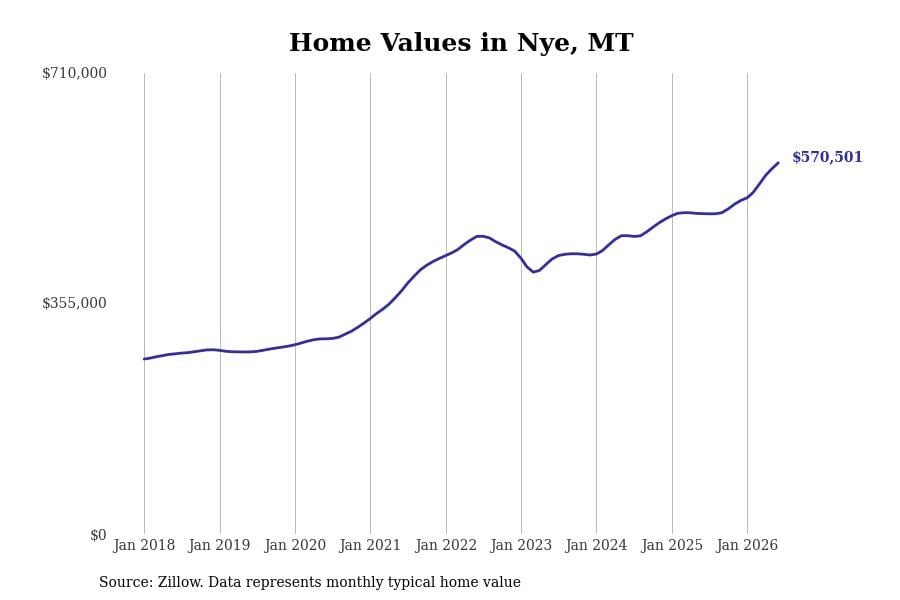
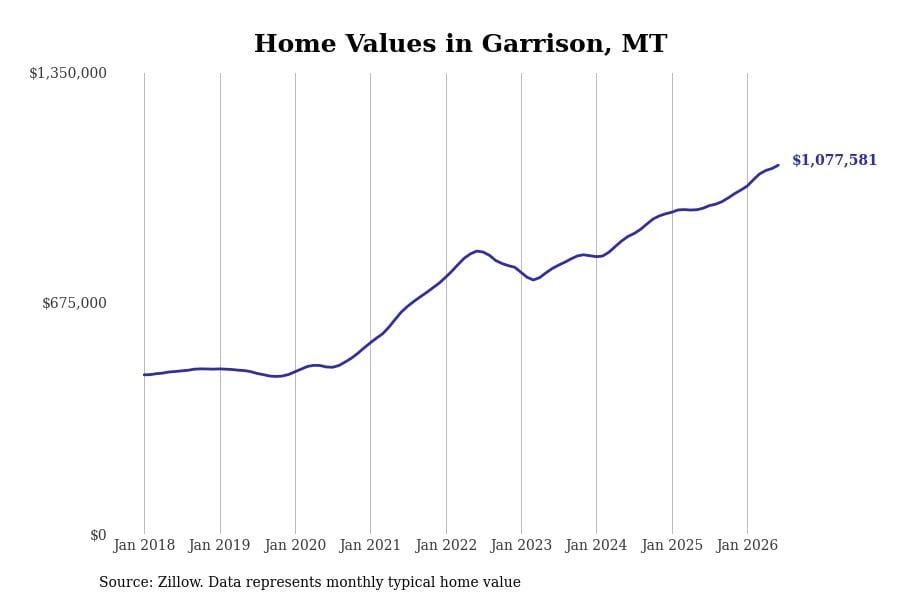
Stacker compiled a list of cities with the fastest-growing home prices in Montana using data from Zillow. Cities are ranked by the dollar change in the Zillow Home Values Index for all homes from the 12 months ending January 2025. The charts in this story were created automatically using Matplotlib. Data was available for 50 cities and towns in Montana.
#50. Kila
- Typical home value: $689,092
- 1-year price change: +$31,002 (+4.7%)
- 5-year price change: +$324,782 (+89.1%)
- Metro area: Kalispell, MT
#49. Stanford
- Typical home value: $240,014
- 1-year price change: +$31,174 (+14.9%)
- 5-year price change: +$103,834 (+76.2%)
- Metro area: not in a metro area
#48. Big Timber
- Typical home value: $390,754
- 1-year price change: +$31,325 (+8.7%)
- 5-year price change: +$168,975 (+76.2%)
- Metro area: not in a metro area
#47. Charlo
- Typical home value: $501,636
- 1-year price change: +$31,639 (+6.7%)
- 5-year price change: +$241,740 (+93.0%)
- Metro area: not in a metro area
#46. Polaris
- Typical home value: $416,123
- 1-year price change: +$31,997 (+8.3%)
- 5-year price change: +$169,857 (+69.0%)
- Metro area: not in a metro area
#45. Cascade
- Typical home value: $380,098
- 1-year price change: +$32,831 (+9.5%)
- 5-year price change: +$173,617 (+84.1%)
- Metro area: Great Falls, MT
#44. Sand Coulee
- Typical home value: $274,865
- 1-year price change: +$33,049 (+13.7%)
- 5-year price change: +$120,466 (+78.0%)
- Metro area: Great Falls, MT
#43. Lima
- Typical home value: $262,872
- 1-year price change: +$33,226 (+14.5%)
- 5-year price change: +$109,793 (+71.7%)
- Metro area: not in a metro area
#42. Frazer
- Typical home value: $304,969
- 1-year price change: +$33,464 (+12.3%)
- 5-year price change: +$138,692 (+83.4%)
- Metro area: not in a metro area
#41. Fort Shaw
- Typical home value: $434,716
- 1-year price change: +$33,784 (+8.4%)
- 5-year price change: +$189,755 (+77.5%)
- Metro area: Great Falls, MT
#40. Clancy
- Typical home value: $593,081
- 1-year price change: +$34,525 (+6.2%)
- 5-year price change: +$242,040 (+68.9%)
- Metro area: Helena, MT
#39. Bonner
- Typical home value: $638,983
- 1-year price change: +$35,112 (+5.8%)
- 5-year price change: +$286,752 (+81.4%)
- Metro area: Missoula, MT
#38. Avon
- Typical home value: $358,127
- 1-year price change: +$35,588 (+11.0%)
- 5-year price change: +$171,304 (+91.7%)
- Metro area: not in a metro area
#37. Huson
- Typical home value: $667,042
- 1-year price change: +$35,840 (+5.7%)
- 5-year price change: +$310,447 (+87.1%)
- Metro area: Missoula, MT
#36. Wolf Creek
- Typical home value: $455,667
- 1-year price change: +$36,302 (+8.7%)
- 5-year price change: +$189,090 (+70.9%)
- Metro area: Helena, MT
#35. Cardwell
- Typical home value: $545,253
- 1-year price change: +$36,650 (+7.2%)
- 5-year price change: +$258,433 (+90.1%)
- Metro area: Helena, MT
#34. Helmville
- Typical home value: $444,986
- 1-year price change: +$37,569 (+9.2%)
- 5-year price change: +$232,883 (+109.8%)
- Metro area: not in a metro area
#33. Moore
- Typical home value: $332,524
- 1-year price change: +$37,599 (+12.7%)
- 5-year price change: +$146,066 (+78.3%)
- Metro area: not in a metro area
#32. Sun River
- Typical home value: $440,991
- 1-year price change: +$38,253 (+9.5%)
- 5-year price change: +$201,015 (+83.8%)
- Metro area: Great Falls, MT
#31. Divide
- Typical home value: $449,311
- 1-year price change: +$38,602 (+9.4%)
- 5-year price change: +$210,298 (+88.0%)
- Metro area: Butte-Silver Bow, MT
#30. Frenchtown
- Typical home value: $633,539
- 1-year price change: +$39,078 (+6.6%)
- 5-year price change: +$284,772 (+81.7%)
- Metro area: Missoula, MT
#29. Ovando
- Typical home value: $498,223
- 1-year price change: +$39,218 (+8.5%)
- 5-year price change: +$257,349 (+106.8%)
- Metro area: not in a metro area
#28. Twin Bridges
- Typical home value: $461,959
- 1-year price change: +$39,337 (+9.3%)
- 5-year price change: +$214,267 (+86.5%)
- Metro area: not in a metro area
#27. Monarch
- Typical home value: $307,993
- 1-year price change: +$39,416 (+14.7%)
- 5-year price change: +$135,465 (+78.5%)
- Metro area: Great Falls, MT
#26. Wisdom
- Typical home value: $367,609
- 1-year price change: +$39,509 (+12.0%)
- 5-year price change: +$157,931 (+75.3%)
- Metro area: not in a metro area
#25. Fishtail
- Typical home value: $482,169
- 1-year price change: +$39,536 (+8.9%)
- 5-year price change: +$205,162 (+74.1%)
- Metro area: Billings, MT
#24. Whitefish
- Typical home value: $847,737
- 1-year price change: +$39,648 (+4.9%)
- 5-year price change: +$431,060 (+103.5%)
- Metro area: Kalispell, MT
#23. McLeod
- Typical home value: $602,522
- 1-year price change: +$40,758 (+7.3%)
- 5-year price change: +$227,659 (+60.7%)
- Metro area: not in a metro area
#22. Custer
- Typical home value: $380,234
- 1-year price change: +$41,300 (+12.2%)
- 5-year price change: +$185,548 (+95.3%)
- Metro area: Billings, MT
#21. Denton
- Typical home value: $311,337
- 1-year price change: +$42,859 (+16.0%)
- 5-year price change: +$156,182 (+100.7%)
- Metro area: not in a metro area
#20. Toston
- Typical home value: $397,218
- 1-year price change: +$43,294 (+12.2%)
- 5-year price change: +$207,583 (+109.5%)
- Metro area: not in a metro area
#19. Hobson
- Typical home value: $306,956
- 1-year price change: +$43,327 (+16.4%)
- 5-year price change: data not available
- Metro area: not in a metro area
#18. Roy
- Typical home value: $331,341
- 1-year price change: +$43,791 (+15.2%)
- 5-year price change: +$197,561 (+147.7%)
- Metro area: not in a metro area
#17. Loma
- Typical home value: $311,794
- 1-year price change: +$43,989 (+16.4%)
- 5-year price change: +$129,076 (+70.6%)
- Metro area: not in a metro area
#16. Emigrant
- Typical home value: $706,380
- 1-year price change: +$44,087 (+6.7%)
- 5-year price change: +$273,385 (+63.1%)
- Metro area: not in a metro area
#15. Belt
- Typical home value: $371,534
- 1-year price change: +$44,338 (+13.6%)
- 5-year price change: +$172,719 (+86.9%)
- Metro area: Great Falls, MT
#14. Condon
- Typical home value: $634,594
- 1-year price change: +$47,266 (+8.0%)
- 5-year price change: +$305,180 (+92.6%)
- Metro area: Missoula, MT
#13. Augusta
- Typical home value: $366,935
- 1-year price change: +$47,474 (+14.9%)
- 5-year price change: +$176,208 (+92.4%)
- Metro area: Helena, MT
#12. Rollins
- Typical home value: $1,167,391
- 1-year price change: +$48,009 (+4.3%)
- 5-year price change: +$646,791 (+124.2%)
- Metro area: not in a metro area
#11. Reed Point
- Typical home value: $466,525
- 1-year price change: +$48,582 (+11.6%)
- 5-year price change: +$220,985 (+90.0%)
- Metro area: Billings, MT
#10. Pray
- Typical home value: $936,177
- 1-year price change: +$53,094 (+6.0%)
- 5-year price change: +$340,477 (+57.2%)
- Metro area: not in a metro area
#9. Nye
- Typical home value: $456,193
- 1-year price change: +$55,044 (+13.7%)
- 5-year price change: +$185,032 (+68.2%)
- Metro area: Billings, MT
#8. Stockett
- Typical home value: $340,556
- 1-year price change: +$56,514 (+19.9%)
- 5-year price change: +$177,367 (+108.7%)
- Metro area: Great Falls, MT
#7. Geyser
- Typical home value: $308,483
- 1-year price change: +$62,485 (+25.4%)
- 5-year price change: data not available
- Metro area: not in a metro area
#6. Wise River
- Typical home value: $548,330
- 1-year price change: +$66,173 (+13.7%)
- 5-year price change: +$286,140 (+109.1%)
- Metro area: not in a metro area
#5. Grass Range
- Typical home value: $352,751
- 1-year price change: +$71,666 (+25.5%)
- 5-year price change: +$181,300 (+105.7%)
- Metro area: not in a metro area
#4. Silver Gate
- Typical home value: $652,203
- 1-year price change: +$85,974 (+15.2%)
- 5-year price change: +$245,480 (+60.4%)
- Metro area: not in a metro area
#3. Gallatin Gateway
- Typical home value: $1,043,467
- 1-year price change: +$87,603 (+9.2%)
- 5-year price change: +$470,210 (+82.0%)
- Metro area: Bozeman, MT
#2. Big Sky
- Typical home value: $1,810,109
- 1-year price change: +$113,556 (+6.7%)
- 5-year price change: +$737,578 (+68.8%)
- Metro area: Bozeman, MT
#1. Garrison
- Typical home value: $840,556
- 1-year price change: +$116,239 (+16.0%)
- 5-year price change: +$416,913 (+98.4%)
- Metro area: not in a metro area