Counties with the most bridges in dire need of repair in Montana

·Stacker

Canva
Canva

One in three U.S. bridges is in need of repair or replacement, according to data from the American Road & Transportation Builders Association, including 29% of interstate bridges. The cost to make these repairs is estimated to be in excess of $54 billion.

Stacker investigated which counties in Montana have the most bridges in dire need of repair using data from the Federal Highway Administration. The data is accurate as of June 15, 2022. Counties are ranked by percent of bridges in "poor" condition and ties are broken by percent square meters of bridges in poor condition. Counties that have no bridges or have no bridges in poor condition are excluded from the list.

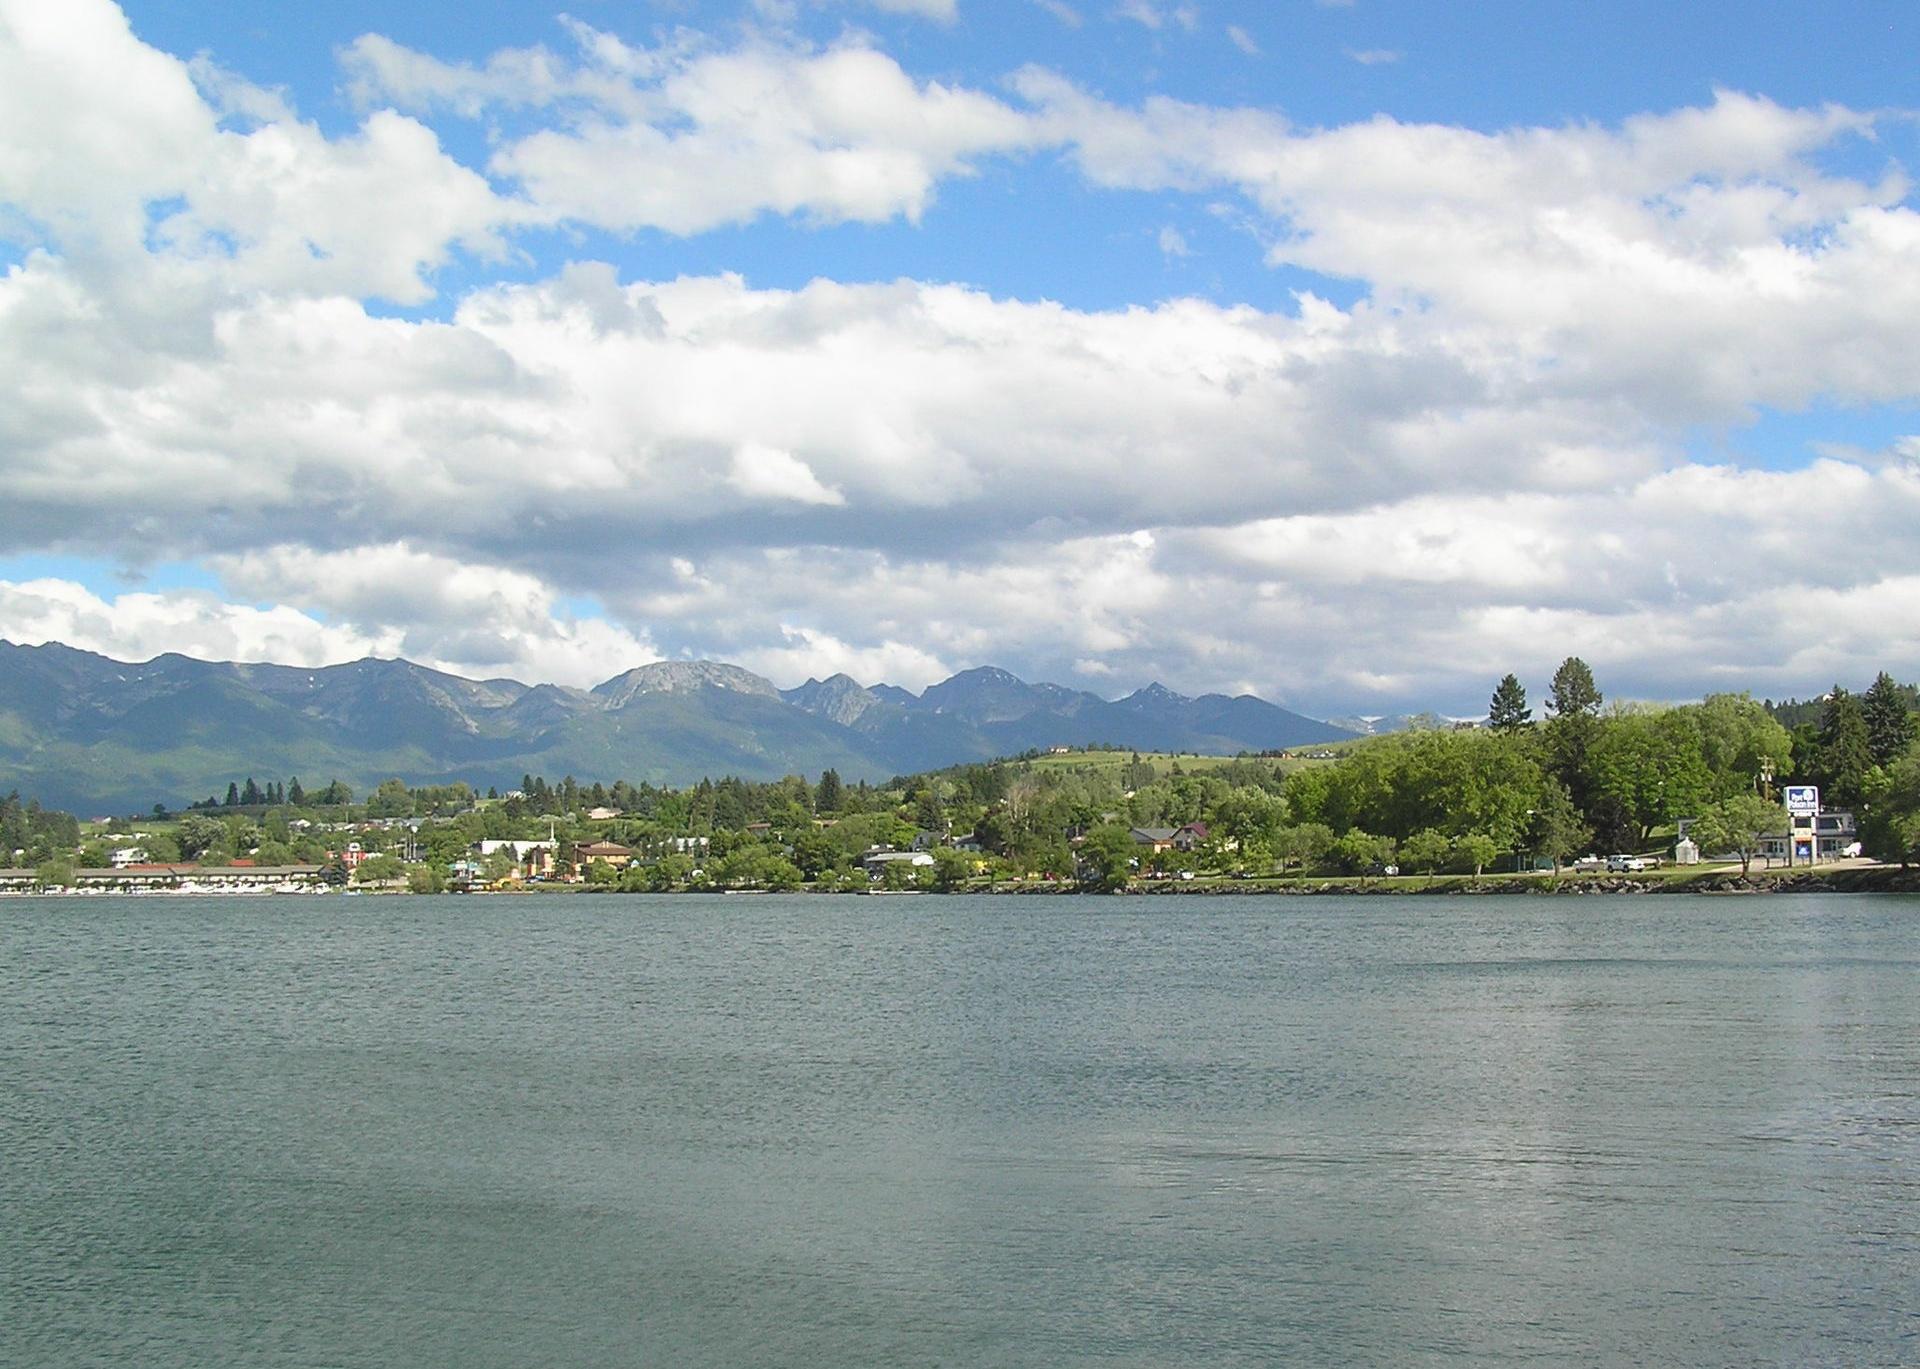
#20. Blaine County

Canva

1 / 20

#20. Blaine County

- Bridges in poor condition: 9.0% (9 of 100 bridges)
- Square meters of bridges in poor condition: 11.2% (2,498 of 22,279 square meters of bridges)

#19. McCone County

Canva

2 / 20

#19. McCone County

- Bridges in poor condition: 9.1% (4 of 44 bridges)
- Square meters of bridges in poor condition: 3.6% (502 of 13,991 square meters of bridges)

#18. Liberty County

Canva

3 / 20

#18. Liberty County

- Bridges in poor condition: 9.1% (1 of 11 bridges)
- Square meters of bridges in poor condition: 31.5% (1,092 of 3,467 square meters of bridges)

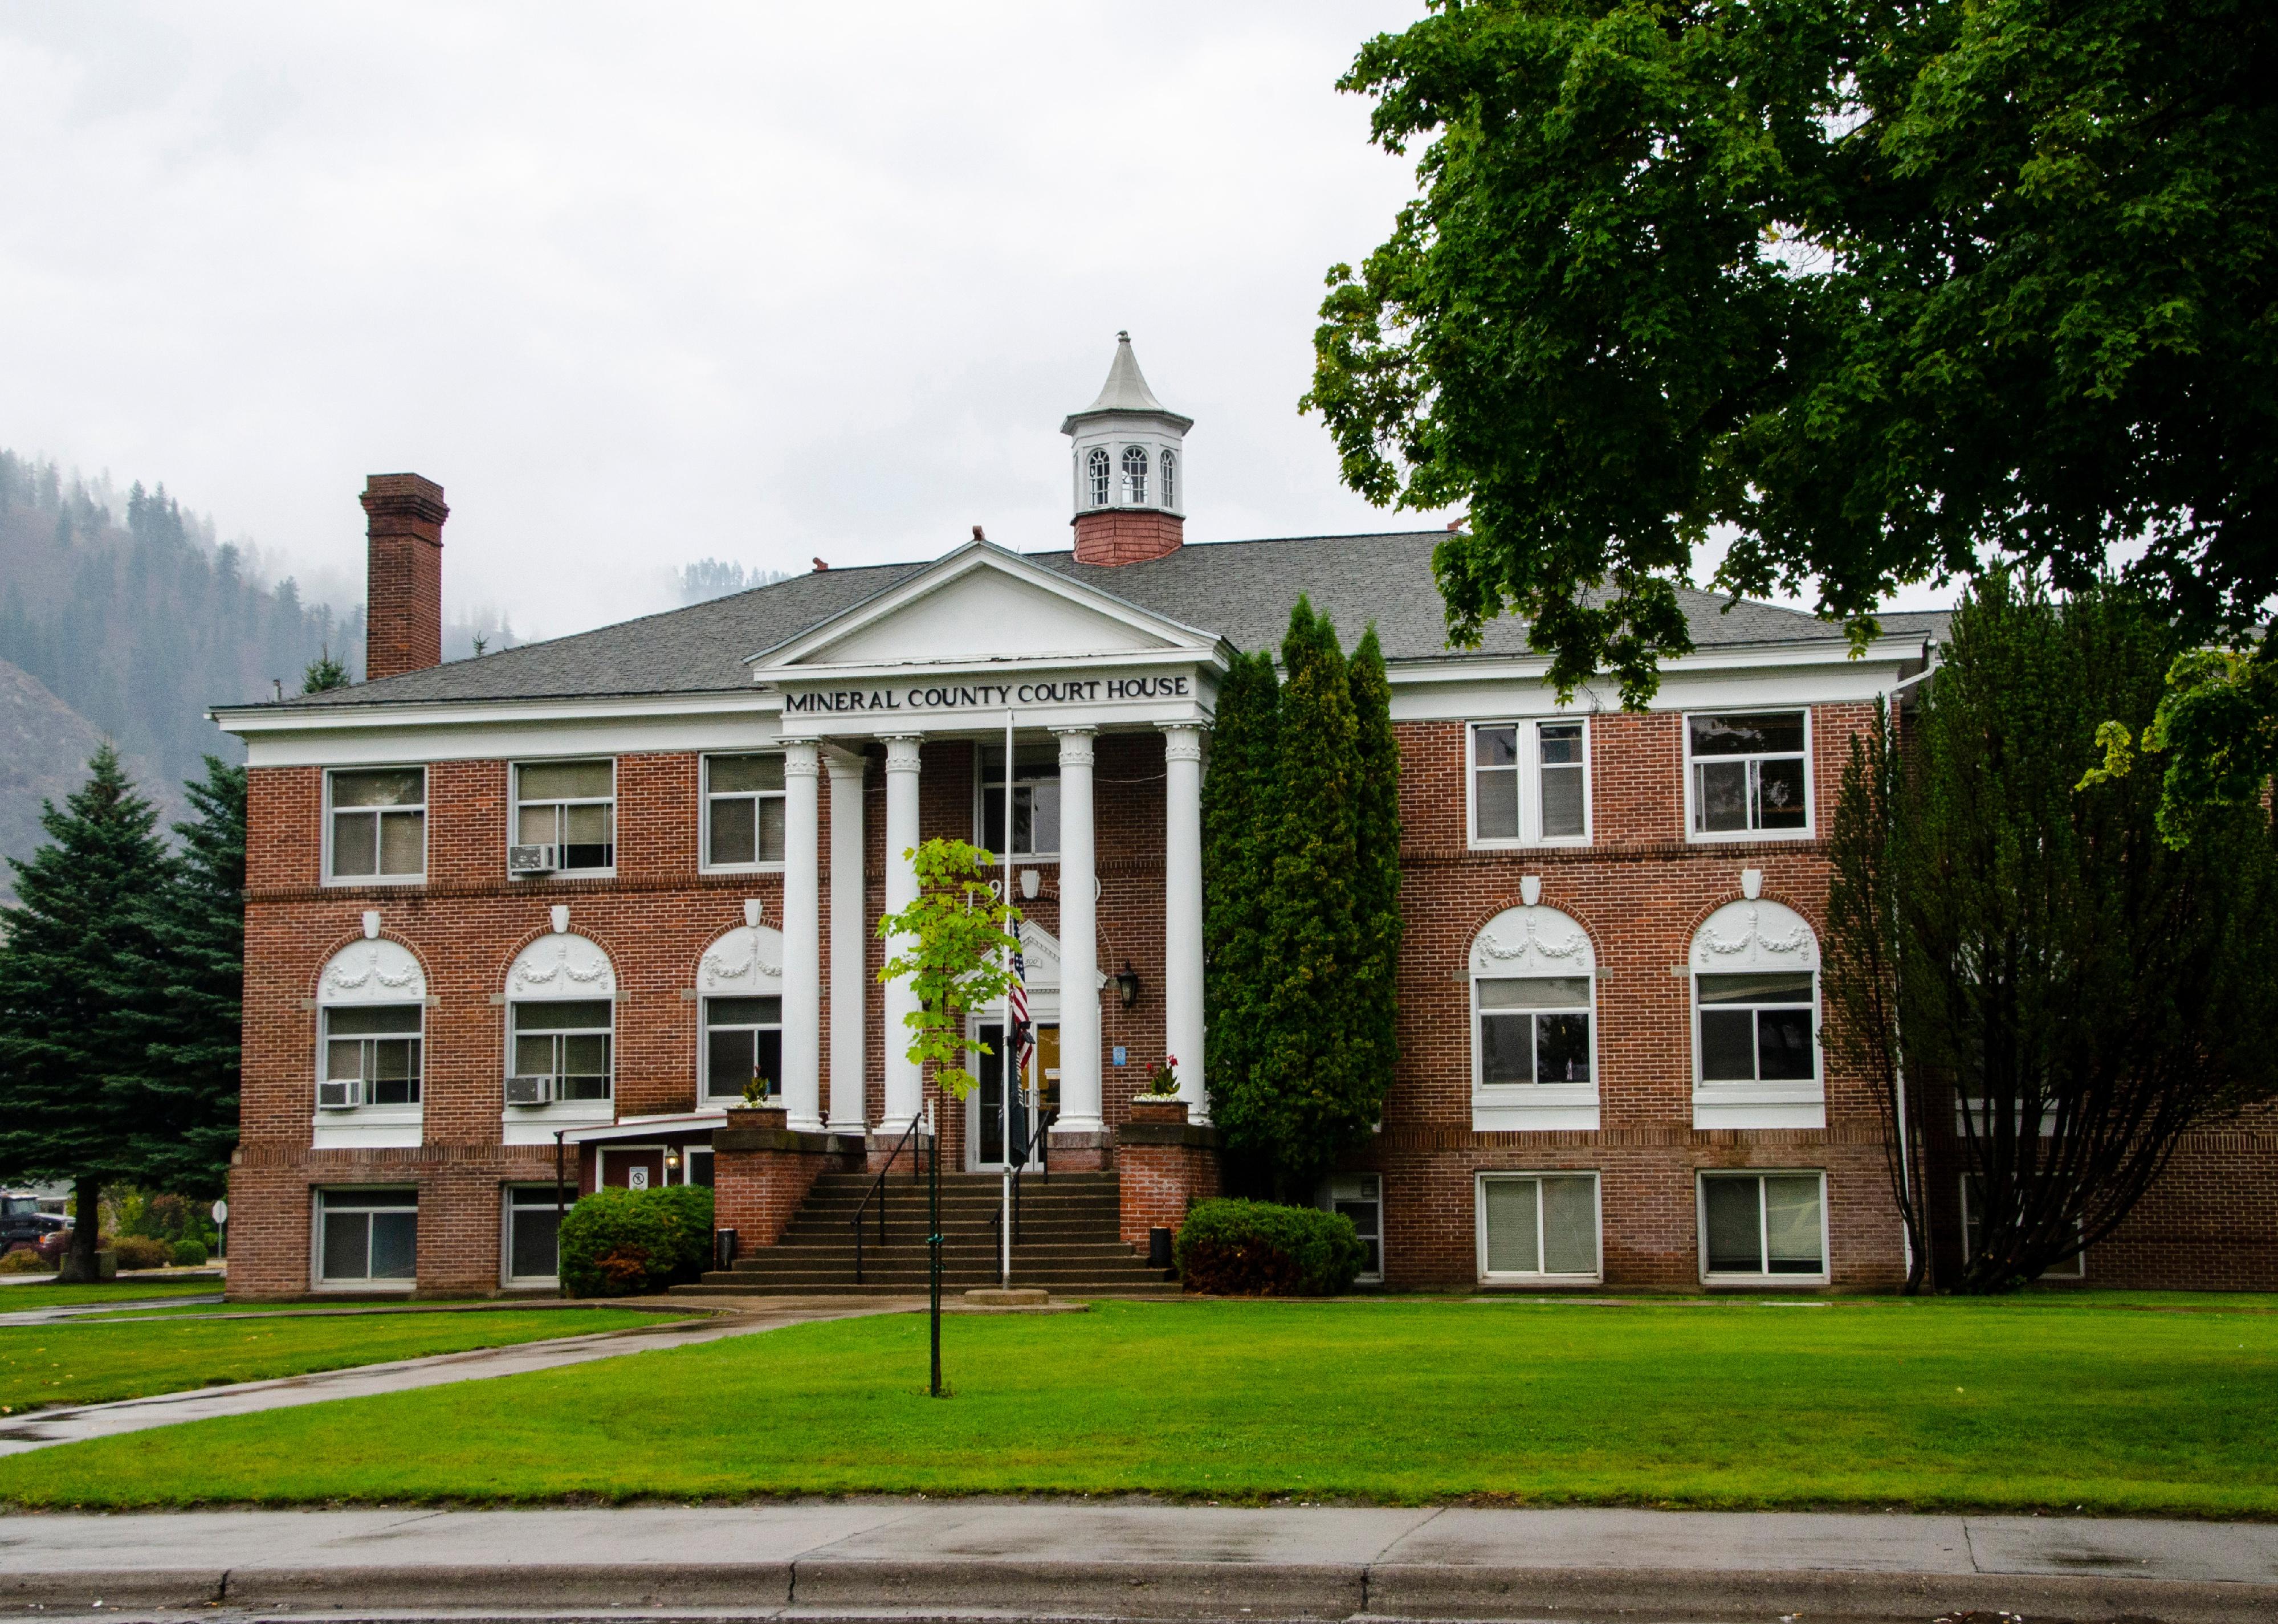
#17. Mineral County

Danita Delimont // Shutterstock

4 / 20

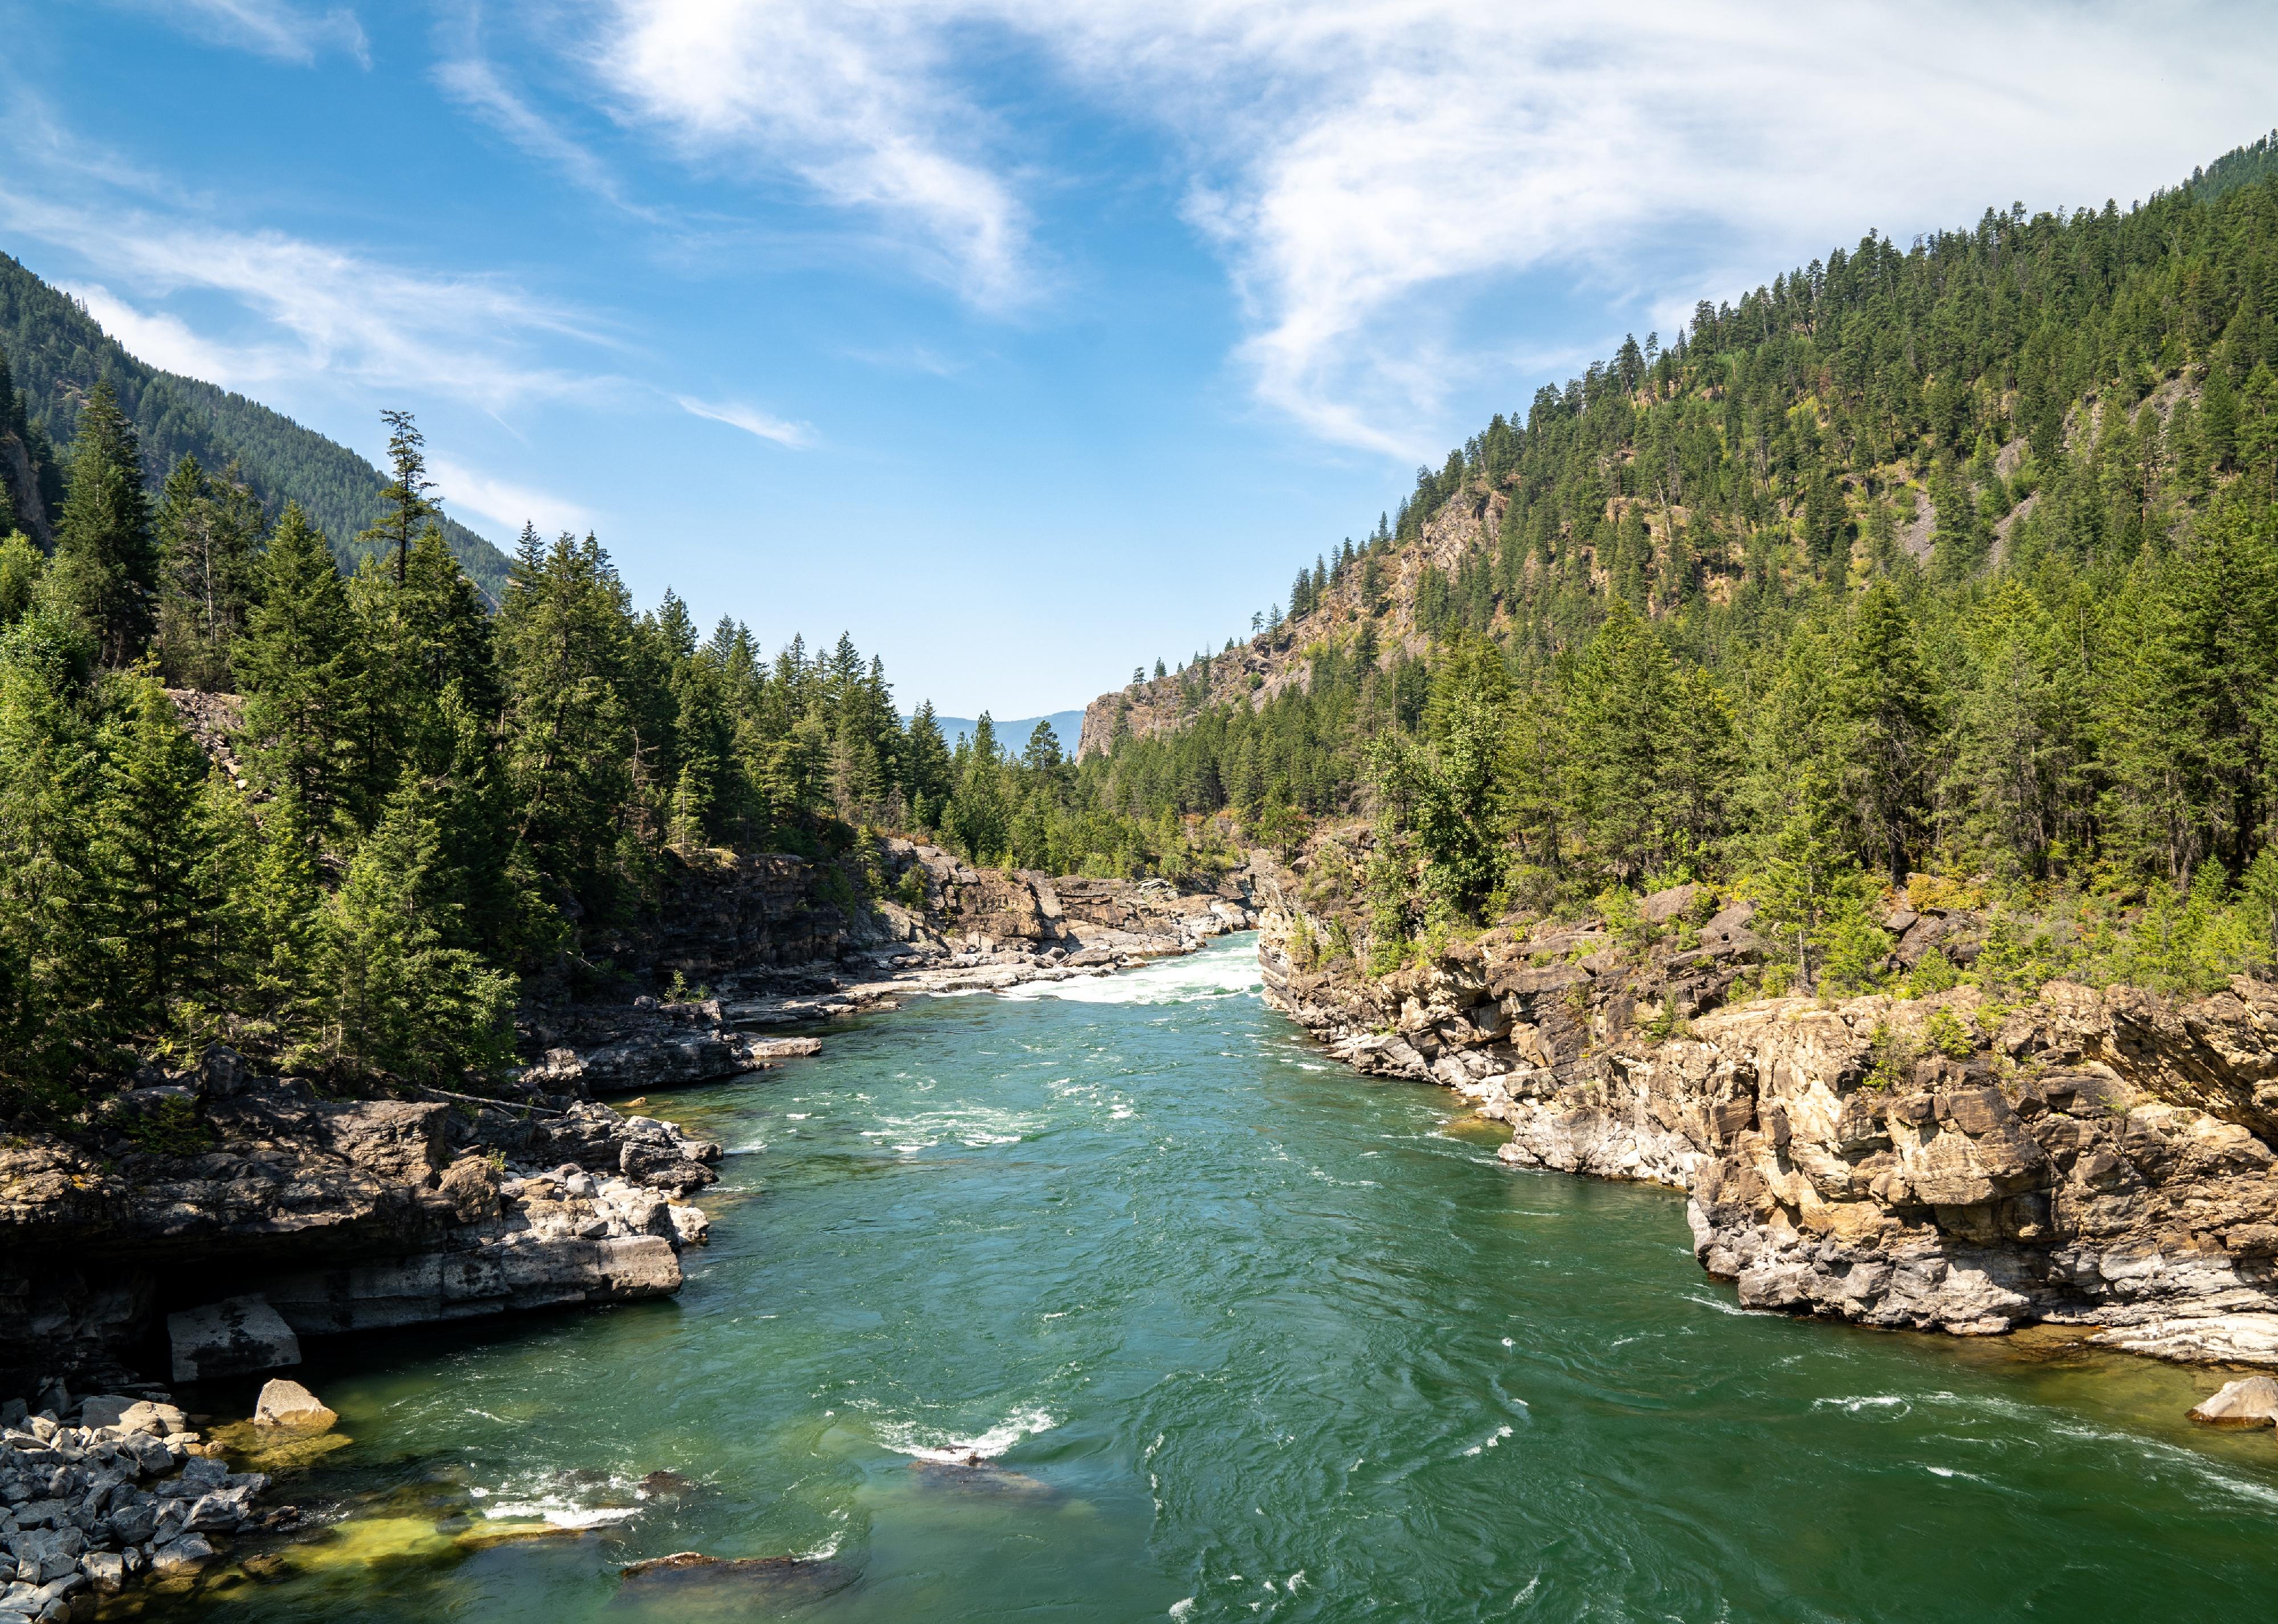
#17. Mineral County

- Bridges in poor condition: 9.2% (14 of 152 bridges)
- Square meters of bridges in poor condition: 10.1% (13,446 of 133,702 square meters of bridges)

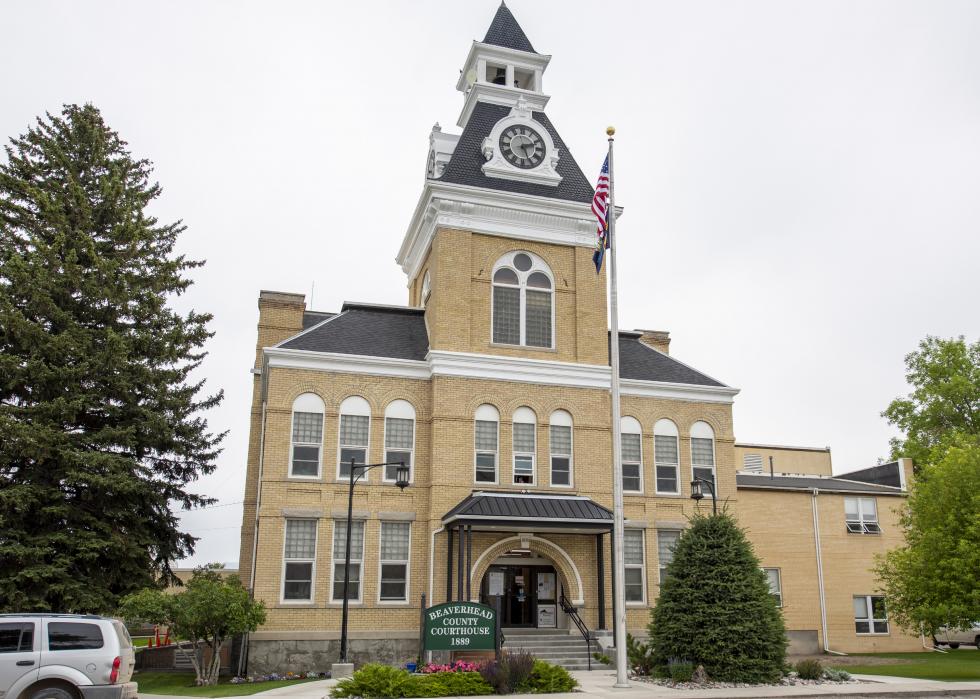
#16. Beaverhead County

Canva

5 / 20

#16. Beaverhead County

- Bridges in poor condition: 9.3% (21 of 226 bridges)
- Square meters of bridges in poor condition: 5.9% (4,048 of 69,133 square meters of bridges)

#15. Madison County

Canva

6 / 20

#15. Madison County

- Bridges in poor condition: 9.4% (9 of 96 bridges)
- Square meters of bridges in poor condition: 2.1% (690 of 32,483 square meters of bridges)

#14. Carbon County

Canva

7 / 20

#14. Carbon County

- Bridges in poor condition: 9.5% (8 of 84 bridges)
- Square meters of bridges in poor condition: 3.0% (661 of 22,399 square meters of bridges)

#13. Wheatland County

Canva

8 / 20

#13. Wheatland County

- Bridges in poor condition: 9.7% (3 of 31 bridges)
- Square meters of bridges in poor condition: 5.5% (400 of 7,240 square meters of bridges)

#12. Phillips County

Canva

9 / 20

#12. Phillips County

- Bridges in poor condition: 10.1% (10 of 99 bridges)
- Square meters of bridges in poor condition: 5.1% (1,368 of 26,736 square meters of bridges)

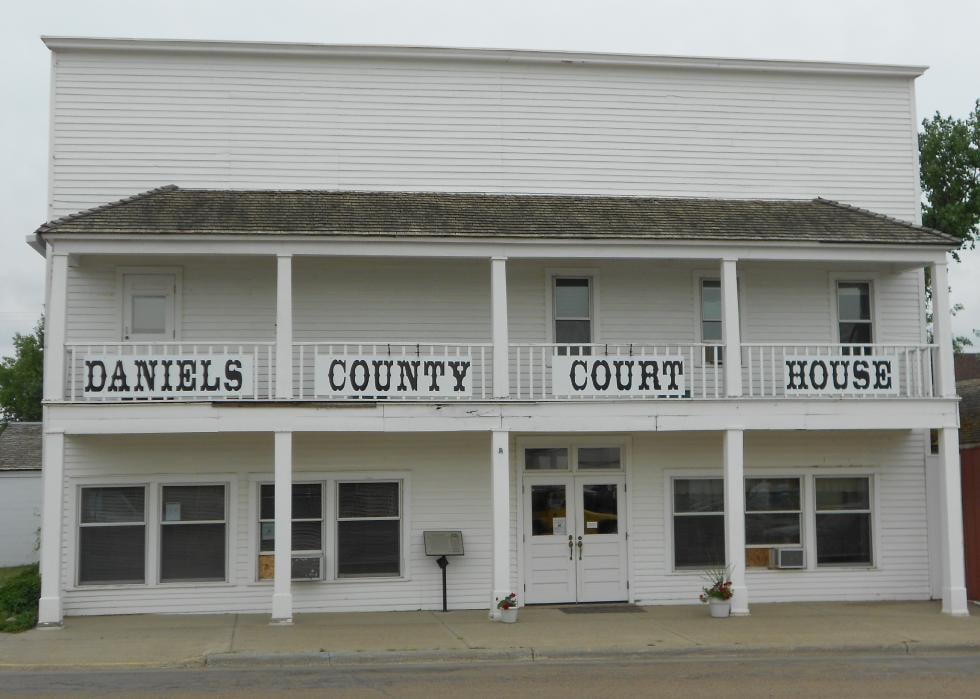
#11. Daniels County

Canva

10 / 20

#11. Daniels County

- Bridges in poor condition: 11.1% (4 of 36 bridges)
- Square meters of bridges in poor condition: 7.1% (508 of 7,156 square meters of bridges)

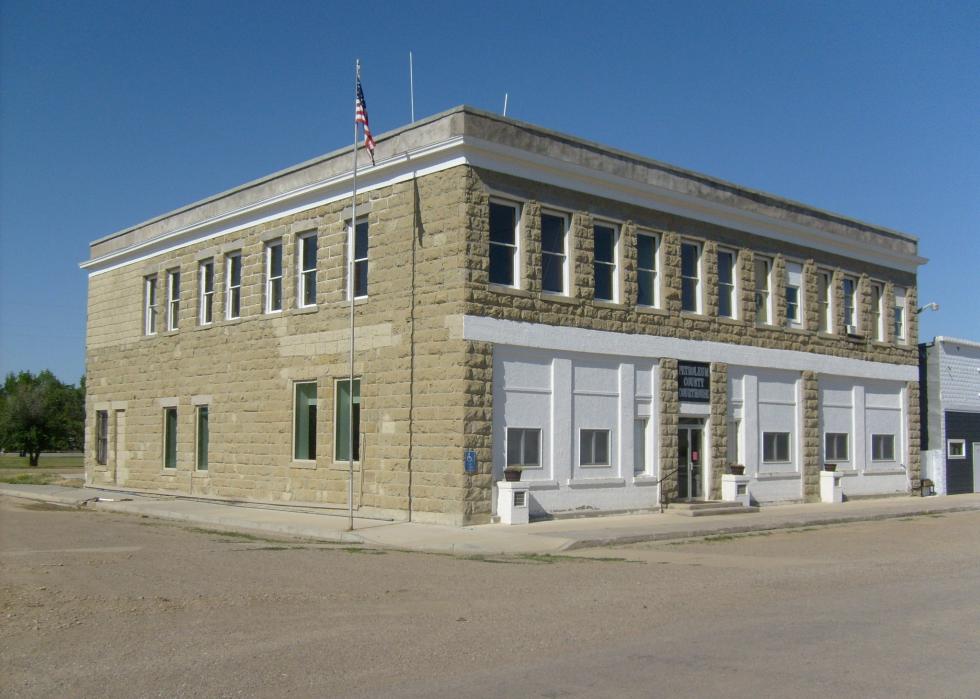
#10. Petroleum County

Canva

11 / 20

#10. Petroleum County

- Bridges in poor condition: 12.0% (3 of 25 bridges)
- Square meters of bridges in poor condition: 5.7% (268 of 4,710 square meters of bridges)

#9. Carter County

Teresa Otto // Shutterstock

12 / 20

#9. Carter County

- Bridges in poor condition: 12.5% (5 of 40 bridges)
- Square meters of bridges in poor condition: 6.0% (529 of 8,819 square meters of bridges)

#8. Meagher County

Canva

13 / 20

#8. Meagher County

- Bridges in poor condition: 13.0% (7 of 54 bridges)
- Square meters of bridges in poor condition: 5.8% (395 of 6,824 square meters of bridges)

#7. Park County

Canva

14 / 20

#7. Park County

- Bridges in poor condition: 13.0% (16 of 123 bridges)
- Square meters of bridges in poor condition: 7.4% (3,067 of 41,440 square meters of bridges)

#6. Valley County

Laurens Hoddenbagh // Shutterstock

15 / 20

#6. Valley County

- Bridges in poor condition: 13.1% (14 of 107 bridges)
- Square meters of bridges in poor condition: 9.5% (3,061 of 32,085 square meters of bridges)

#5. Treasure County

Benjamin Clapp // Shutterstock

16 / 20

#5. Treasure County

- Bridges in poor condition: 13.3% (4 of 30 bridges)
- Square meters of bridges in poor condition: 4.1% (428 of 10,335 square meters of bridges)

#4. Granite County

Canva

17 / 20

#4. Granite County

- Bridges in poor condition: 13.7% (10 of 73 bridges)
- Square meters of bridges in poor condition: 26.7% (5,628 of 21,068 square meters of bridges)

#3. Judith Basin County

Canva

18 / 20

#3. Judith Basin County

- Bridges in poor condition: 14.3% (7 of 49 bridges)
- Square meters of bridges in poor condition: 3.5% (326 of 9,363 square meters of bridges)

#2. Lincoln County

melissamn // Shutterstock

19 / 20

#2. Lincoln County

- Bridges in poor condition: 14.8% (28 of 189 bridges)
- Square meters of bridges in poor condition: 11.4% (6,425 of 56,418 square meters of bridges)

#1. Lake County

Canva

20 / 20

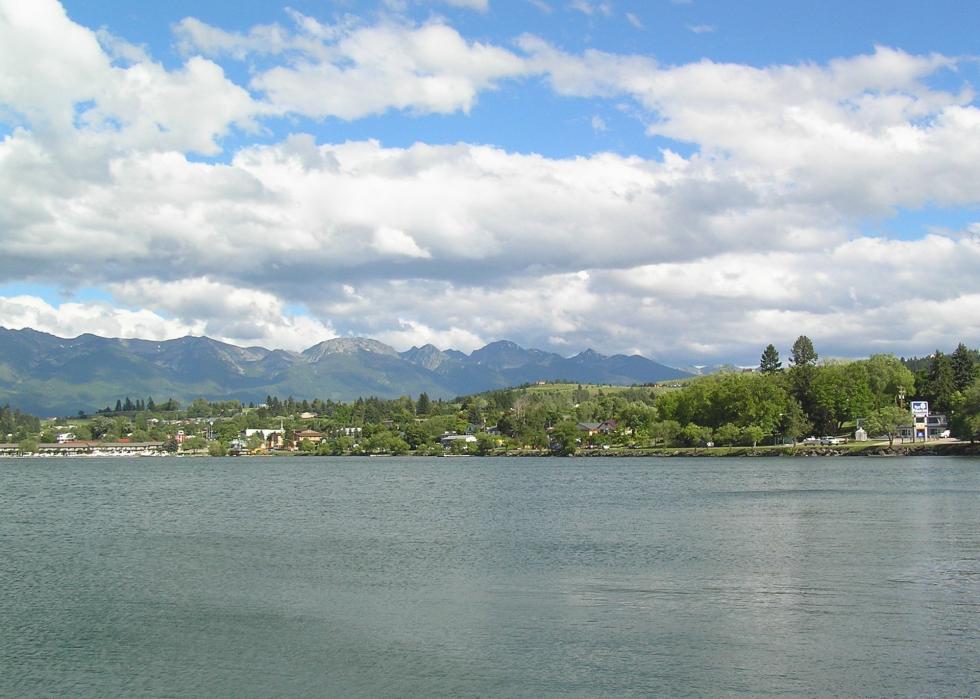
#1. Lake County

- Bridges in poor condition: 19.2% (23 of 120 bridges)
- Square meters of bridges in poor condition: 8.3% (2,204 of 26,420 square meters of bridges)