Wettest counties in Montana

·Stacker

Danita Delimont // Shutterstock

Rain, sleet, snow, hail, wintry mix. Precipitation takes on many forms, and the degree to which climate change affects precipitation levels comes down to something almost everyone learns about in school—Earth's water cycle. A system in endless motion, the water cycle traces the process through which water exists in its three primary phases—liquid, solid, and gas—as it moves perpetually between the Earth and its atmosphere.

Increases in precipitation frequency and intensity are markers of climate change. When temperatures rise and oceans grow warmer, the amount of water that evaporates into the atmosphere—and the speed at which it does so—also increases. As atmospheric circulation carries the moisture-rich air over land or pushes it into a storm system, heavy rain or snow is often the result.

The continental U.S. on average received about 30 inches of precipitation between March 2022 and February 2023. Traditionally "wet" regions—such as Washington state and Alaska in the northwest and Georgia and Mississippi in the southeast—continue to have some of the rainiest counties in the United States. Other areas such as Oklahoma, Kansas, and Nebraska, as well as pockets of the South and of California, experience the opposite extreme: drought, also largely a product of climate change.

Stacker cited data from the National Centers for Environmental Information to identify the counties in Montana that receive the most precipitation through rain, sleet, or snow. Counties are ranked by five-year precipitation averages in inches as of February 2023 with rainfall over the past year serving as a tiebreaker. Supplementary data on how last year's precipitation compares to the 100-year average for the area is also included.

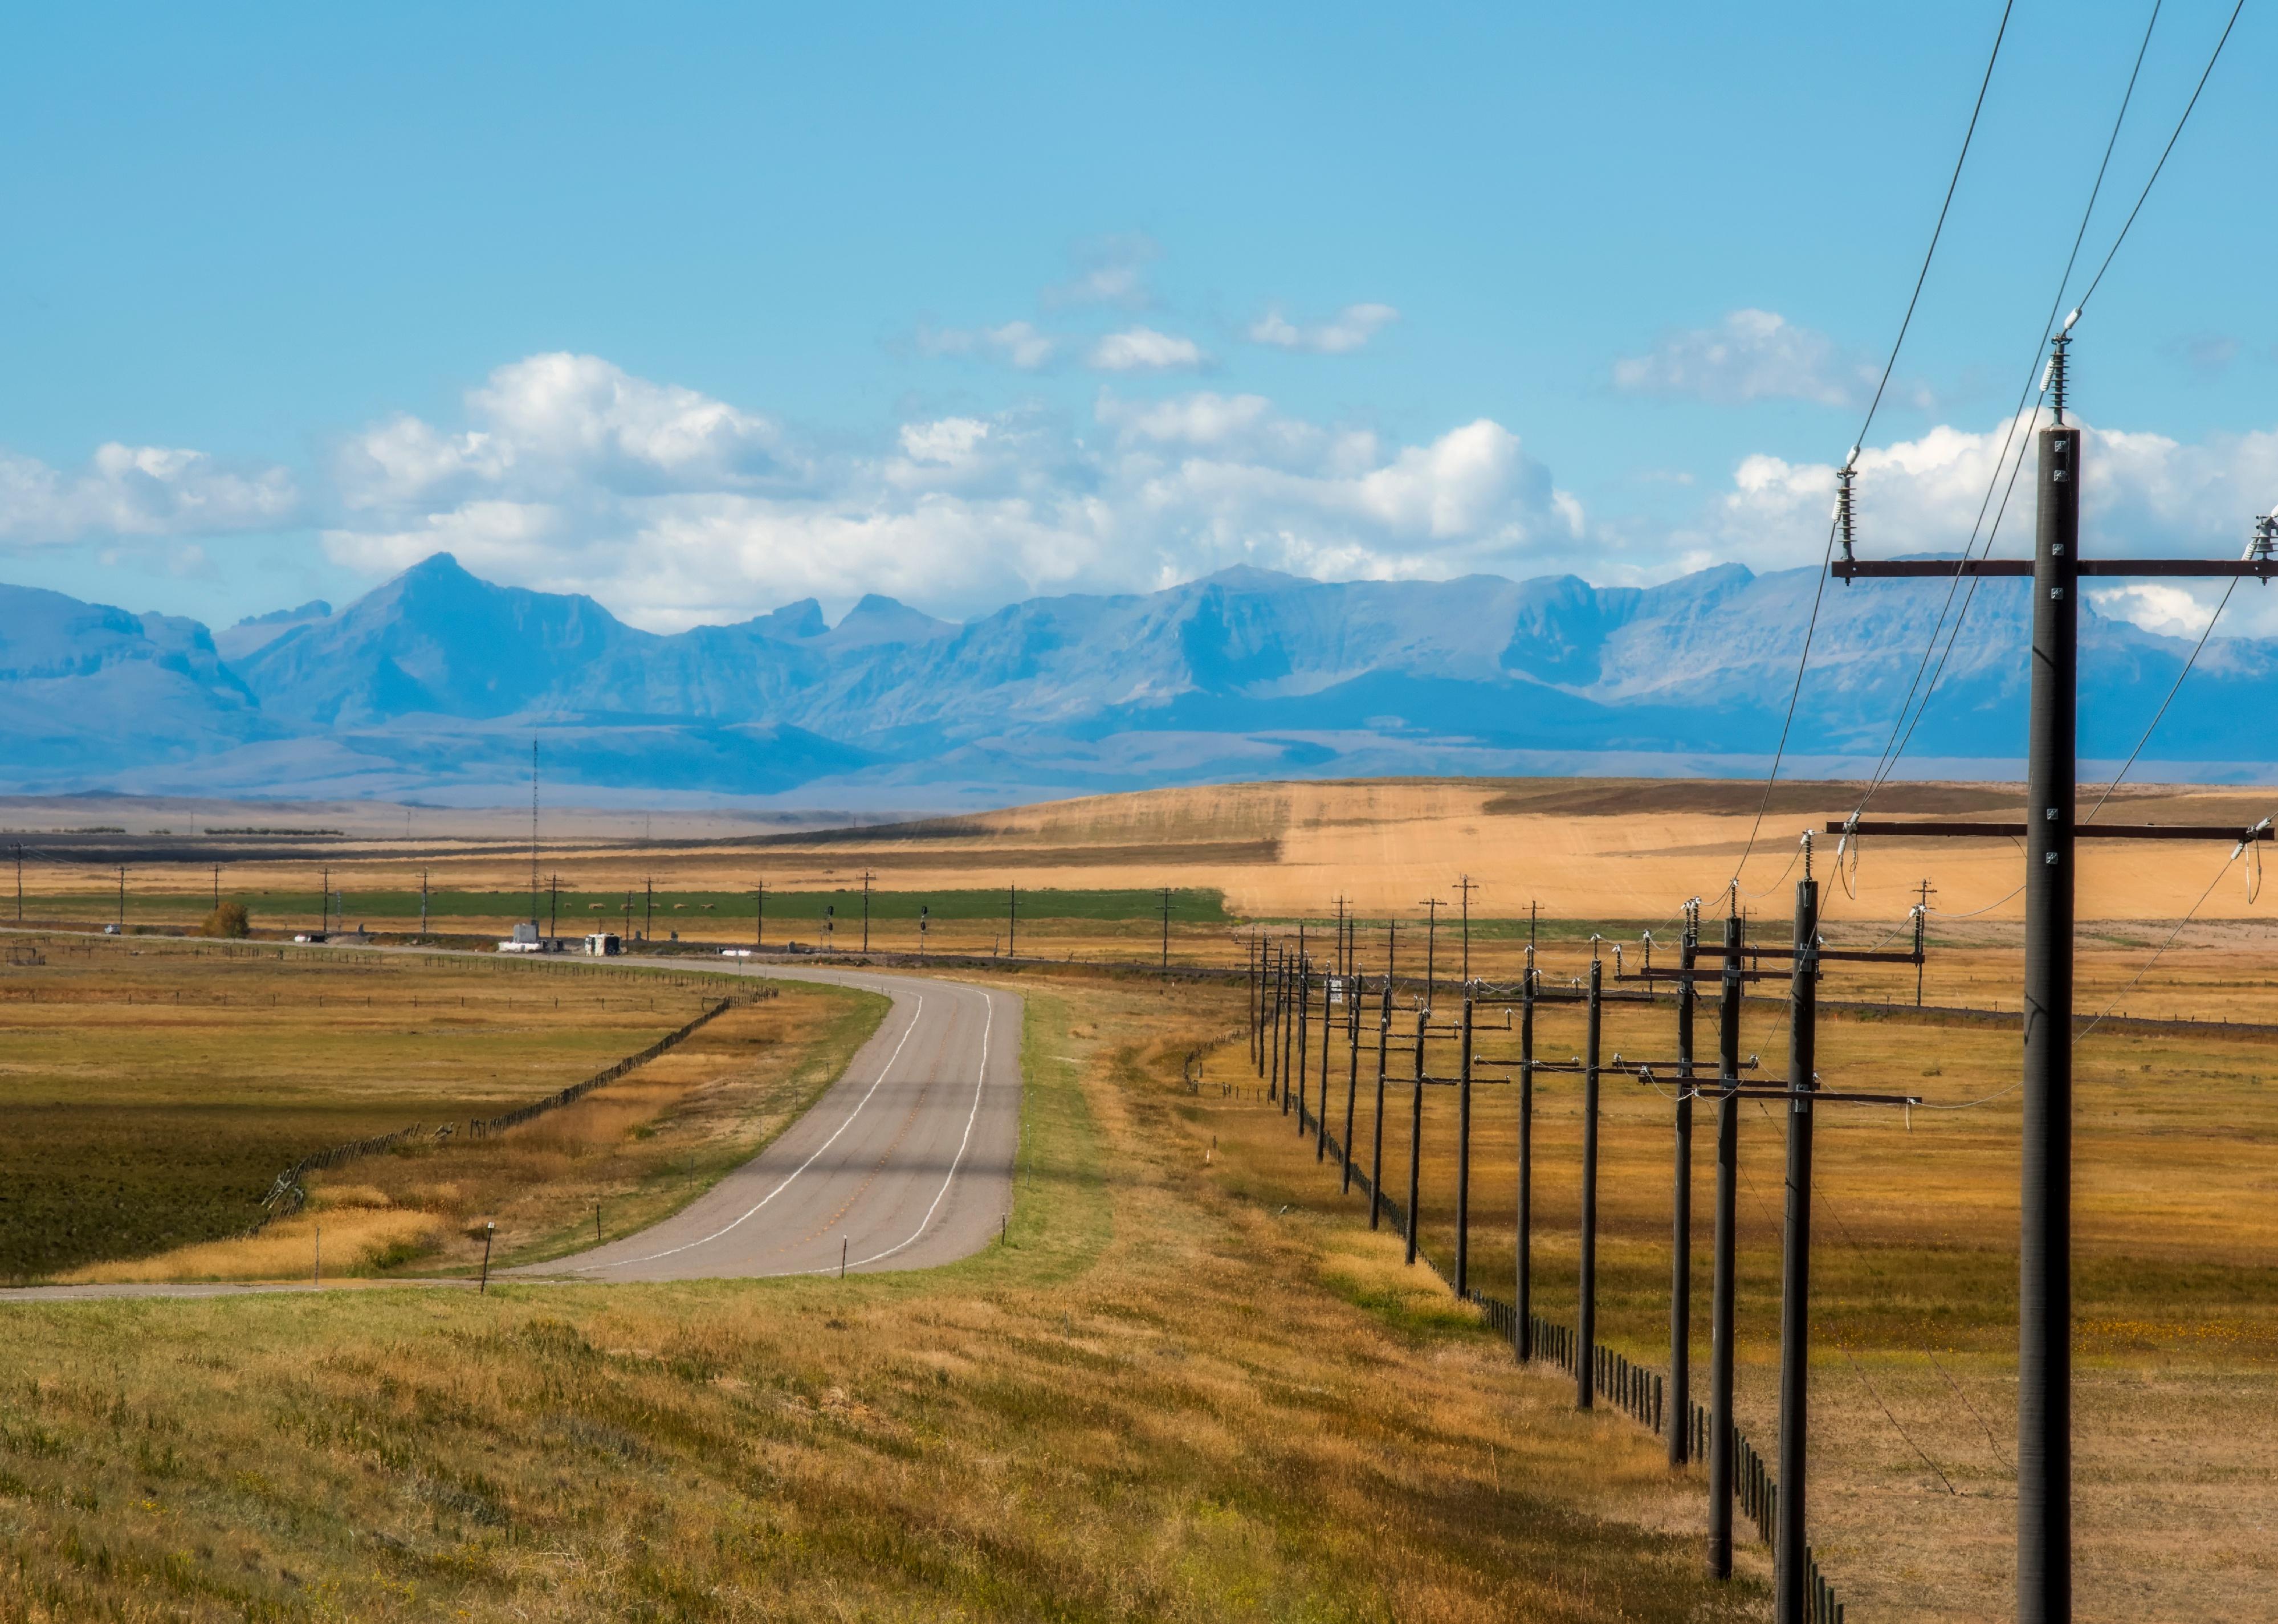
#50. Chouteau County
Canva

1 / 50

#50. Chouteau County

- Five-year precipitation average: 12.40 inches
- Precipitation over the past year: 13.08 inches (#53 rainiest year since 1895)
- Precipitation compared to 1901-2000 average: -0.72 inches below norm
#49. McCone County

Canva

2 / 50

#49. McCone County

- Five-year precipitation average: 12.58 inches
- Precipitation over the past year: 11.82 inches (#44 rainiest year since 1895)
- Precipitation compared to 1901-2000 average: -0.97 inches below norm
#48. Blaine County

Canva

3 / 50

#48. Blaine County

- Five-year precipitation average: 12.71 inches
- Precipitation over the past year: 14.14 inches (#73 rainiest year since 1895)
- Precipitation compared to 1901-2000 average: 0.53 inches above norm
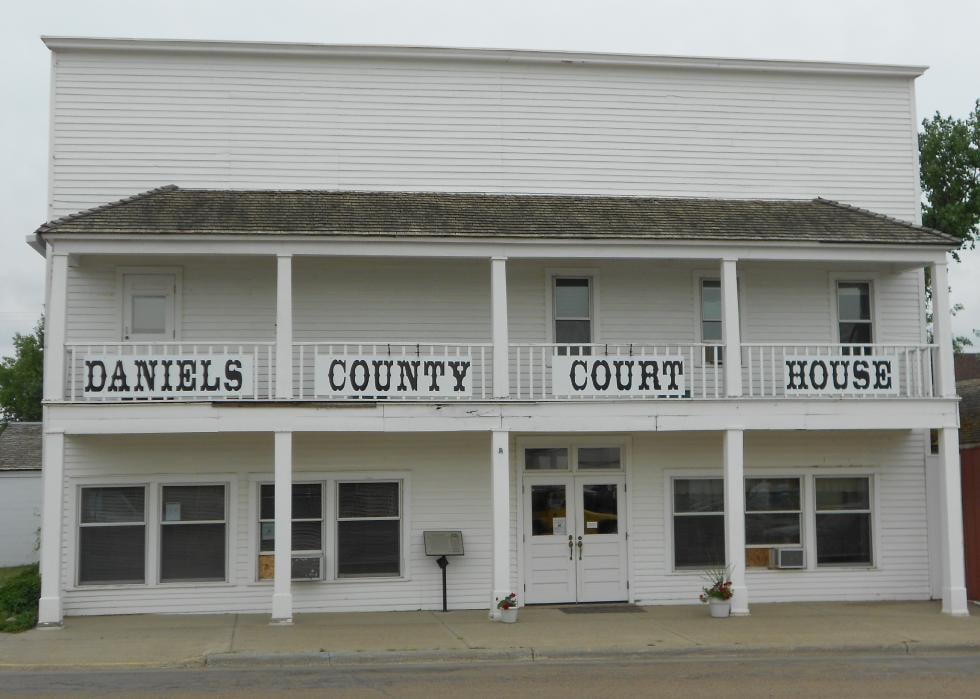
#47. Daniels County

Canva

4 / 50

#47. Daniels County

- Five-year precipitation average: 12.79 inches
- Precipitation over the past year: 11.82 inches (#42 rainiest year since 1895)
- Precipitation compared to 1901-2000 average: -1.43 inches below norm
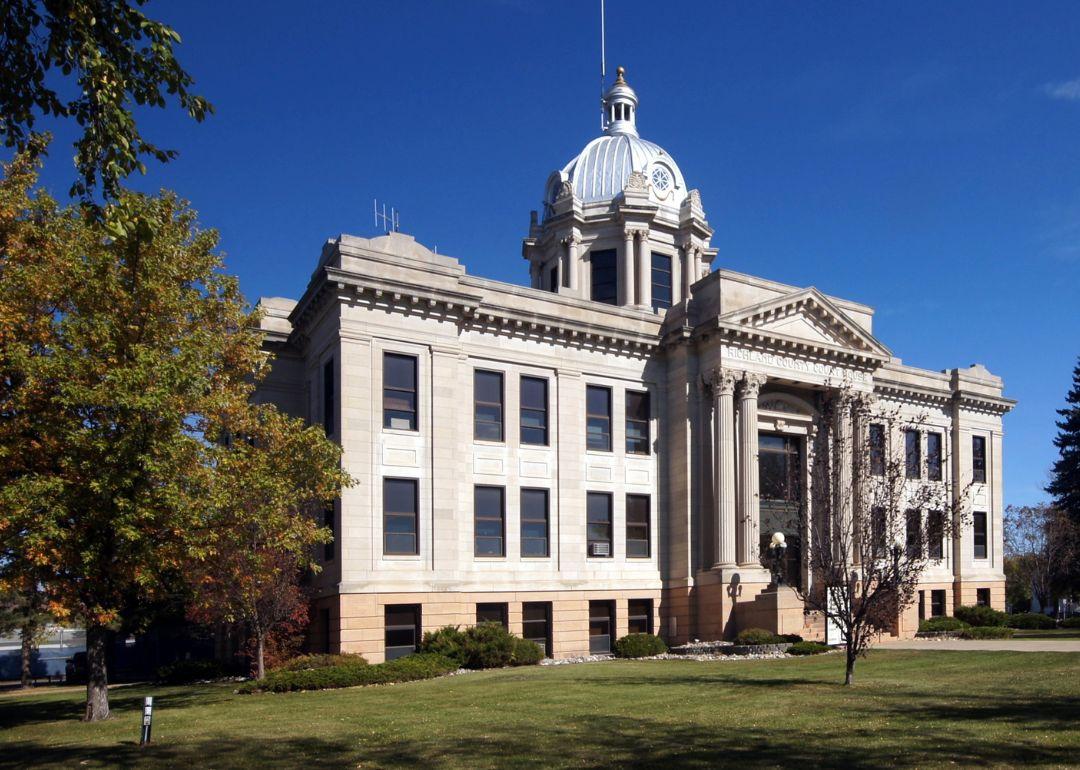
#46. Richland County

Canva

5 / 50

#46. Richland County

- Five-year precipitation average: 13.13 inches
- Precipitation over the past year: 14.05 inches (#66 rainiest year since 1895)
- Precipitation compared to 1901-2000 average: 0.39 inches above norm
#45. Prairie County

Canva

6 / 50

#45. Prairie County

- Five-year precipitation average: 13.38 inches
- Precipitation over the past year: 14.42 inches (#89 rainiest year since 1895)
- Precipitation compared to 1901-2000 average: 1.65 inches above norm
#44. Garfield County

Canva

7 / 50

#44. Garfield County

- Five-year precipitation average: 13.40 inches
- Precipitation over the past year: 12.95 inches (#67 rainiest year since 1895)
- Precipitation compared to 1901-2000 average: 0.24 inches above norm
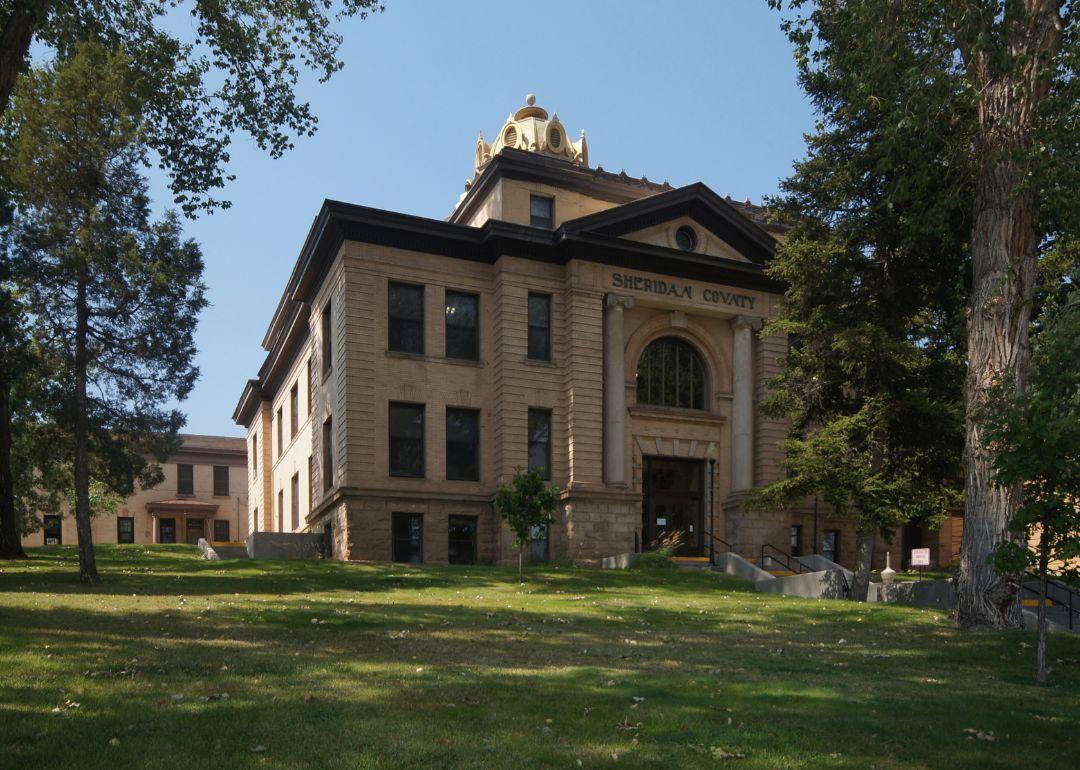
#43. Sheridan County

Canva

8 / 50

#43. Sheridan County

- Five-year precipitation average: 13.60 inches
- Precipitation over the past year: 13.43 inches (#62 rainiest year since 1895)
- Precipitation compared to 1901-2000 average: -0.37 inches below norm
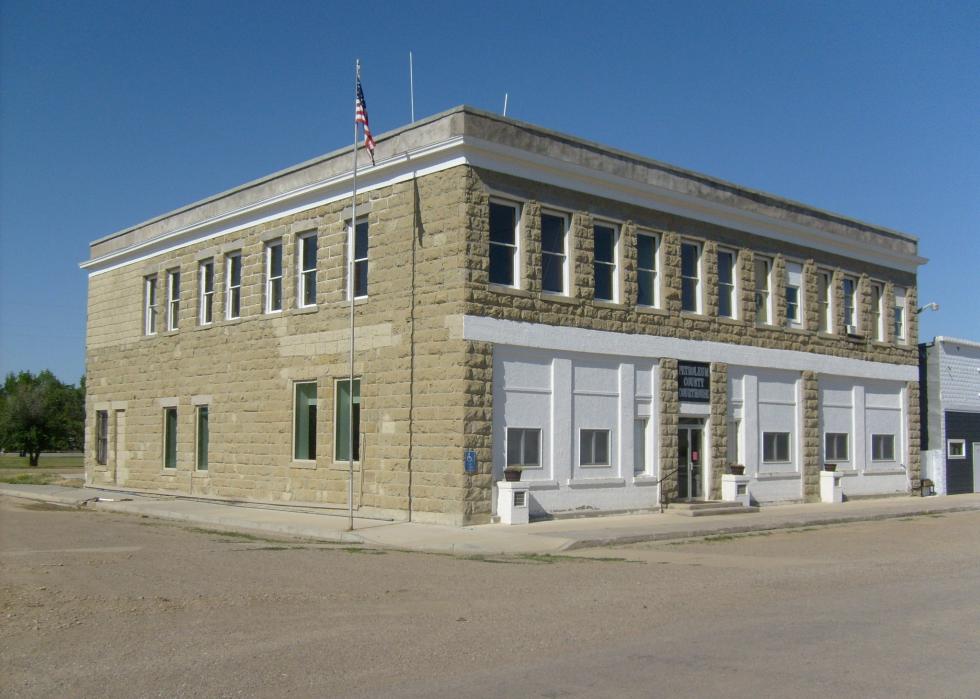
#42. Petroleum County

Canva

9 / 50

#42. Petroleum County

- Five-year precipitation average: 13.86 inches
- Precipitation over the past year: 15.00 inches (#91 rainiest year since 1895)
- Precipitation compared to 1901-2000 average: 1.94 inches above norm
#41. Custer County

Canva

10 / 50

#41. Custer County

- Five-year precipitation average: 14.01 inches
- Precipitation over the past year: 14.79 inches (#84 rainiest year since 1895)
- Precipitation compared to 1901-2000 average: 1.19 inches above norm
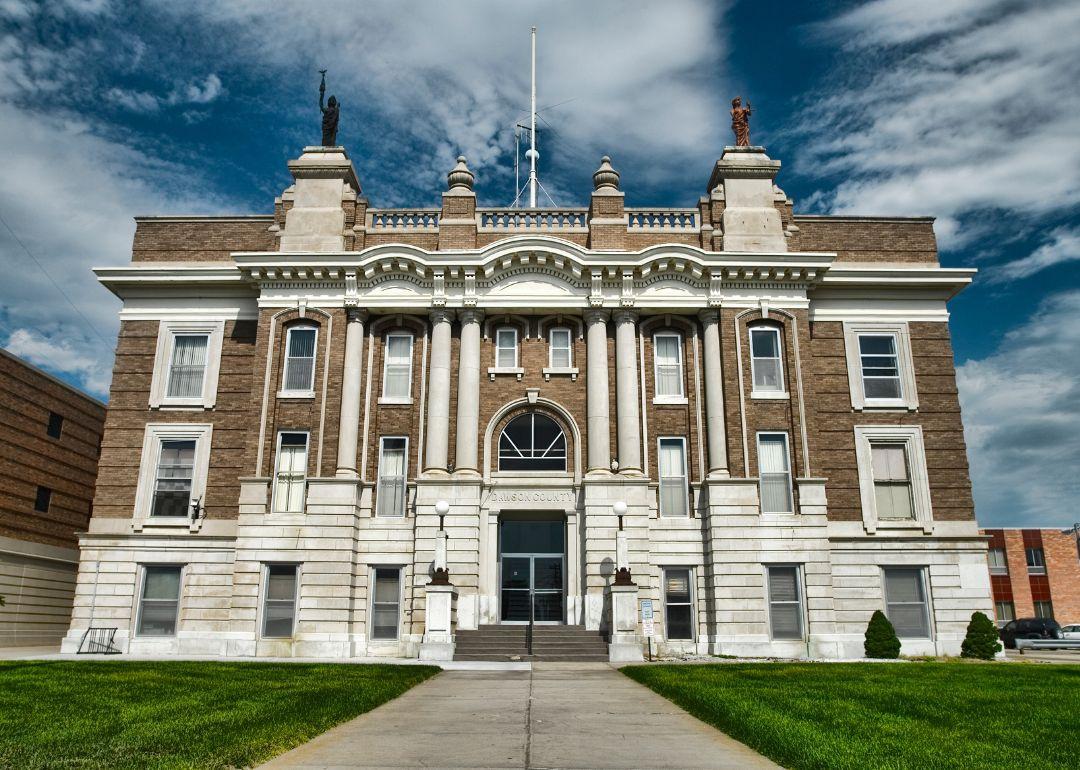
#40. Dawson County

Canva

11 / 50

#40. Dawson County

- Five-year precipitation average: 14.09 inches
- Precipitation over the past year: 14.87 inches (#86 rainiest year since 1895)
- Precipitation compared to 1901-2000 average: 1.62 inches above norm
#39. Broadwater County

Canva

12 / 50

#39. Broadwater County

- Five-year precipitation average: 14.52 inches
- Precipitation over the past year: 16.39 inches (#80 rainiest year since 1895)
- Precipitation compared to 1901-2000 average: 0.32 inches above norm
#38. Rosebud County

Logan Bush // Shutterstock

13 / 50

#38. Rosebud County

- Five-year precipitation average: 14.75 inches
- Precipitation over the past year: 14.82 inches (#86 rainiest year since 1895)
- Precipitation compared to 1901-2000 average: 1.19 inches above norm
#37. Fallon County

George Sc // Shutterstock

14 / 50

#37. Fallon County

- Five-year precipitation average: 14.96 inches
- Precipitation over the past year: 15.96 inches (#89 rainiest year since 1895)
- Precipitation compared to 1901-2000 average: 1.86 inches above norm
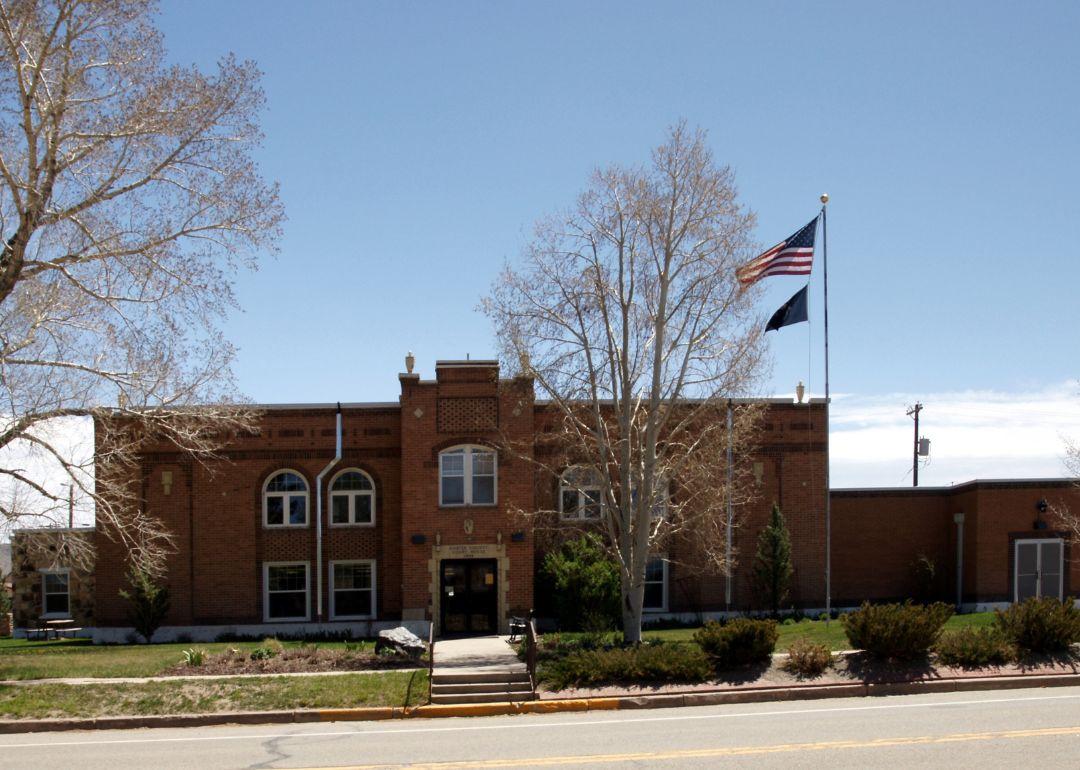
#36. Pondera County

Zack Frank // Shutterstock

15 / 50

#36. Pondera County

- Five-year precipitation average: 15.07 inches
- Precipitation over the past year: 13.35 inches (#26 rainiest year since 1895)
- Precipitation compared to 1901-2000 average: -3.33 inches below norm
#35. Powder River County

Canva

16 / 50

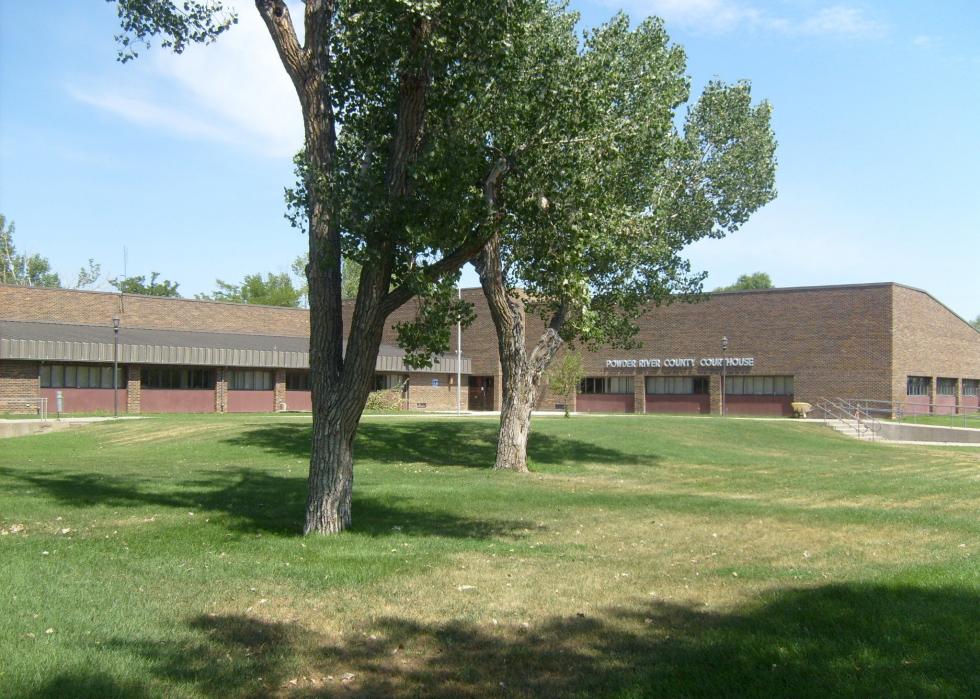
#35. Powder River County

- Five-year precipitation average: 15.07 inches
- Precipitation over the past year: 16.58 inches (#100 rainiest year since 1895)
- Precipitation compared to 1901-2000 average: 1.99 inches above norm
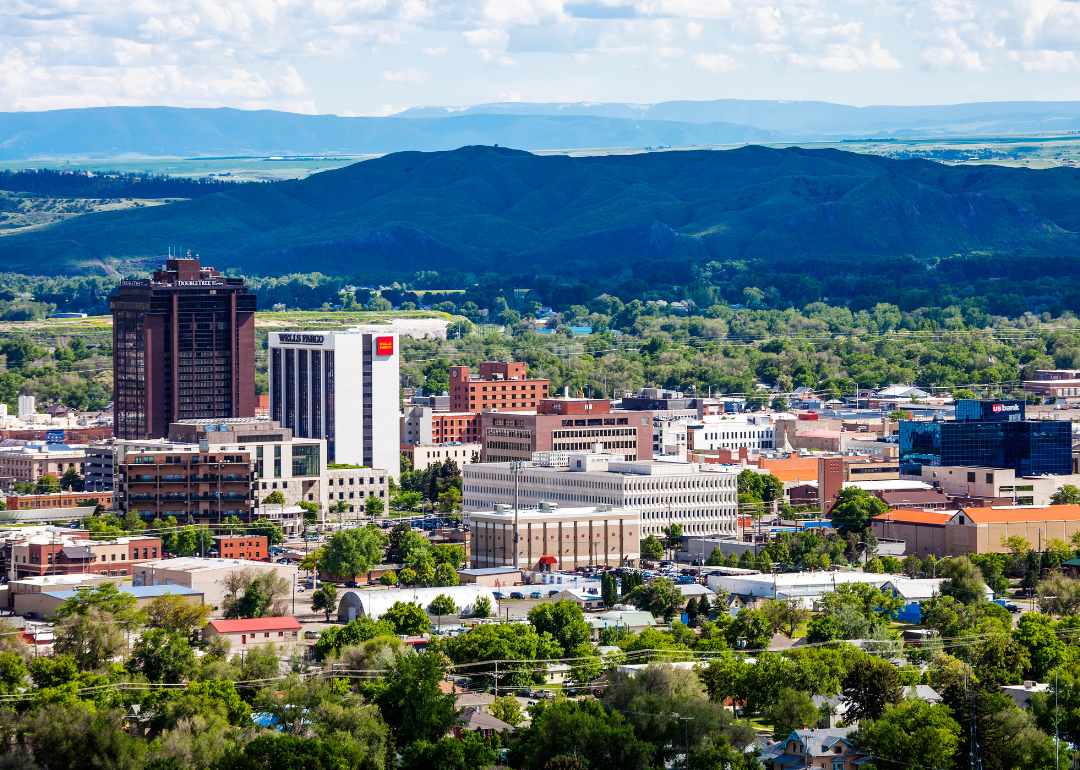
#34. Yellowstone County

Canva

17 / 50

#34. Yellowstone County

- Five-year precipitation average: 15.16 inches
- Precipitation over the past year: 14.66 inches (#83 rainiest year since 1895)
- Precipitation compared to 1901-2000 average: 1.14 inches above norm
#33. Treasure County

Benjamin Clapp // Shutterstock

18 / 50

#33. Treasure County

- Five-year precipitation average: 15.21 inches
- Precipitation over the past year: 15.03 inches (#86 rainiest year since 1895)
- Precipitation compared to 1901-2000 average: 1.51 inches above norm
#32. Wibaux County

Canva

19 / 50

#32. Wibaux County

- Five-year precipitation average: 15.27 inches
- Precipitation over the past year: 16.47 inches (#92 rainiest year since 1895)
- Precipitation compared to 1901-2000 average: 2.15 inches above norm
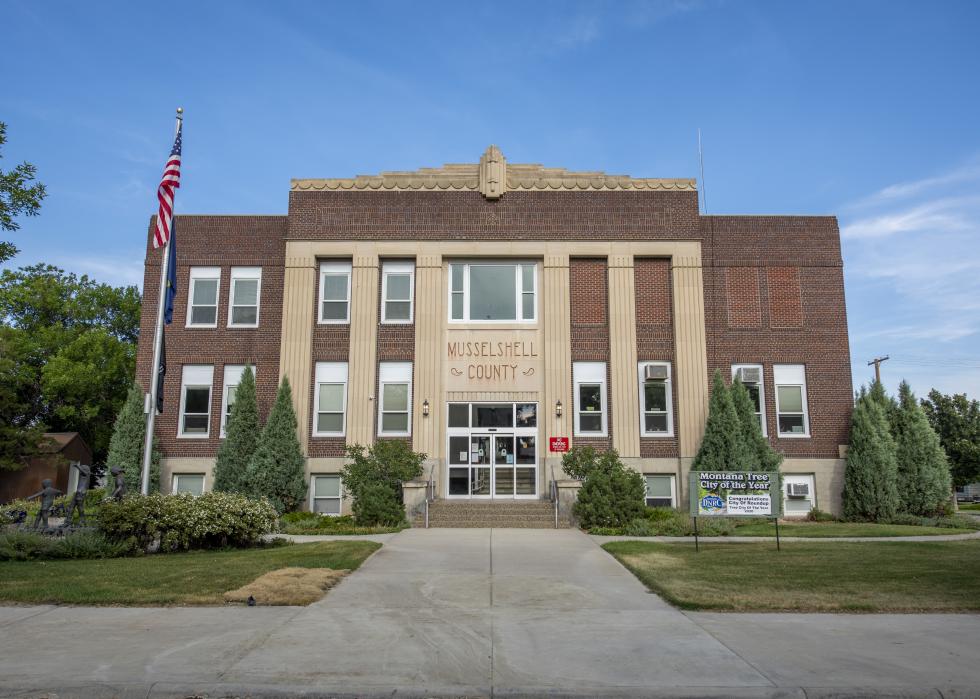
#31. Musselshell County

Canva

20 / 50

#31. Musselshell County

- Five-year precipitation average: 15.31 inches
- Precipitation over the past year: 15.22 inches (#89 rainiest year since 1895)
- Precipitation compared to 1901-2000 average: 1.63 inches above norm
#30. Golden Valley County

Canva

21 / 50

#30. Golden Valley County

- Five-year precipitation average: 15.66 inches
- Precipitation over the past year: 14.92 inches (#76 rainiest year since 1895)
- Precipitation compared to 1901-2000 average: 0.83 inches above norm
#29. Cascade County

Canva

22 / 50

#29. Cascade County

- Five-year precipitation average: 15.67 inches
- Precipitation over the past year: 15.73 inches (#48 rainiest year since 1895)
- Precipitation compared to 1901-2000 average: -1.50 inches below norm
#28. Big Horn County

Canva

23 / 50

#28. Big Horn County

- Five-year precipitation average: 15.86 inches
- Precipitation over the past year: 16.53 inches (#80 rainiest year since 1895)
- Precipitation compared to 1901-2000 average: 1.00 inches above norm
#27. Wheatland County

Canva

24 / 50

#27. Wheatland County

- Five-year precipitation average: 15.87 inches
- Precipitation over the past year: 15.50 inches (#56 rainiest year since 1895)
- Precipitation compared to 1901-2000 average: -0.49 inches below norm
#26. Carter County

Teresa Otto // Shutterstock

25 / 50

#26. Carter County

- Five-year precipitation average: 15.95 inches
- Precipitation over the past year: 16.36 inches (#93 rainiest year since 1895)
- Precipitation compared to 1901-2000 average: 2.06 inches above norm
#25. Fergus County

Canva

26 / 50

#25. Fergus County

- Five-year precipitation average: 16.03 inches
- Precipitation over the past year: 17.78 inches (#84 rainiest year since 1895)
- Precipitation compared to 1901-2000 average: 1.44 inches above norm
#24. Jefferson County

davidrh // Shutterstock

27 / 50

#24. Jefferson County

- Five-year precipitation average: 16.40 inches
- Precipitation over the past year: 16.72 inches (#44 rainiest year since 1895)
- Precipitation compared to 1901-2000 average: -1.78 inches below norm
#23. Teton County

Ian William Hromada // Shutterstock

28 / 50

#23. Teton County

- Five-year precipitation average: 16.60 inches
- Precipitation over the past year: 14.74 inches (#28 rainiest year since 1895)
- Precipitation compared to 1901-2000 average: -3.17 inches below norm
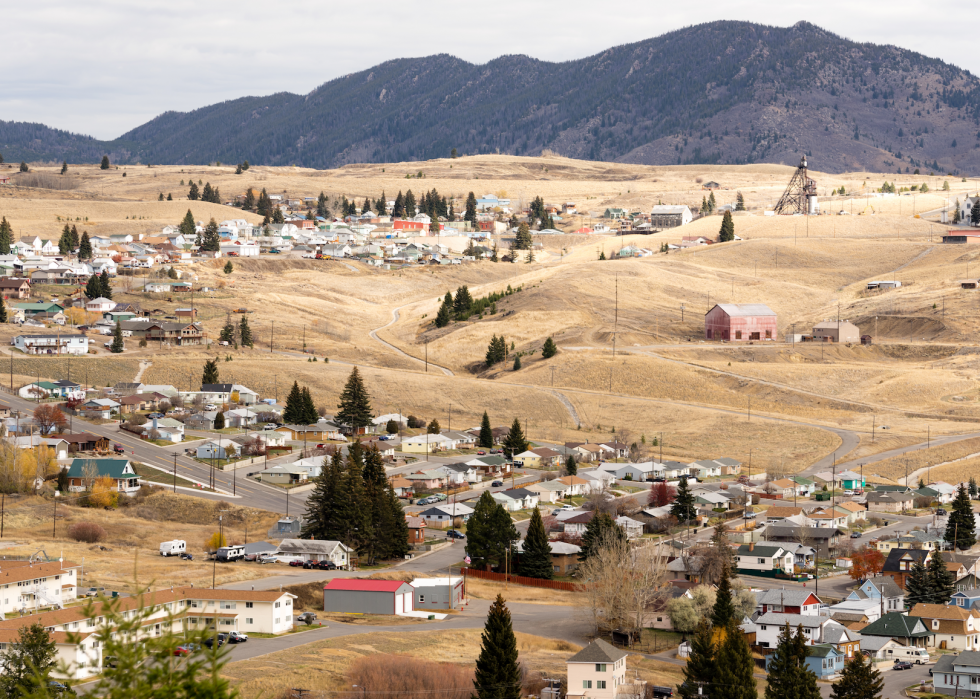
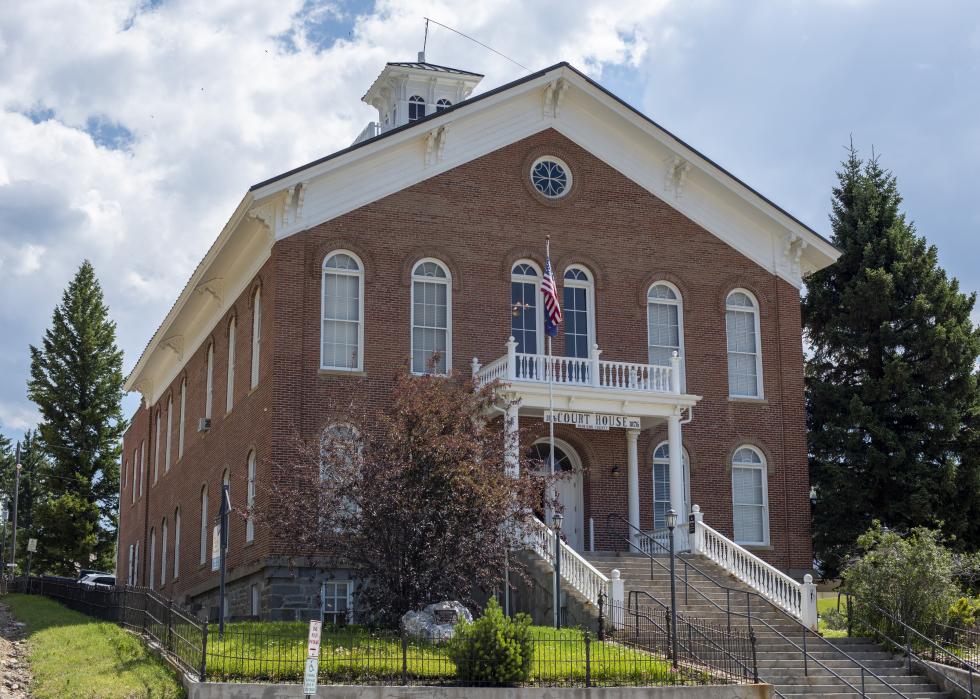
#22. Silver Bow County

Christopher Boswell // Shutterstock

29 / 50

#22. Silver Bow County

- Five-year precipitation average: 16.77 inches
- Precipitation over the past year: 15.05 inches (#24 rainiest year since 1895)
- Precipitation compared to 1901-2000 average: -3.67 inches below norm
#21. Carbon County

Canva

30 / 50

#21. Carbon County

- Five-year precipitation average: 17.44 inches
- Precipitation over the past year: 17.98 inches (#70 rainiest year since 1895)
- Precipitation compared to 1901-2000 average: 0.42 inches above norm
#20. Judith Basin County

Canva

31 / 50

#20. Judith Basin County

- Five-year precipitation average: 17.82 inches
- Precipitation over the past year: 18.38 inches (#54 rainiest year since 1895)
- Precipitation compared to 1901-2000 average: -1.41 inches below norm
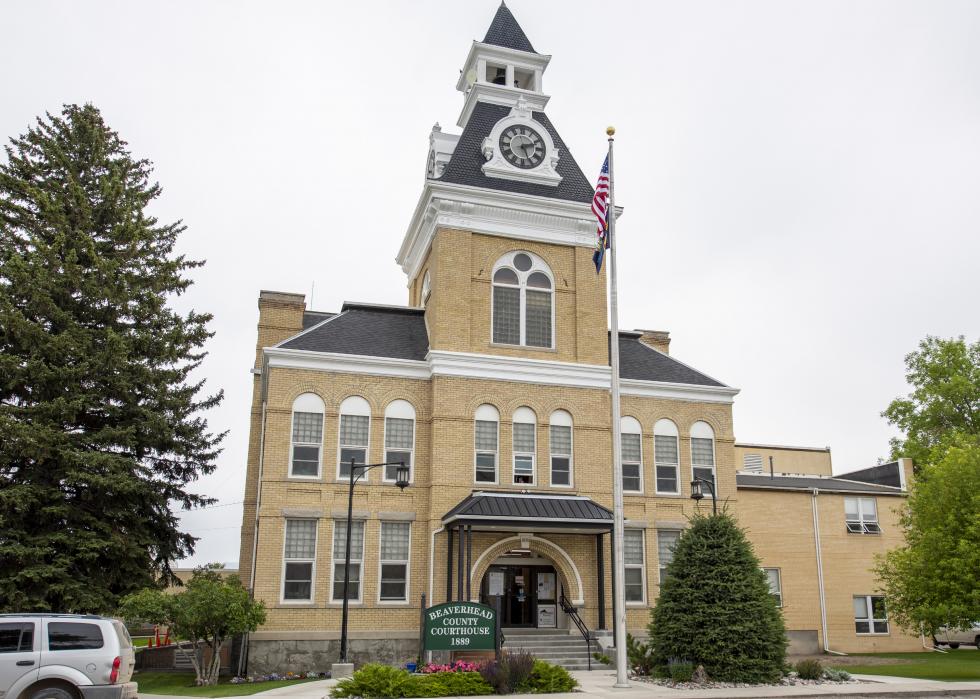
#19. Beaverhead County

Canva

32 / 50

#19. Beaverhead County

- Five-year precipitation average: 18.33 inches
- Precipitation over the past year: 18.53 inches (#37 rainiest year since 1895)
- Precipitation compared to 1901-2000 average: -2.81 inches below norm
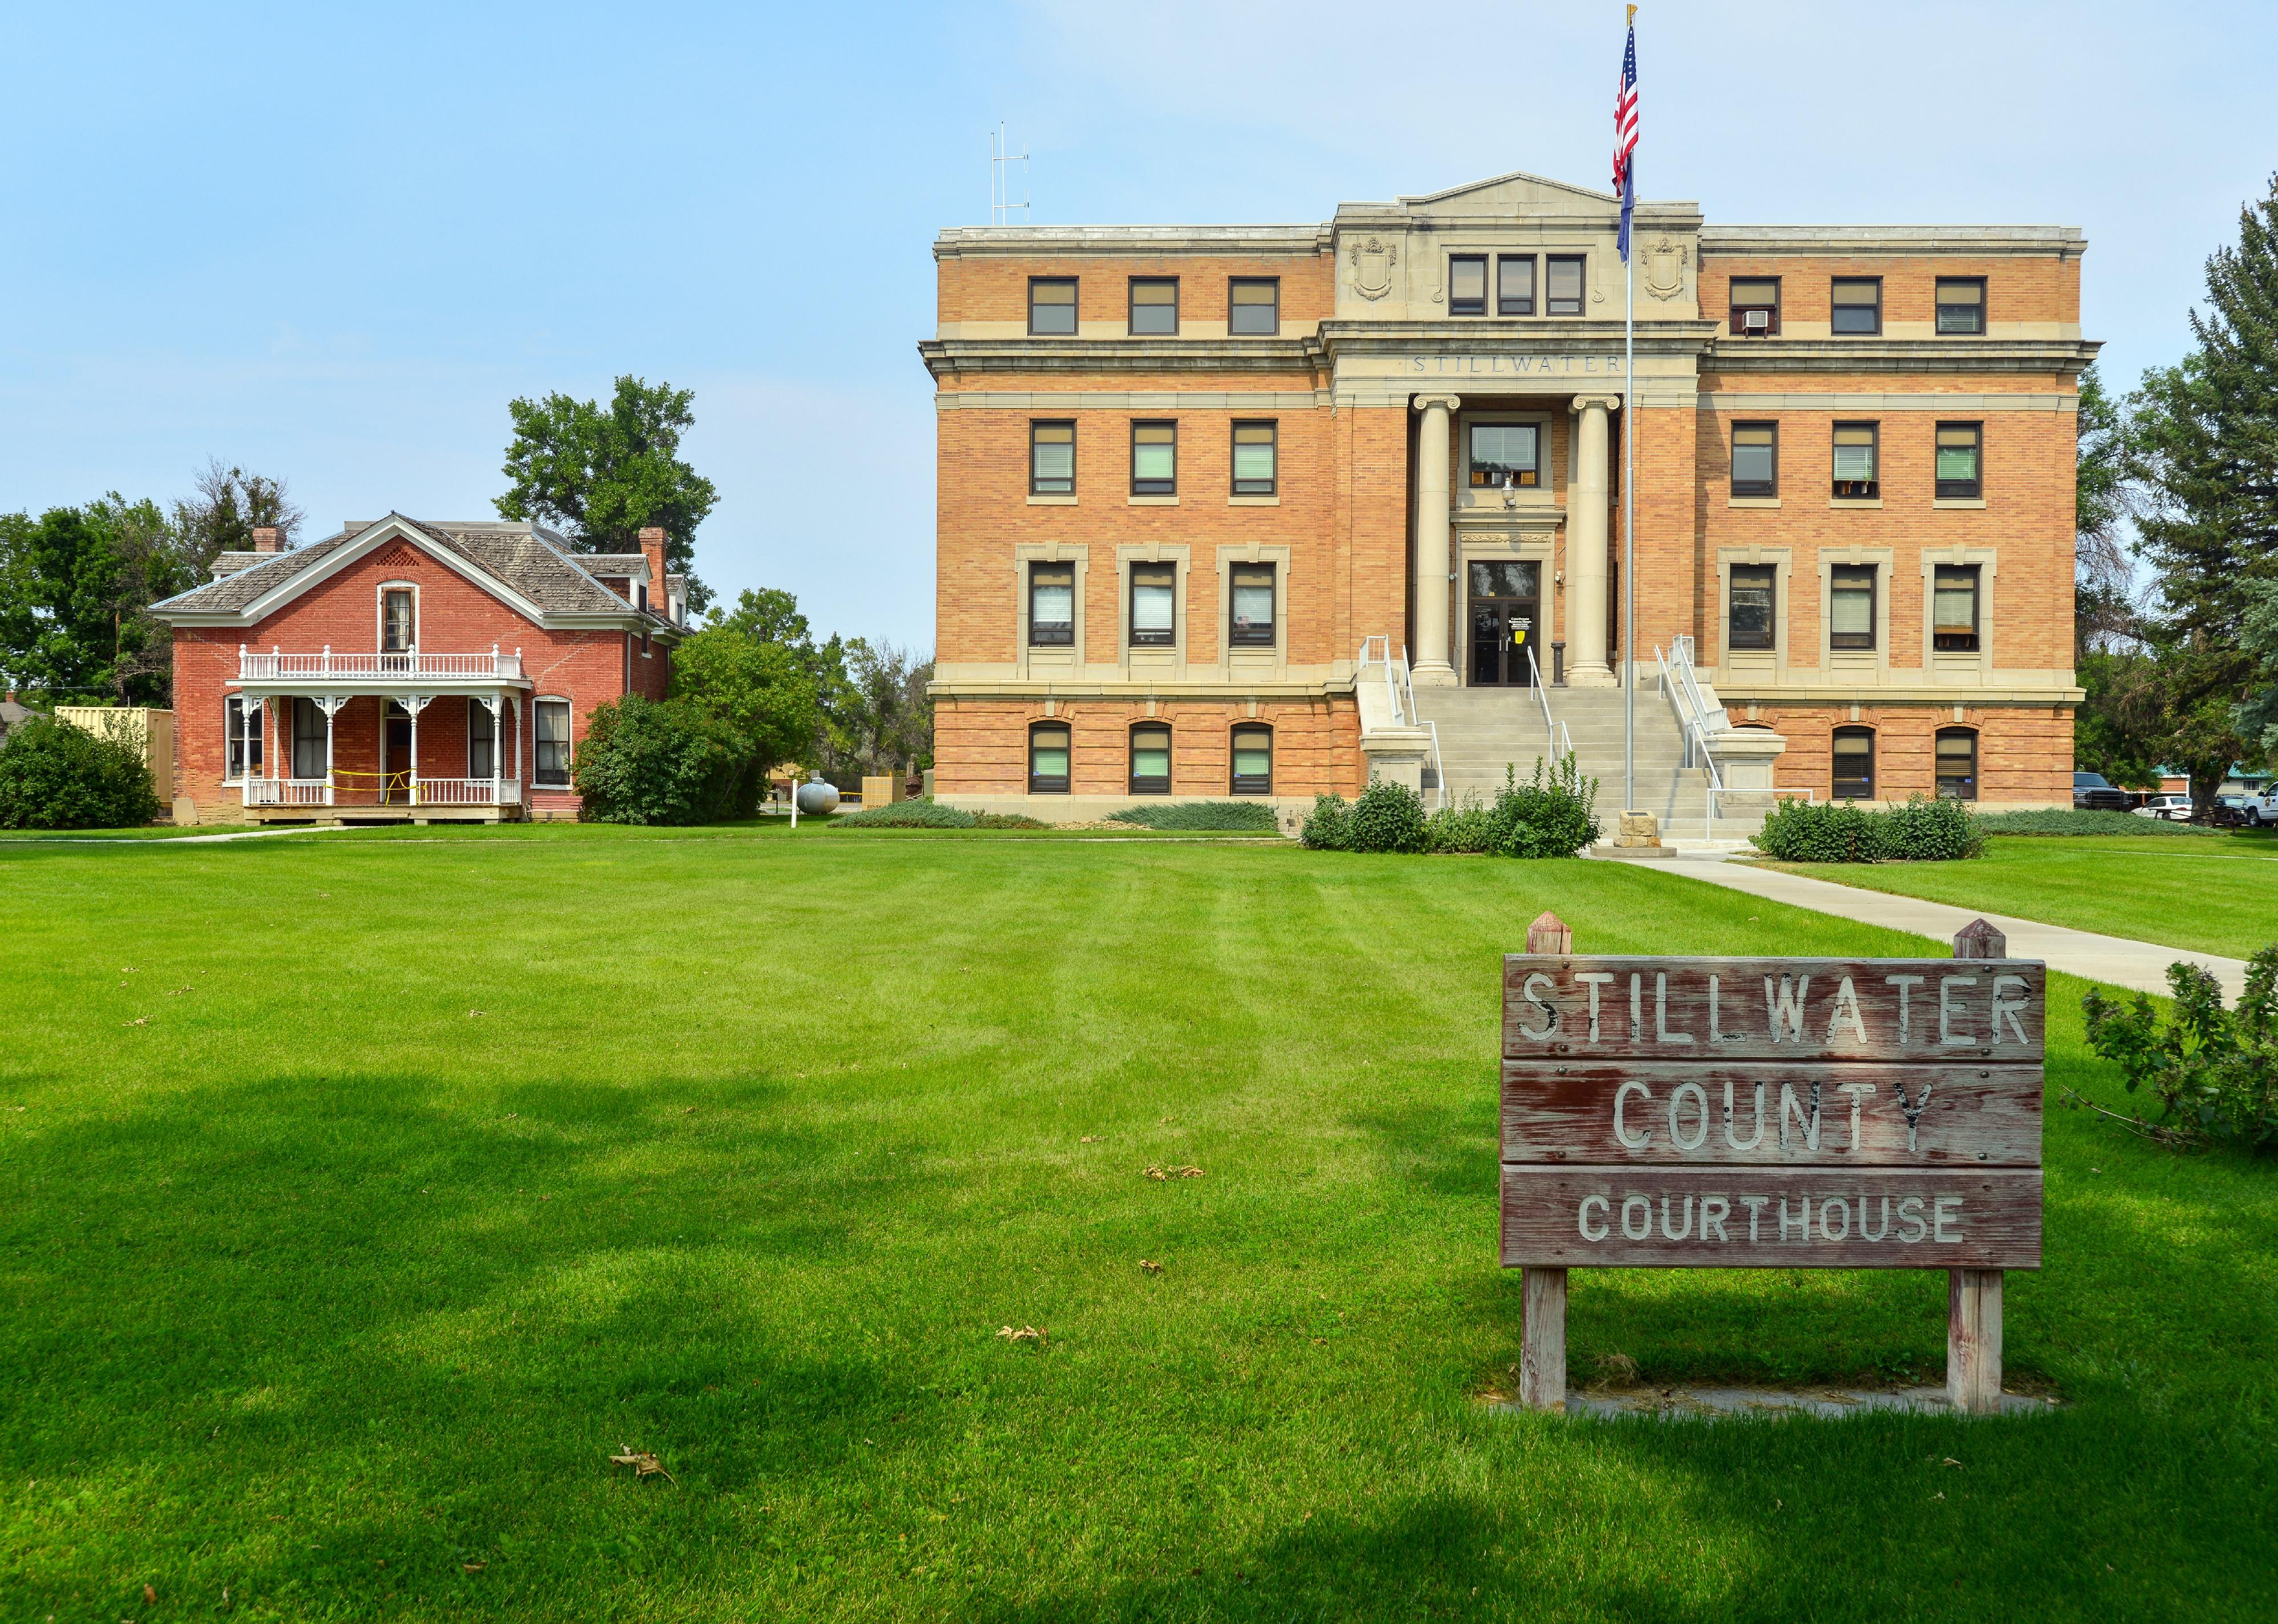
#18. Stillwater County

davidrh // Shutterstock

33 / 50

#18. Stillwater County

- Five-year precipitation average: 19.16 inches
- Precipitation over the past year: 19.59 inches (#88 rainiest year since 1895)
- Precipitation compared to 1901-2000 average: 1.69 inches above norm
#17. Sweet Grass County

Canva

34 / 50

#17. Sweet Grass County

- Five-year precipitation average: 19.31 inches
- Precipitation over the past year: 19.78 inches (#78 rainiest year since 1895)
- Precipitation compared to 1901-2000 average: 1.02 inches above norm
#16. Meagher County

Canva

35 / 50

#16. Meagher County

- Five-year precipitation average: 19.33 inches
- Precipitation over the past year: 21.42 inches (#68 rainiest year since 1895)
- Precipitation compared to 1901-2000 average: -0.55 inches below norm
#15. Deer Lodge County

Canva

36 / 50

#15. Deer Lodge County

- Five-year precipitation average: 21.38 inches
- Precipitation over the past year: 19.75 inches (#45 rainiest year since 1895)
- Precipitation compared to 1901-2000 average: -3.08 inches below norm
#14. Glacier County

Dirk Wierenga // Shutterstock

37 / 50

#14. Glacier County

- Five-year precipitation average: 21.64 inches
- Precipitation over the past year: 21.96 inches (#37 rainiest year since 1895)
- Precipitation compared to 1901-2000 average: -3.54 inches below norm
#13. Lewis and Clark County

Canva

38 / 50

#13. Lewis and Clark County

- Five-year precipitation average: 22.02 inches
- Precipitation over the past year: 21.49 inches (#57 rainiest year since 1895)
- Precipitation compared to 1901-2000 average: -1.50 inches below norm
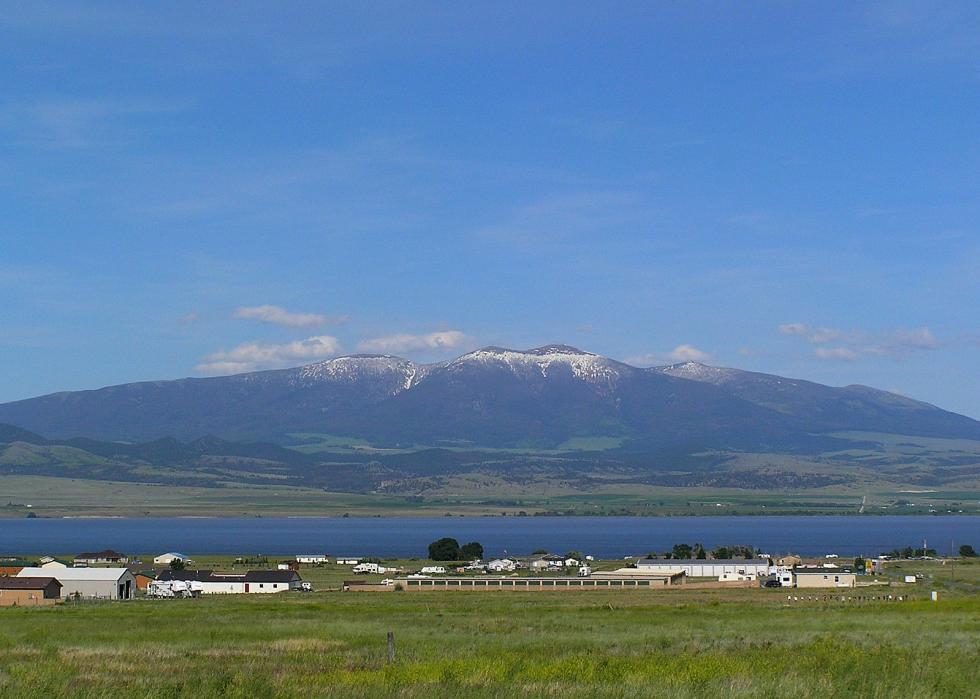
#12. Madison County

Canva

39 / 50

#12. Madison County

- Five-year precipitation average: 22.12 inches
- Precipitation over the past year: 24.80 inches (#90 rainiest year since 1895)
- Precipitation compared to 1901-2000 average: 1.70 inches above norm
#11. Granite County

Canva

40 / 50

#11. Granite County

- Five-year precipitation average: 22.36 inches
- Precipitation over the past year: 20.30 inches (#27 rainiest year since 1895)
- Precipitation compared to 1901-2000 average: -4.28 inches below norm
#10. Gallatin County

Canva

41 / 50

#10. Gallatin County

- Five-year precipitation average: 23.41 inches
- Precipitation over the past year: 25.30 inches (#83 rainiest year since 1895)
- Precipitation compared to 1901-2000 average: 1.02 inches above norm
#9. Lake County

Canva

42 / 50

#9. Lake County

- Five-year precipitation average: 24.20 inches
- Precipitation over the past year: 25.84 inches (#77 rainiest year since 1895)
- Precipitation compared to 1901-2000 average: 0.81 inches above norm
#8. Park County

Canva

43 / 50

#8. Park County

- Five-year precipitation average: 26.01 inches
- Precipitation over the past year: 29.60 inches (#107 rainiest year since 1895)
- Precipitation compared to 1901-2000 average: 3.37 inches above norm
#7. Powell County

Canva

44 / 50

#7. Powell County

- Five-year precipitation average: 26.12 inches
- Precipitation over the past year: 25.02 inches (#49 rainiest year since 1895)
- Precipitation compared to 1901-2000 average: -1.74 inches below norm
#6. Ravalli County

TylorOlsen // Shutterstock

45 / 50

#6. Ravalli County

- Five-year precipitation average: 26.87 inches
- Precipitation over the past year: 24.53 inches (#29 rainiest year since 1895)
- Precipitation compared to 1901-2000 average: -5.04 inches below norm
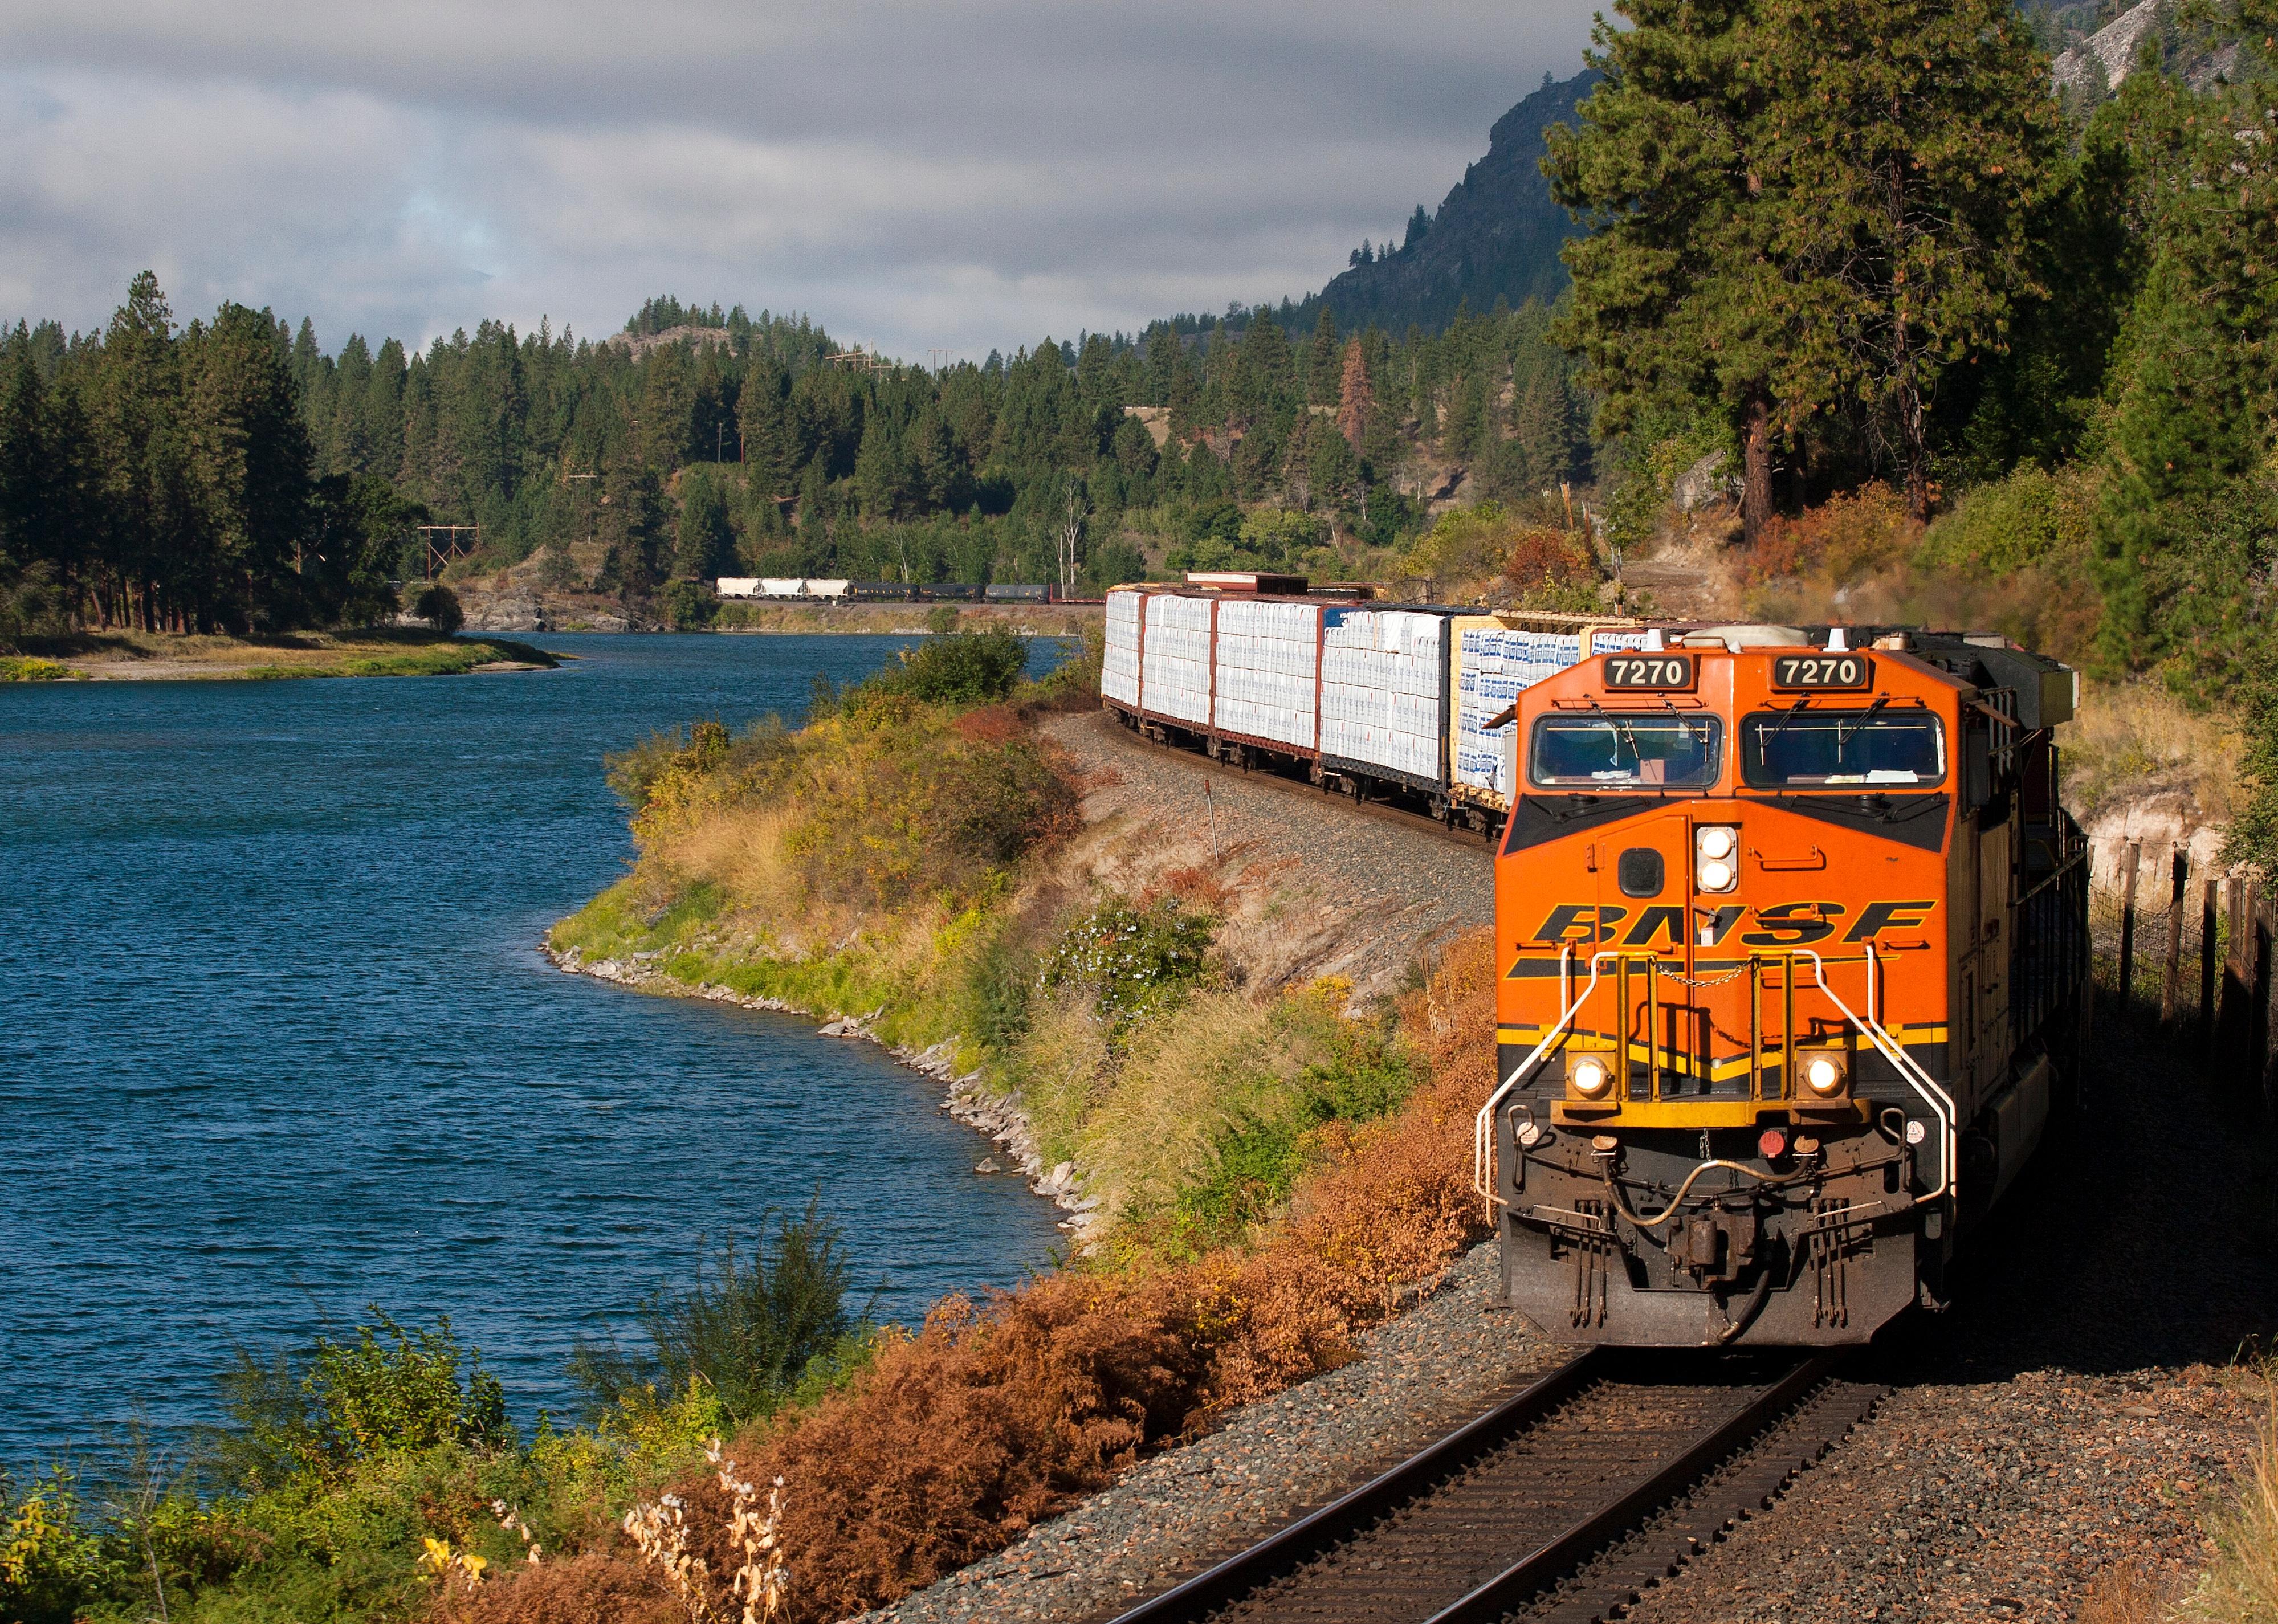
#5. Lincoln County

melissamn // Shutterstock

46 / 50

#5. Lincoln County

- Five-year precipitation average: 29.05 inches
- Precipitation over the past year: 30.01 inches (#40 rainiest year since 1895)
- Precipitation compared to 1901-2000 average: -3.46 inches below norm
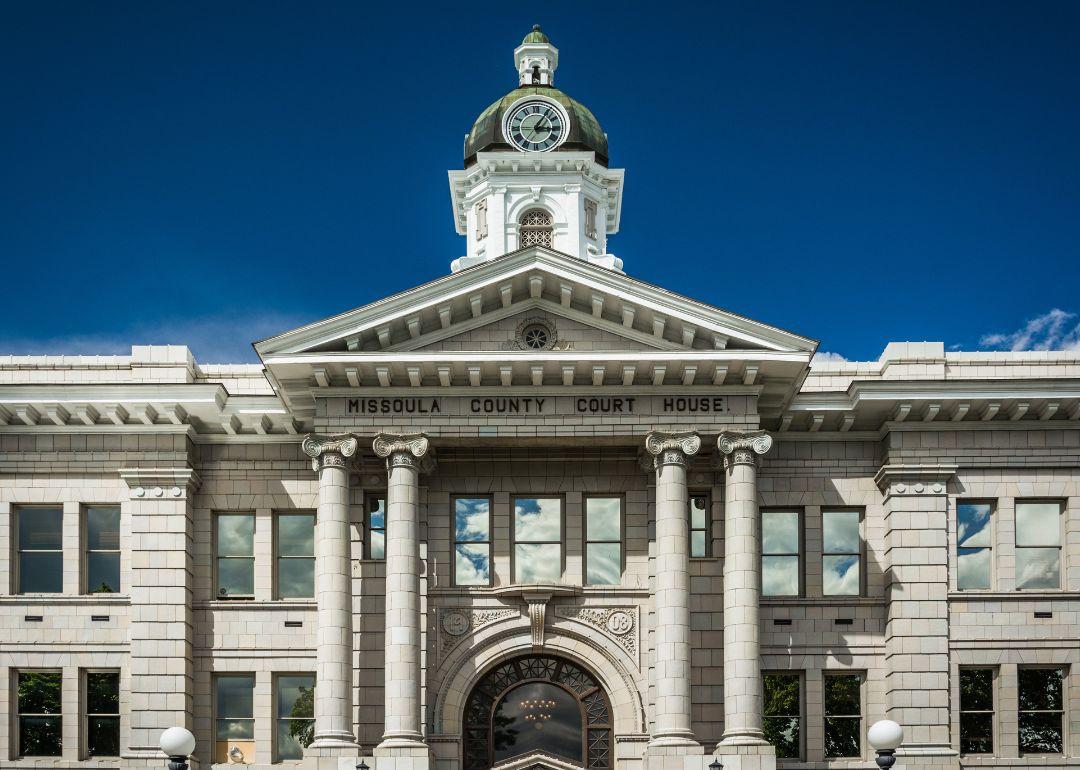
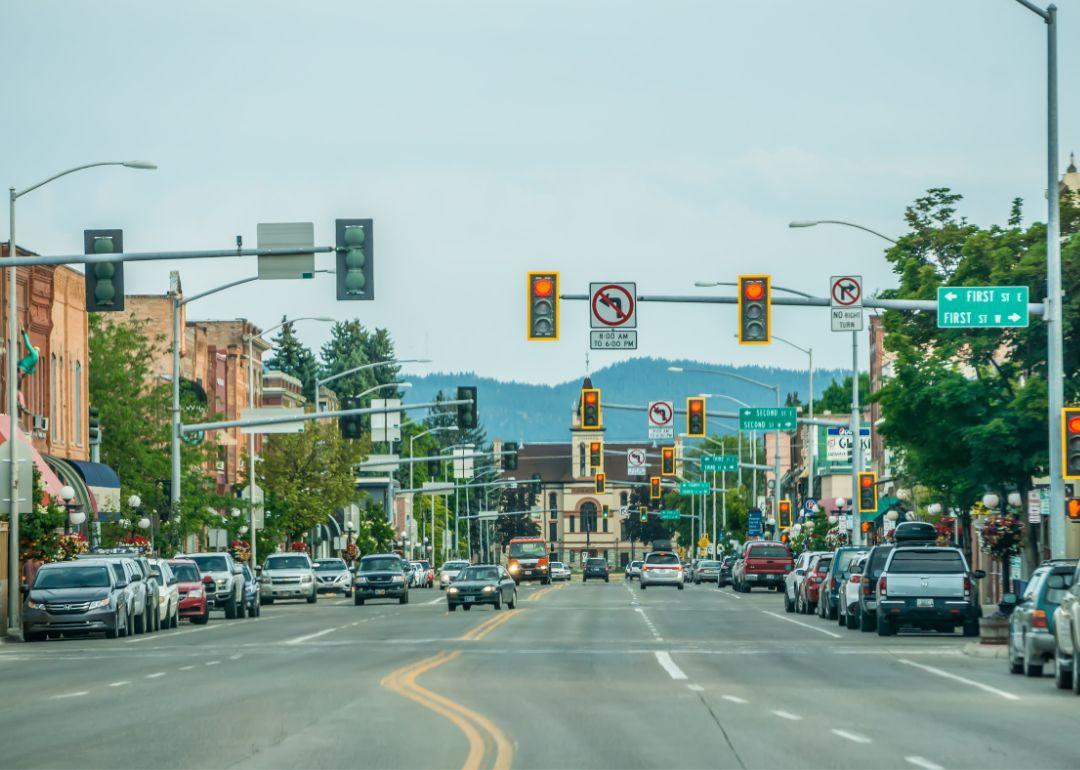
#4. Missoula County

Canva

47 / 50

#4. Missoula County

- Five-year precipitation average: 29.22 inches
- Precipitation over the past year: 27.27 inches (#44 rainiest year since 1895)
- Precipitation compared to 1901-2000 average: -2.62 inches below norm
#3. Sanders County

Drew Halverson // Shutterstock

48 / 50

#3. Sanders County

- Five-year precipitation average: 29.44 inches
- Precipitation over the past year: 30.44 inches (#52 rainiest year since 1895)
- Precipitation compared to 1901-2000 average: -1.49 inches below norm
#2. Flathead County

Canva

49 / 50

#2. Flathead County

- Five-year precipitation average: 33.34 inches
- Precipitation over the past year: 34.76 inches (#53 rainiest year since 1895)
- Precipitation compared to 1901-2000 average: -2.48 inches below norm
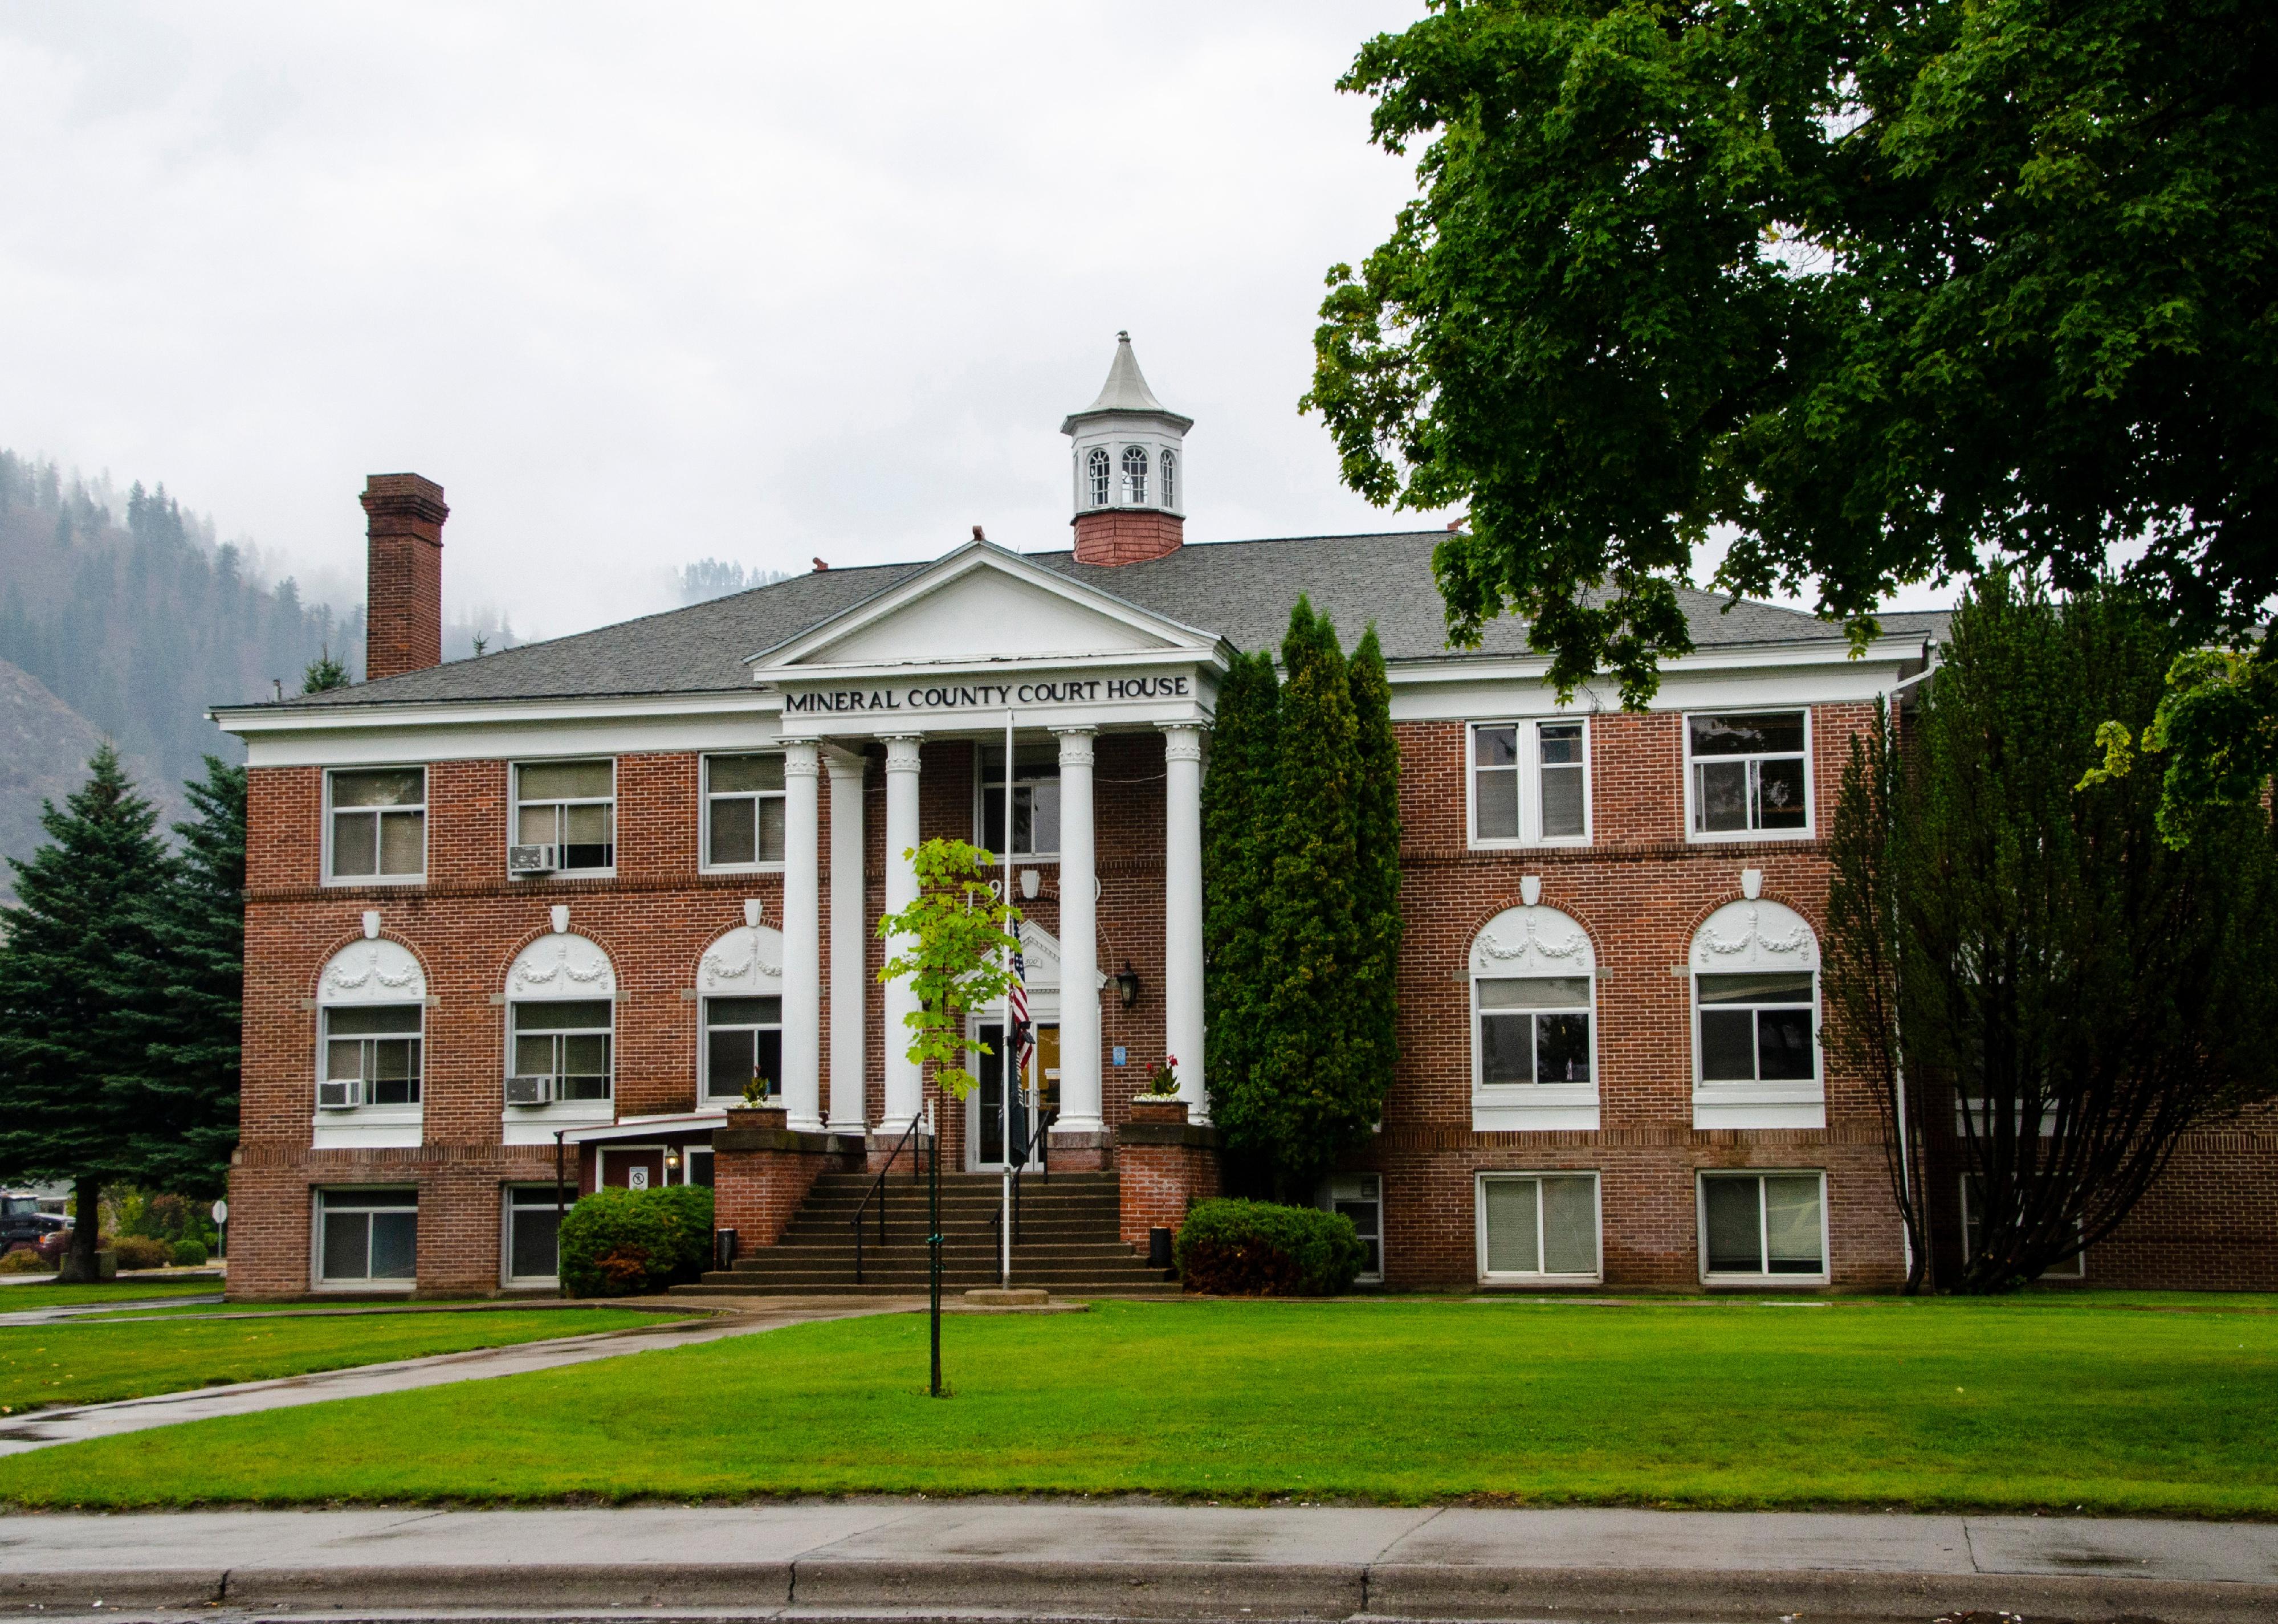
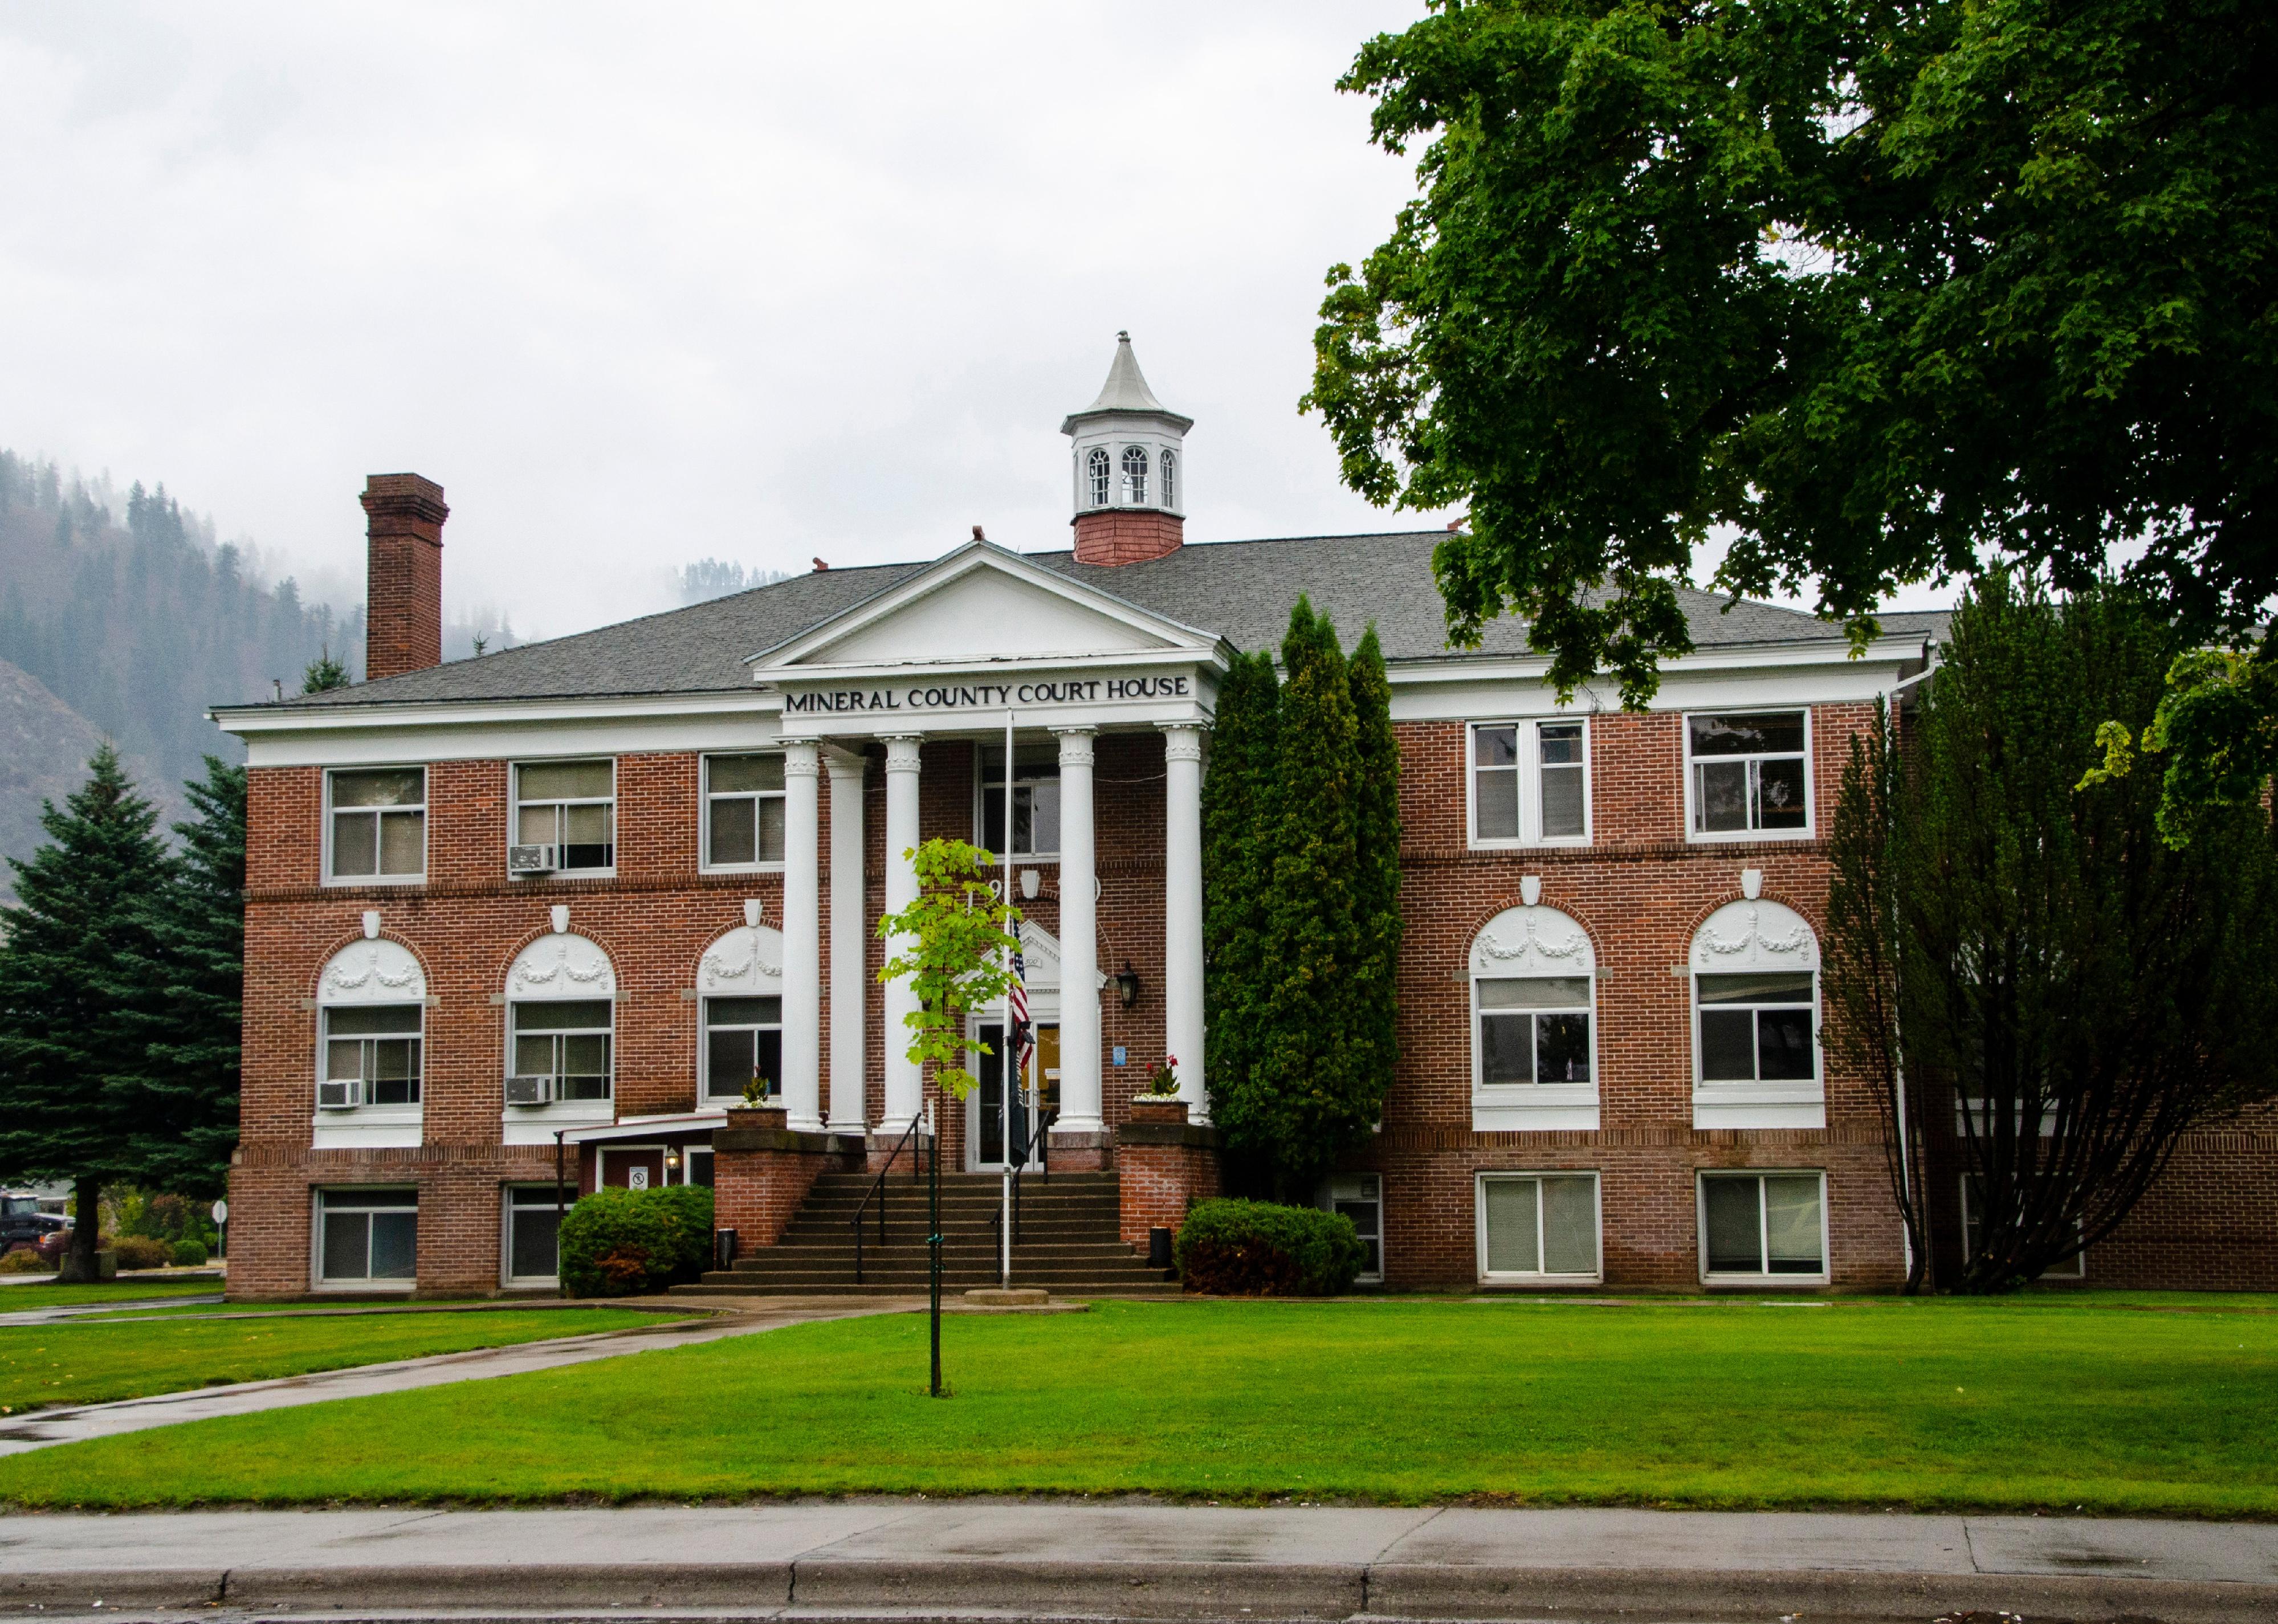
#1. Mineral County

Danita Delimont // Shutterstock

50 / 50

#1. Mineral County

- Five-year precipitation average: 35.01 inches
- Precipitation over the past year: 35.23 inches (#45 rainiest year since 1895)
- Precipitation compared to 1901-2000 average: -3.14 inches below norm