
The states with the highest divorce rates, and what the numbers actually mean
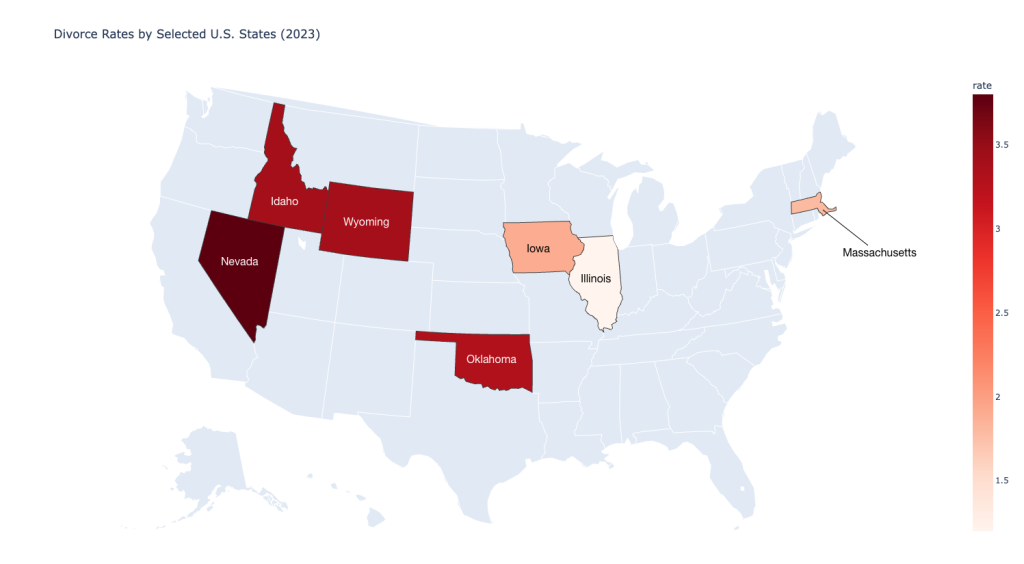
Divorce rates in the U.S. have hit a historic low, but the geography of who is splitting up, and why, tells a more complicated story. Nevada has held the top spot in American divorce statistics for decades. According to the most recent data from the CDC's National Vital Statistics System, Nevada's divorce rate was 3.8 per 1,000 residents in 2023, which is the highest of any state with complete reporting. Wyoming and Oklahoma followed closely, with rates of 3.4 and 3.3 per 1,000, respectively.
Where a state lands on the list says as much about its laws, economy, and marriage culture as it does about the durability of its relationships.
Skillern Firm, a divorce and child custody law firm, examined state-level divorce data, the factors that drive geographic variation, and what the statistics reveal (and don’t) about American marriages.
A Map Divided: South High, Northeast Low
If you look at the CDC's state-by-state divorce data, a clear geographic pattern emerges. The South and Mountain West are consistently ranked at the top, while the Northeast trends toward the bottom.
Illinois, Massachusetts, and Iowa posted some of the lowest crude divorce rates in 2023, with Illinois at 1.2, Massachusetts at 1.8, and Iowa at 1.9 per 1,000 residents. Meanwhile, states like Oklahoma (3.3), Idaho (3.4), and Wyoming (3.4) are near the top of the list, alongside Nevada.
The Nevada Outlier
Nevada's place at the top of the list comes with a significant asterisk. The state's accommodating marriage laws give it a marriage rate more than twice that of any other state, driven largely by Las Vegas, where couples can legally marry with minimal paperwork at any hour of the day or night. Just as Nevada makes it easy to marry, it also offers relatively streamlined divorce procedures. A divorce can often be finalized within 10 days under certain circumstances, and only six weeks of residency is required to file.
The result is a statistical picture that does not reflect the rest of the country. With so many marriages occurring in Nevada, particularly spontaneous or tourism-related ones, the raw divorce count is pulled upward by a larger-than-average married population, even though most out-of-state couples who marry there would divorce in their home state. The percentage of Nevada marriages actually ending in divorce is likely closer to the national average than the raw rate suggests.
What Actually Drives Divorce Rates
Researchers have identified several recurring factors that help explain why some states trend high, and others trend low, including:
- Age at first marriage: Studies have historically shown a connection between younger ages at the time of marriage and higher divorce rates.
- Education levels: Studies conducted by the National Center for Family & Marriage Research indicated that higher education correlates with delayed marriage and more developed communication skills, both of which contribute to marital stability.
- Income and financial stress: Research shows a clear relationship between financial stability and marital outcomes. Generally, the higher the income, the lower the divorce percentage. Half of the states with the lowest median incomes are among the top ten with the highest divorce rates.
The National Trend Is Downward
Zooming out from state-level data, the broader picture is one of sustained decline. The divorce rate in the U.S. hit its peak around 1980, with 22.6 divorces per 1,000 married women. Since then, it has fallen to 14.4 per 1,000 married women as of 2023. Only 1.4% of married adults got divorced in 2023, which was a historic low.
One notable exception to the declining trend is gray divorce, meaning splits among adults 50 and older. The Pew Research Center report indicates that this rate rose sharply from 1990 to 2008 and has leveled off at roughly 10.3 divorces per 1,000 married women in that age group as of 2023. This is substantially above the rate for younger adults.
The ‘Half of All Marriages’ Myth
Perhaps no divorce statistic is more persistent or more misleading than the claim that half of all marriages end in divorce. The CDC's own data shows the U.S. divorce rate has decreased from 3.6 per 1,000 people in 2010 to 2.4 per 1,000 in 2023, and researchers have consistently noted that the 50% figure is unverified and misleading.
The confusion stems largely from a flawed methodology involving dividing the annual number of divorces by the annual number of marriages. This produces a ratio that ignores the actual stock of existing marriages. It's like dividing a city's deaths by its births and concluding most people die in the year they're born.
What the Numbers Don't Capture
State divorce statistics reflect filings, not full experiences. They do not account for separations that never become legal divorces, for cohabiting couples who split without appearing in any dataset, or for the emotional and financial complexity that follows a marriage's end, such as custody arrangements, asset division, or housing instability.
Families continue to face those realities across the U.S. The data may show rates declining nationally, but for the people inside those statistics, the numbers are personal.
The geography of divorce in America reflects broader social and economic divides involving who marries, when they marry, and what resources they have to sustain a partnership. The states with the highest rates are not necessarily home to the most unhappy couples. They are often home to the youngest ones, the most economically stressed ones, and in Nevada's case, the most impulsive ones.
This story was produced by Skillern Firm and reviewed and distributed by Stacker.


