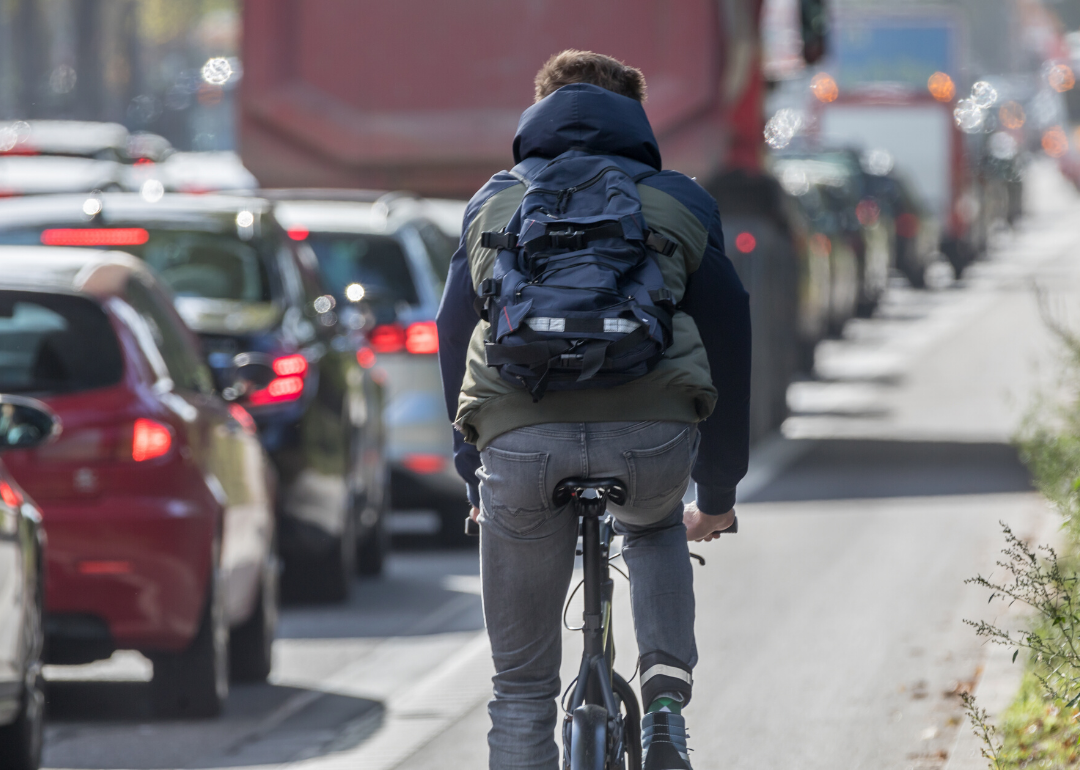
Canetti // Shutterstock
Counties with the best commutes in Pennsylvania
Stacker compiled a list of the counties with the best commutes in Pennsylvania using data from the U.S. Census Bureau. Counties are ranked by the shortest average travel time to work, with ties broken by lowest percent of residents that commute over 60 minutes, and any further ties broken by lowest percent of residents that work outside the county of residence.
You may also like:
Best public middle schools in Pennsylvania
#50. Chester County
- Mean travel time to work: 27.9
- Workers with 60+ minute commute: 9.3%
- Worked outside of county of residence: 25.7%
- Workers with 60+ minute commute: 9.3%
- Worked outside of county of residence: 25.7%
#49. Northampton County
- Mean travel time to work: 27.6
- Workers with 60+ minute commute: 10.7%
- Worked outside of county of residence: 28.8%
- Workers with 60+ minute commute: 10.7%
- Worked outside of county of residence: 28.8%
#48. Butler County
- Mean travel time to work: 27.4
- Workers with 60+ minute commute: 8.6%
- Worked outside of county of residence: 34.1%
- Workers with 60+ minute commute: 8.6%
- Worked outside of county of residence: 34.1%
#47. Susquehanna County
- Mean travel time to work: 27.1
- Workers with 60+ minute commute: 8.0%
- Worked outside of county of residence: 28.1%
- Workers with 60+ minute commute: 8.0%
- Worked outside of county of residence: 28.1%
#46. Fayette County
- Mean travel time to work: 27.0
- Workers with 60+ minute commute: 10.4%
- Worked outside of county of residence: 31.4%
- Workers with 60+ minute commute: 10.4%
- Worked outside of county of residence: 31.4%
You may also like:
Most expensive homes for sale in Pennsylvania
#45. Westmoreland County
- Mean travel time to work: 27.0
- Workers with 60+ minute commute: 10.1%
- Worked outside of county of residence: 32.2%
- Workers with 60+ minute commute: 10.1%
- Worked outside of county of residence: 32.2%
#44. York County
- Mean travel time to work: 27.0
- Workers with 60+ minute commute: 9.3%
- Worked outside of county of residence: 17.9%
- Workers with 60+ minute commute: 9.3%
- Worked outside of county of residence: 17.9%
#43. Schuylkill County
- Mean travel time to work: 26.7
- Workers with 60+ minute commute: 9.6%
- Worked outside of county of residence: 31.8%
- Workers with 60+ minute commute: 9.6%
- Worked outside of county of residence: 31.8%
#42. Washington County
- Mean travel time to work: 26.6
- Workers with 60+ minute commute: 8.0%
- Worked outside of county of residence: 33.0%
- Workers with 60+ minute commute: 8.0%
- Worked outside of county of residence: 33.0%
#41. Allegheny County
- Mean travel time to work: 26.6
- Workers with 60+ minute commute: 6.7%
- Worked outside of county of residence: 8.3%
- Workers with 60+ minute commute: 6.7%
- Worked outside of county of residence: 8.3%
You may also like:
Easy as pie: See the most uniquely popular pie in Pennsylvania
#40. Bedford County
- Mean travel time to work: 26.5
- Workers with 60+ minute commute: 9.3%
- Worked outside of county of residence: 25.5%
- Workers with 60+ minute commute: 9.3%
- Worked outside of county of residence: 25.5%
#39. Wyoming County
- Mean travel time to work: 26.2
- Workers with 60+ minute commute: 5.9%
- Worked outside of county of residence: 44.1%
- Workers with 60+ minute commute: 5.9%
- Worked outside of county of residence: 44.1%
#38. Clearfield County
- Mean travel time to work: 26.1
- Workers with 60+ minute commute: 8.7%
- Worked outside of county of residence: 26.4%
- Workers with 60+ minute commute: 8.7%
- Worked outside of county of residence: 26.4%
#37. Beaver County
- Mean travel time to work: 26.1
- Workers with 60+ minute commute: 7.3%
- Worked outside of county of residence: 42.0%
- Workers with 60+ minute commute: 7.3%
- Worked outside of county of residence: 42.0%
#36. Tioga County
- Mean travel time to work: 25.4
- Workers with 60+ minute commute: 7.8%
- Worked outside of county of residence: 10.7%
- Workers with 60+ minute commute: 7.8%
- Worked outside of county of residence: 10.7%
You may also like:
Highest-rated Class of 2025 football recruits from Pennsylvania
#35. Berks County
- Mean travel time to work: 25.1
- Workers with 60+ minute commute: 7.9%
- Worked outside of county of residence: 25.1%
- Workers with 60+ minute commute: 7.9%
- Worked outside of county of residence: 25.1%
#34. Potter County
- Mean travel time to work: 25.0
- Workers with 60+ minute commute: 7.9%
- Worked outside of county of residence: 17.8%
- Workers with 60+ minute commute: 7.9%
- Worked outside of county of residence: 17.8%
#33. Somerset County
- Mean travel time to work: 24.8
- Workers with 60+ minute commute: 7.6%
- Worked outside of county of residence: 25.0%
- Workers with 60+ minute commute: 7.6%
- Worked outside of county of residence: 25.0%
#32. Northumberland County
- Mean travel time to work: 24.8
- Workers with 60+ minute commute: 7.0%
- Worked outside of county of residence: 46.4%
- Workers with 60+ minute commute: 7.0%
- Worked outside of county of residence: 46.4%
#31. Lehigh County
- Mean travel time to work: 24.7
- Workers with 60+ minute commute: 7.5%
- Worked outside of county of residence: 26.0%
- Workers with 60+ minute commute: 7.5%
- Worked outside of county of residence: 26.0%
You may also like:
Average Pennsylvania mortgage debt increased to $175,647 in 2024
#30. Clarion County
- Mean travel time to work: 24.6
- Workers with 60+ minute commute: 8.1%
- Worked outside of county of residence: 29.5%
- Workers with 60+ minute commute: 8.1%
- Worked outside of county of residence: 29.5%
#29. Franklin County
- Mean travel time to work: 24.6
- Workers with 60+ minute commute: 6.9%
- Worked outside of county of residence: 11.5%
- Workers with 60+ minute commute: 6.9%
- Worked outside of county of residence: 11.5%
#28. Indiana County
- Mean travel time to work: 24.3
- Workers with 60+ minute commute: 9.1%
- Worked outside of county of residence: 25.2%
- Workers with 60+ minute commute: 9.1%
- Worked outside of county of residence: 25.2%
#27. Snyder County
- Mean travel time to work: 24.1
- Workers with 60+ minute commute: 7.9%
- Worked outside of county of residence: 36.2%
- Workers with 60+ minute commute: 7.9%
- Worked outside of county of residence: 36.2%
#26. Clinton County
- Mean travel time to work: 24.1
- Workers with 60+ minute commute: 7.5%
- Worked outside of county of residence: 30.6%
- Workers with 60+ minute commute: 7.5%
- Worked outside of county of residence: 30.6%
You may also like:
Hottest Novembers in Pennsylvania since 1895
#25. Jefferson County
- Mean travel time to work: 23.9
- Workers with 60+ minute commute: 7.8%
- Worked outside of county of residence: 31.8%
- Workers with 60+ minute commute: 7.8%
- Worked outside of county of residence: 31.8%
#24. Lawrence County
- Mean travel time to work: 23.7
- Workers with 60+ minute commute: 6.3%
- Worked outside of county of residence: 34.8%
- Workers with 60+ minute commute: 6.3%
- Worked outside of county of residence: 34.8%
#23. Cambria County
- Mean travel time to work: 23.7
- Workers with 60+ minute commute: 6.1%
- Worked outside of county of residence: 25.4%
- Workers with 60+ minute commute: 6.1%
- Worked outside of county of residence: 25.4%
#22. Mifflin County
- Mean travel time to work: 23.6
- Workers with 60+ minute commute: 7.8%
- Worked outside of county of residence: 27.3%
- Workers with 60+ minute commute: 7.8%
- Worked outside of county of residence: 27.3%
#21. Venango County
- Mean travel time to work: 23.5
- Workers with 60+ minute commute: 7.1%
- Worked outside of county of residence: 25.6%
- Workers with 60+ minute commute: 7.1%
- Worked outside of county of residence: 25.6%
You may also like:
Counties with the most motor vehicle accident fatalities in Pennsylvania
#20. Luzerne County
- Mean travel time to work: 23.5
- Workers with 60+ minute commute: 6.6%
- Worked outside of county of residence: 14.7%
- Workers with 60+ minute commute: 6.6%
- Worked outside of county of residence: 14.7%
#19. Lancaster County
- Mean travel time to work: 23.3
- Workers with 60+ minute commute: 5.7%
- Worked outside of county of residence: 14.1%
- Workers with 60+ minute commute: 5.7%
- Worked outside of county of residence: 14.1%
#18. Bradford County
- Mean travel time to work: 23.1
- Workers with 60+ minute commute: 5.3%
- Worked outside of county of residence: 8.3%
- Workers with 60+ minute commute: 5.3%
- Worked outside of county of residence: 8.3%
#17. Crawford County
- Mean travel time to work: 22.8
- Workers with 60+ minute commute: 6.7%
- Worked outside of county of residence: 20.9%
- Workers with 60+ minute commute: 6.7%
- Worked outside of county of residence: 20.9%
#16. Cumberland County
- Mean travel time to work: 22.6
- Workers with 60+ minute commute: 4.6%
- Worked outside of county of residence: 30.6%
- Workers with 60+ minute commute: 4.6%
- Worked outside of county of residence: 30.6%
You may also like:
Coldest Septembers in Pennsylvania since 1895
#15. Lebanon County
- Mean travel time to work: 22.5
- Workers with 60+ minute commute: 4.5%
- Worked outside of county of residence: 32.9%
- Workers with 60+ minute commute: 4.5%
- Worked outside of county of residence: 32.9%
#14. Mercer County
- Mean travel time to work: 21.8
- Workers with 60+ minute commute: 6.0%
- Worked outside of county of residence: 15.7%
- Workers with 60+ minute commute: 6.0%
- Worked outside of county of residence: 15.7%
#13. Lackawanna County
- Mean travel time to work: 21.7
- Workers with 60+ minute commute: 4.9%
- Worked outside of county of residence: 20.1%
- Workers with 60+ minute commute: 4.9%
- Worked outside of county of residence: 20.1%
#12. Dauphin County
- Mean travel time to work: 21.7
- Workers with 60+ minute commute: 4.1%
- Worked outside of county of residence: 22.8%
- Workers with 60+ minute commute: 4.1%
- Worked outside of county of residence: 22.8%
#11. Blair County
- Mean travel time to work: 21.2
- Workers with 60+ minute commute: 4.8%
- Worked outside of county of residence: 13.9%
- Workers with 60+ minute commute: 4.8%
- Worked outside of county of residence: 13.9%
You may also like:
Best counties to raise a family in Pennsylvania
#10. McKean County
- Mean travel time to work: 21.1
- Workers with 60+ minute commute: 5.2%
- Worked outside of county of residence: 14.8%
- Workers with 60+ minute commute: 5.2%
- Worked outside of county of residence: 14.8%
#9. Columbia County
- Mean travel time to work: 21.1
- Workers with 60+ minute commute: 4.0%
- Worked outside of county of residence: 31.1%
- Workers with 60+ minute commute: 4.0%
- Worked outside of county of residence: 31.1%
#8. Lycoming County
- Mean travel time to work: 20.8
- Workers with 60+ minute commute: 4.5%
- Worked outside of county of residence: 14.9%
- Workers with 60+ minute commute: 4.5%
- Worked outside of county of residence: 14.9%
#7. Centre County
- Mean travel time to work: 20.7
- Workers with 60+ minute commute: 4.1%
- Worked outside of county of residence: 8.5%
- Workers with 60+ minute commute: 4.1%
- Worked outside of county of residence: 8.5%
#6. Union County
- Mean travel time to work: 20.0
- Workers with 60+ minute commute: 3.9%
- Worked outside of county of residence: 36.1%
- Workers with 60+ minute commute: 3.9%
- Worked outside of county of residence: 36.1%
You may also like:
Biggest exports from Pennsylvania
#5. Warren County
- Mean travel time to work: 19.9
- Workers with 60+ minute commute: 4.6%
- Worked outside of county of residence: 11.5%
- Workers with 60+ minute commute: 4.6%
- Worked outside of county of residence: 11.5%
#4. Erie County
- Mean travel time to work: 19.9
- Workers with 60+ minute commute: 3.3%
- Worked outside of county of residence: 2.6%
- Workers with 60+ minute commute: 3.3%
- Worked outside of county of residence: 2.6%
#3. Montour County
- Mean travel time to work: 18.8
- Workers with 60+ minute commute: 2.5%
- Worked outside of county of residence: 39.0%
- Workers with 60+ minute commute: 2.5%
- Worked outside of county of residence: 39.0%
#2. Cameron County
- Mean travel time to work: 17.7
- Workers with 60+ minute commute: 5.7%
- Worked outside of county of residence: 20.8%
- Workers with 60+ minute commute: 5.7%
- Worked outside of county of residence: 20.8%
#1. Elk County
- Mean travel time to work: 17.4
- Workers with 60+ minute commute: 2.9%
- Worked outside of county of residence: 12.6%
- Workers with 60+ minute commute: 2.9%
- Worked outside of county of residence: 12.6%
You may also like:
Counties with the most pre-war homes in Pennsylvania