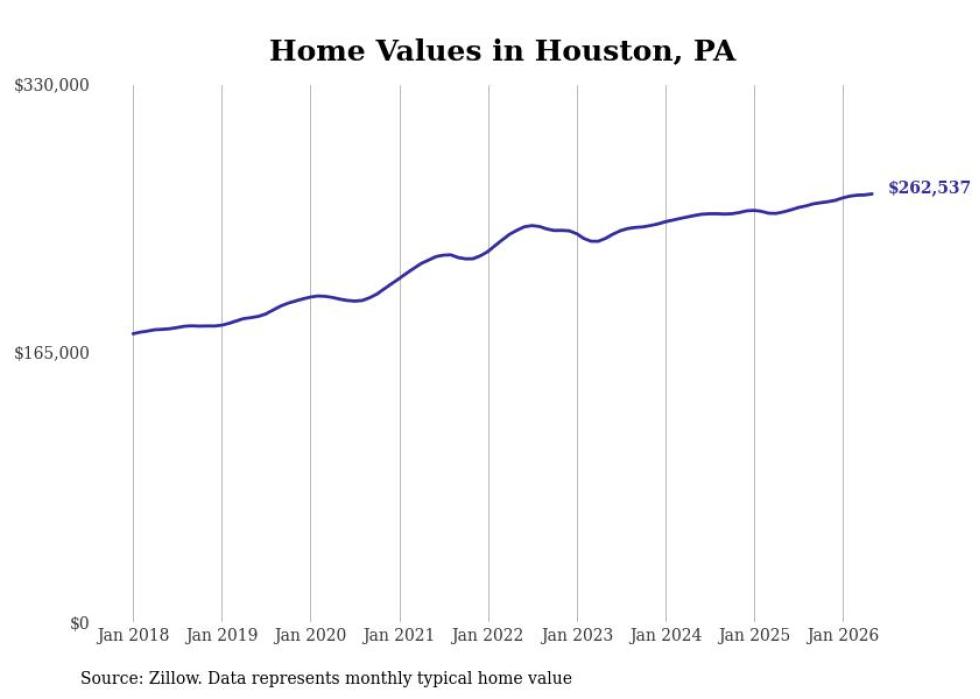
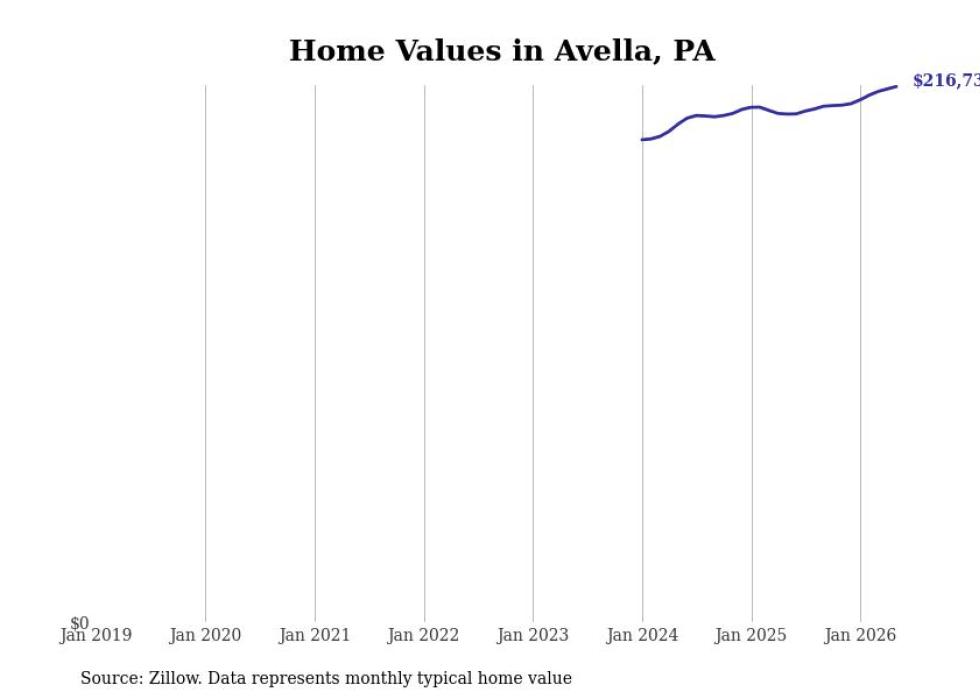
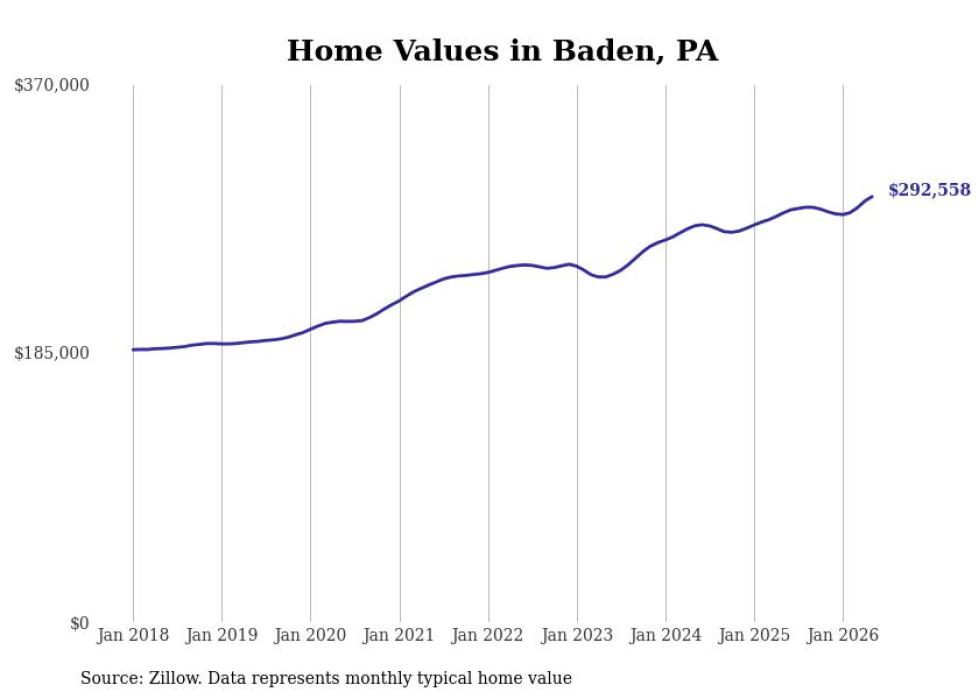
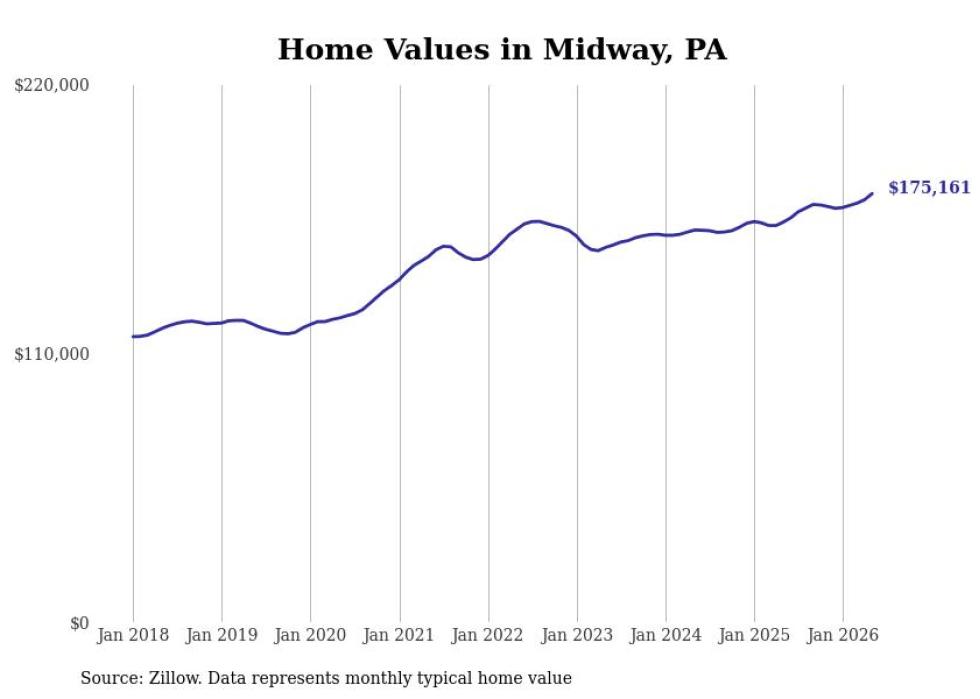
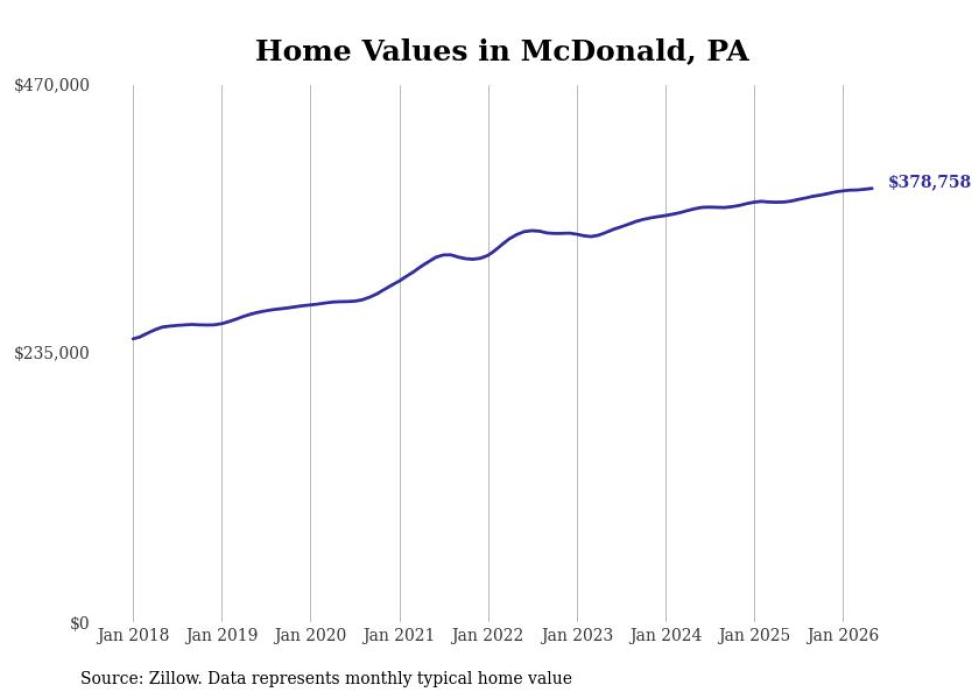
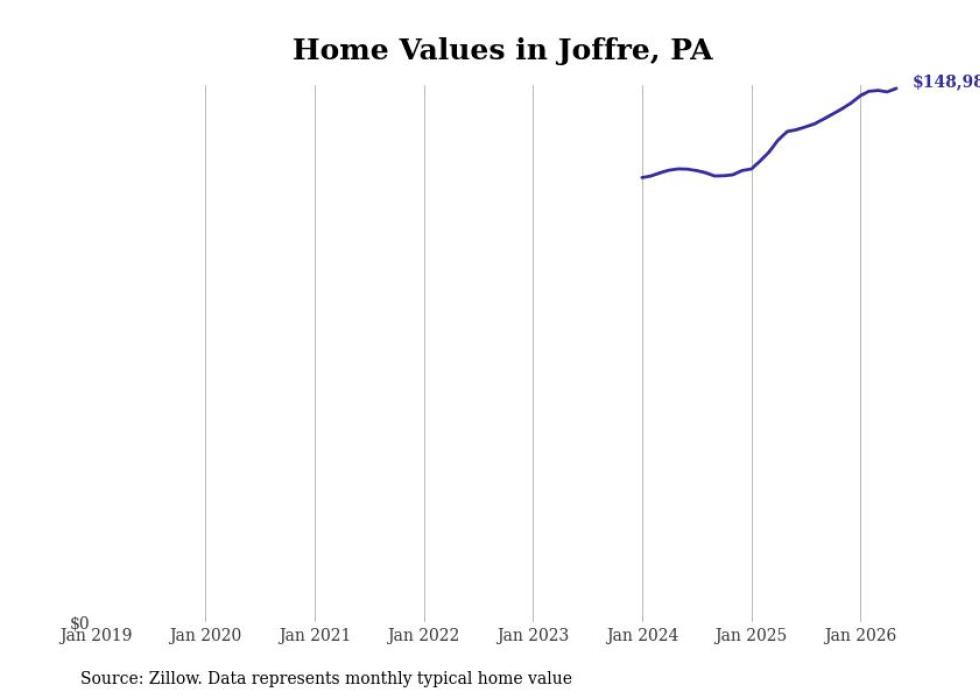
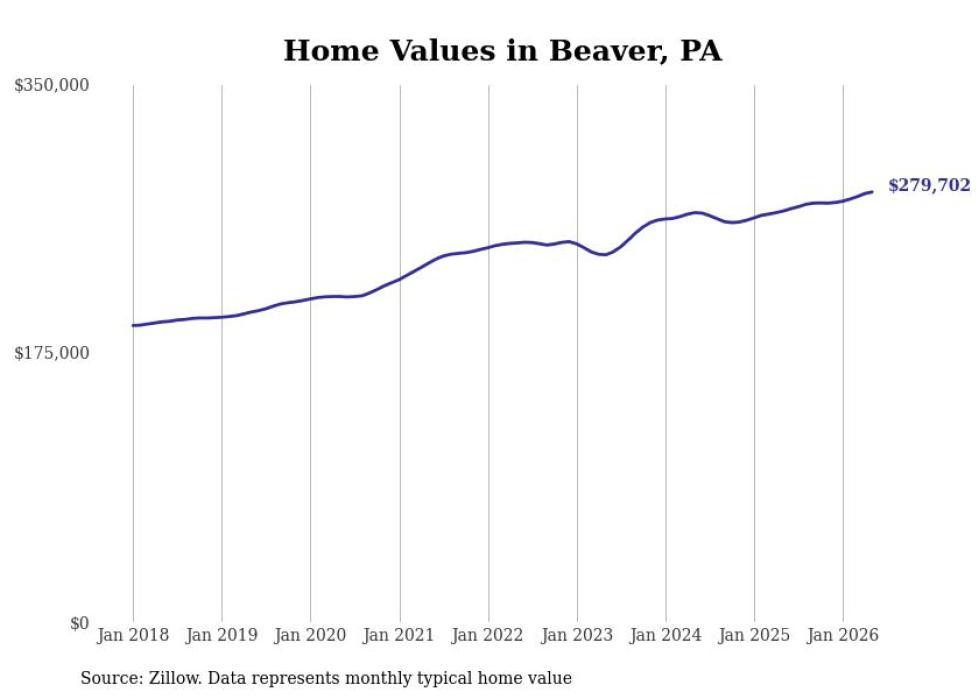
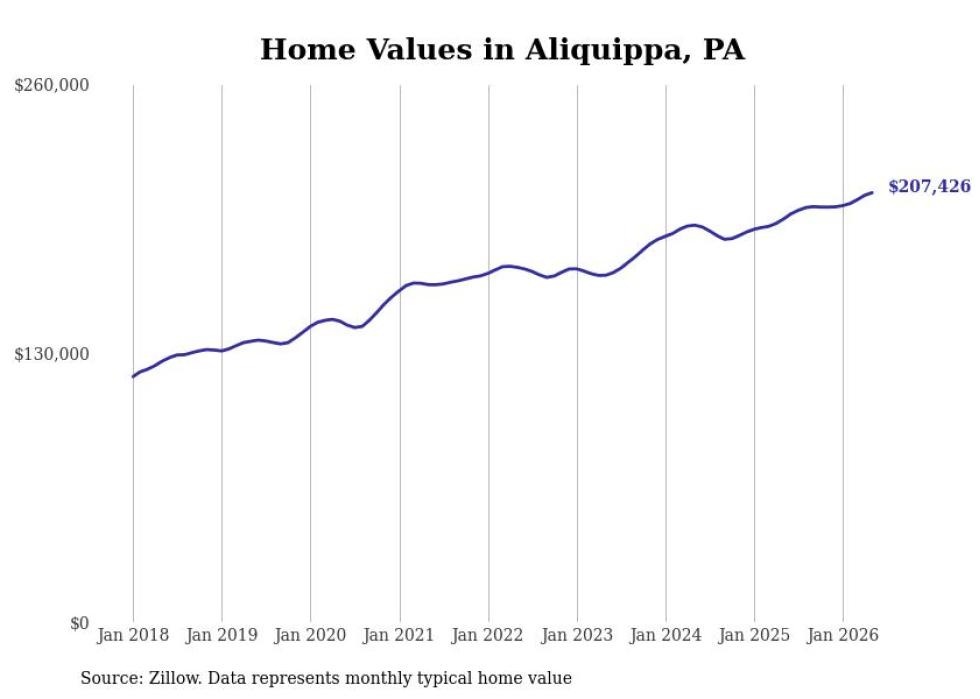
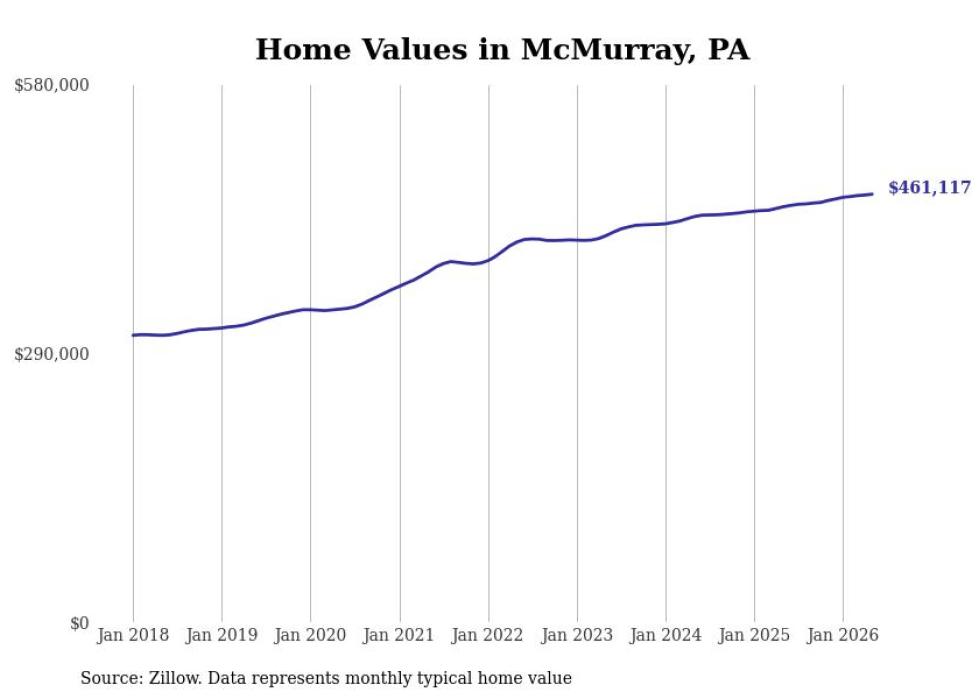
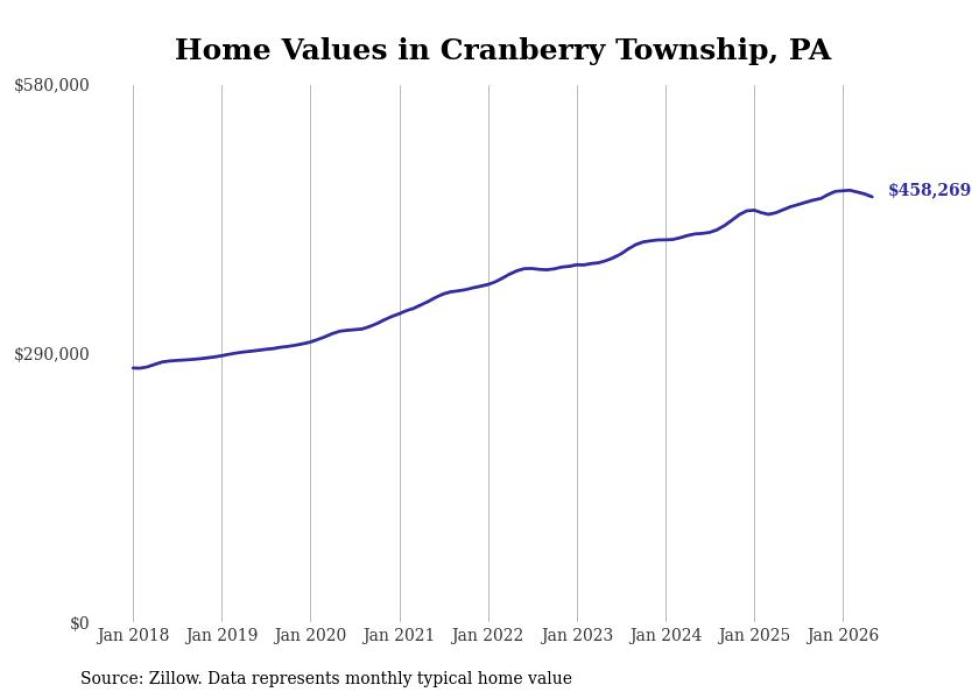
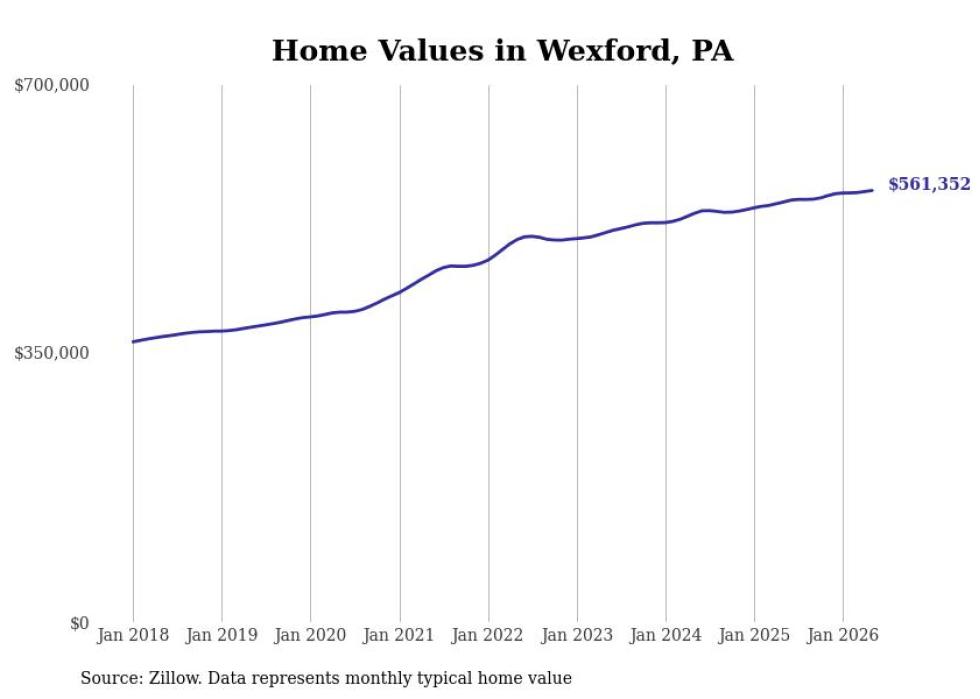
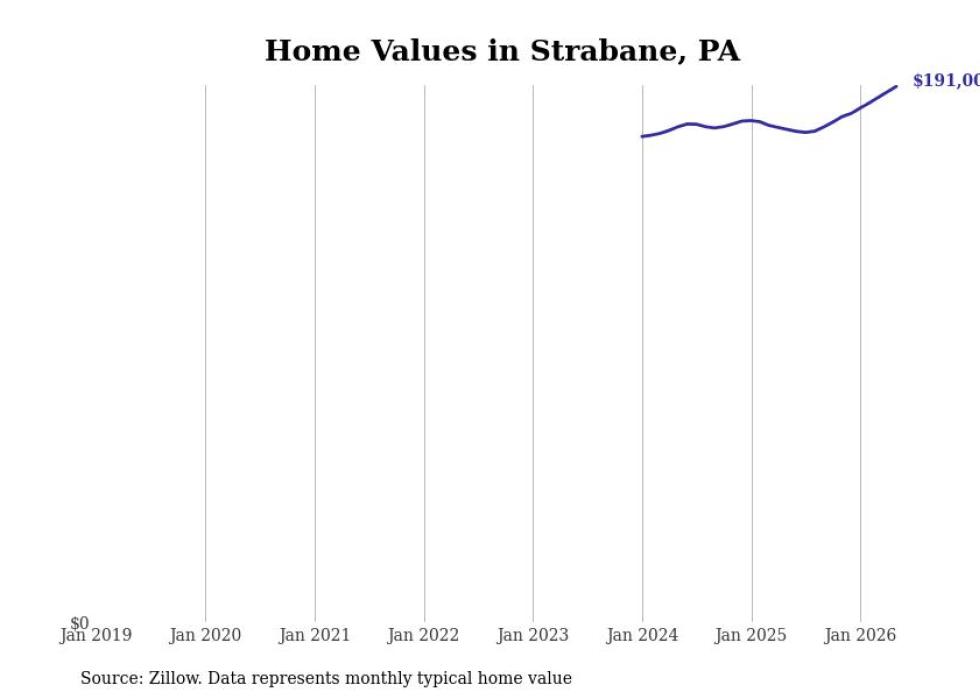
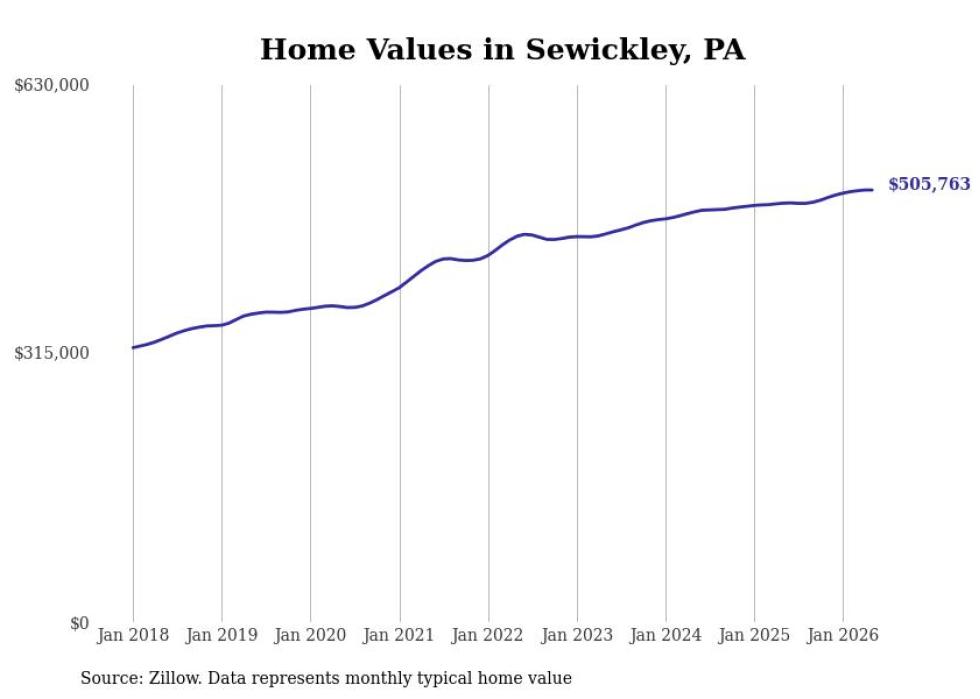
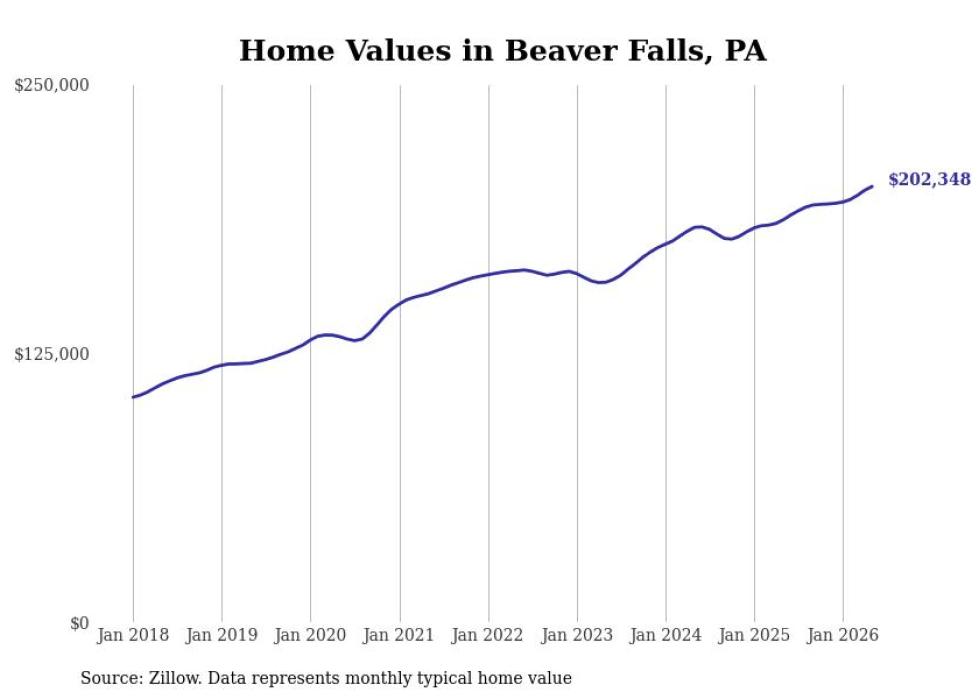
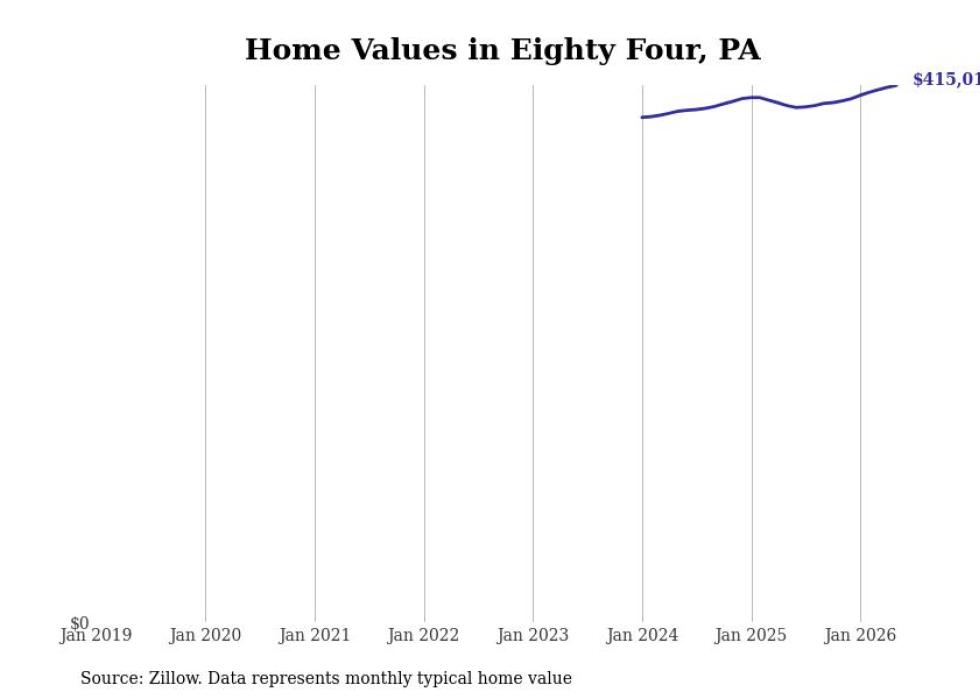
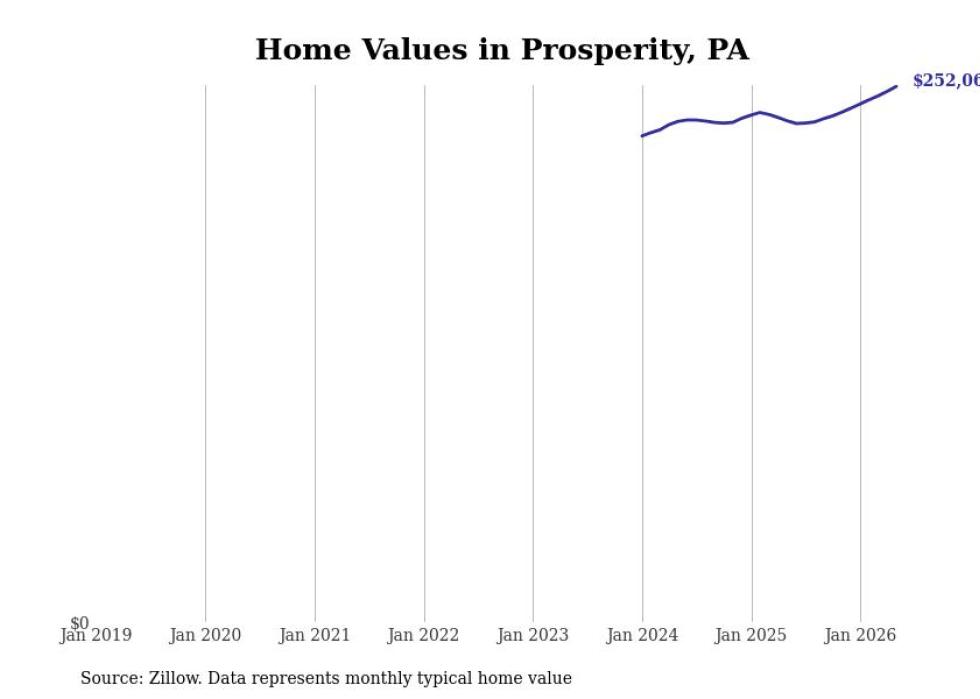
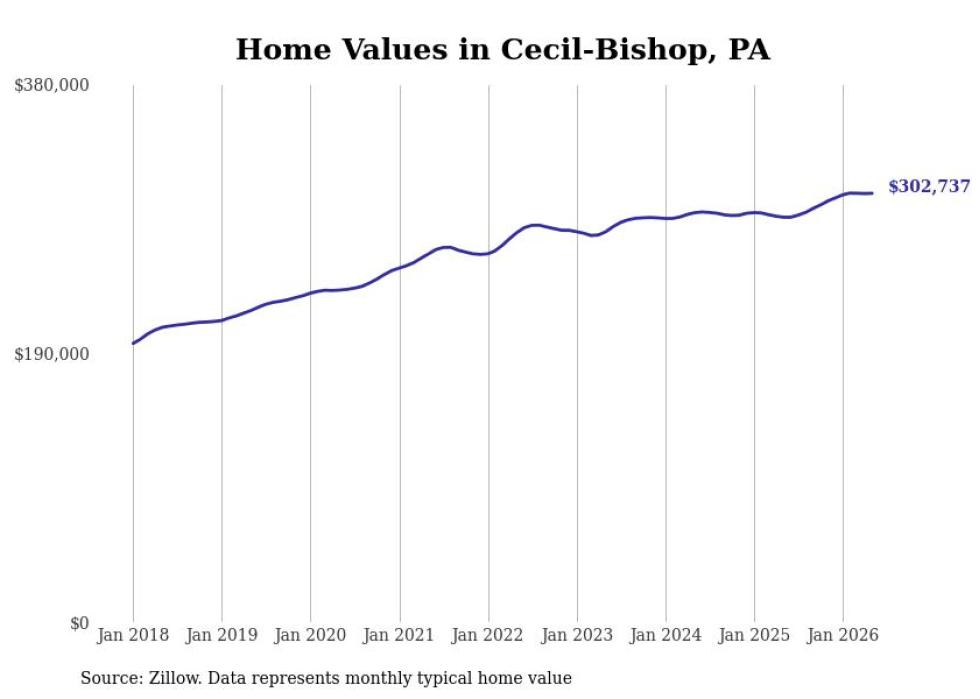
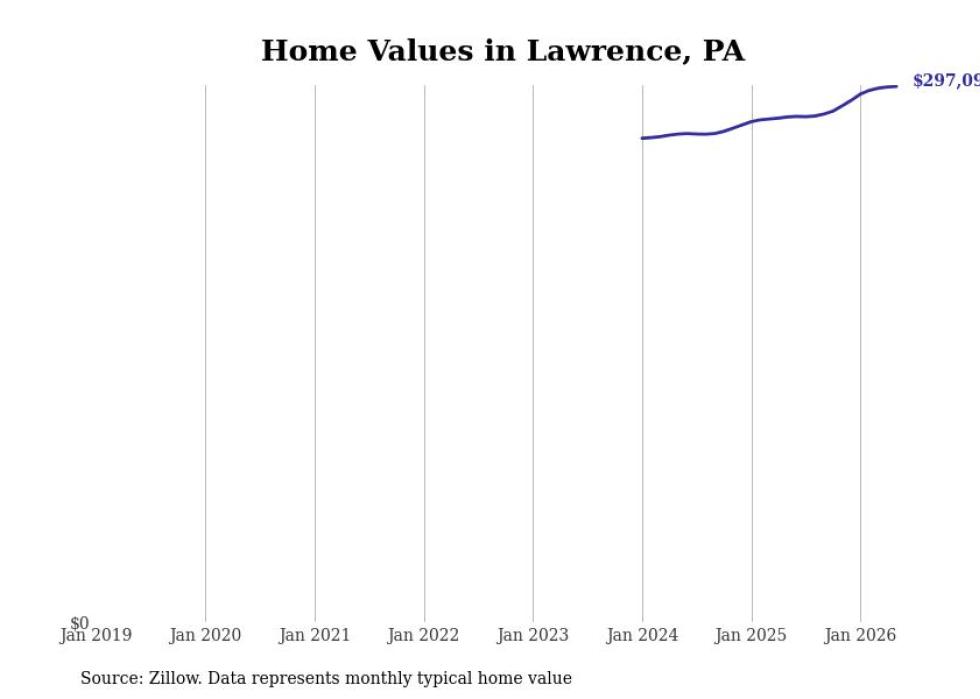
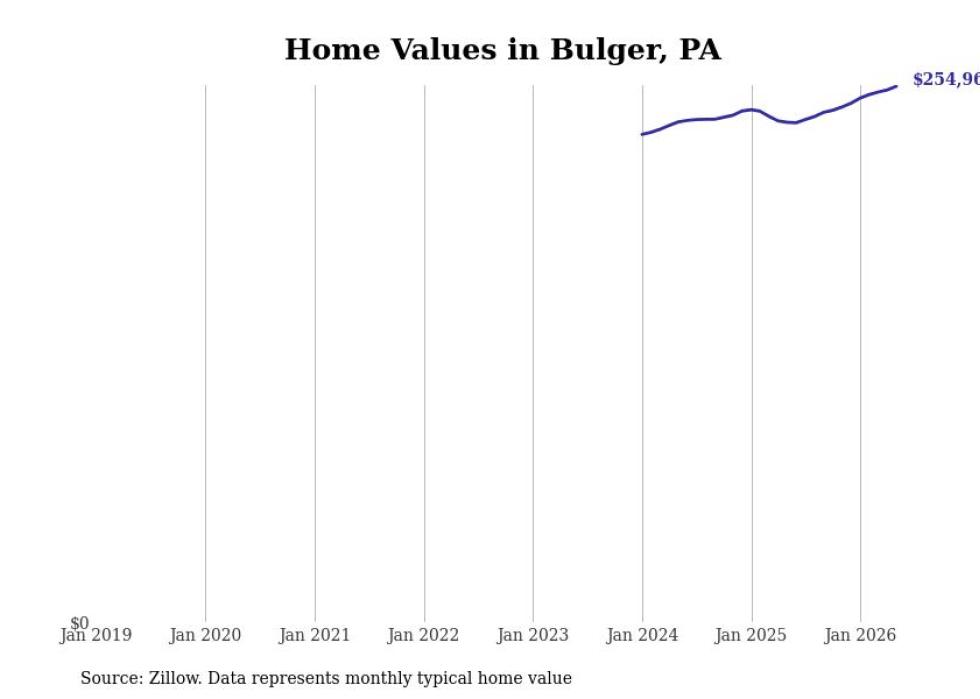
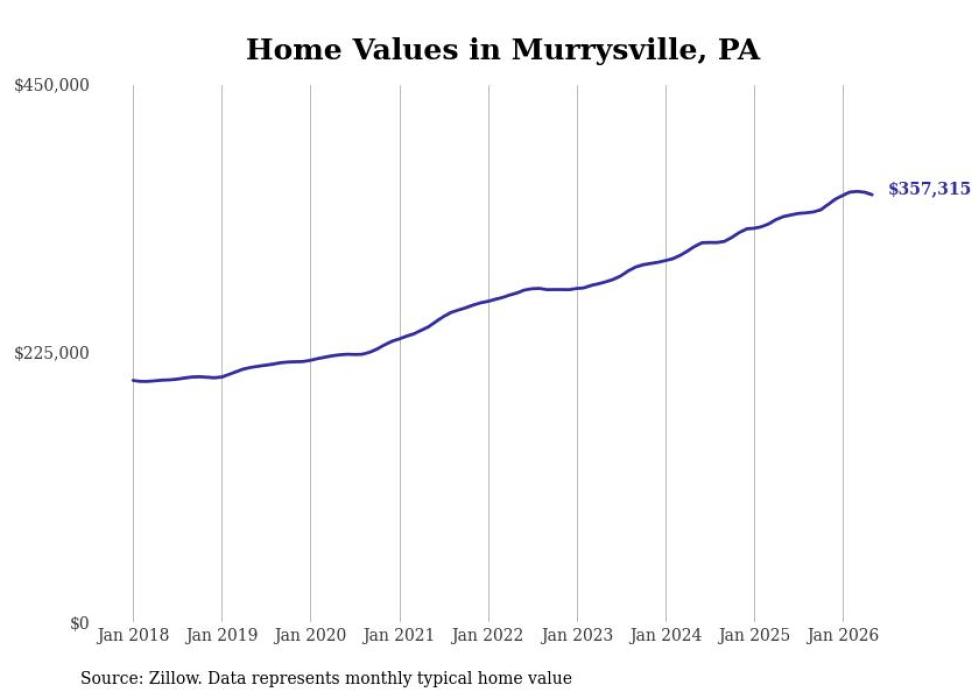
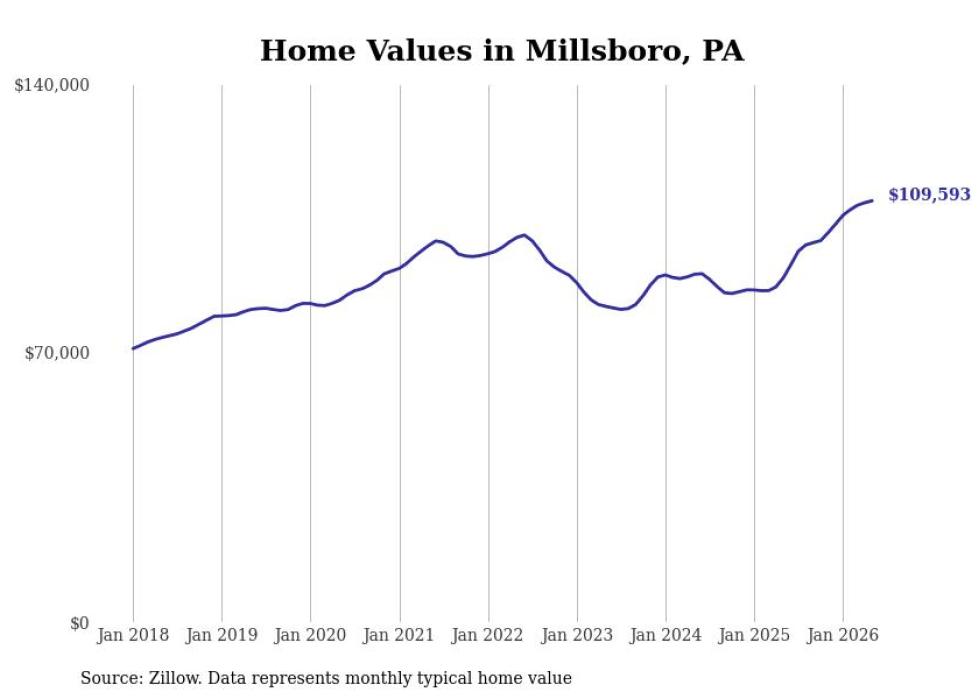
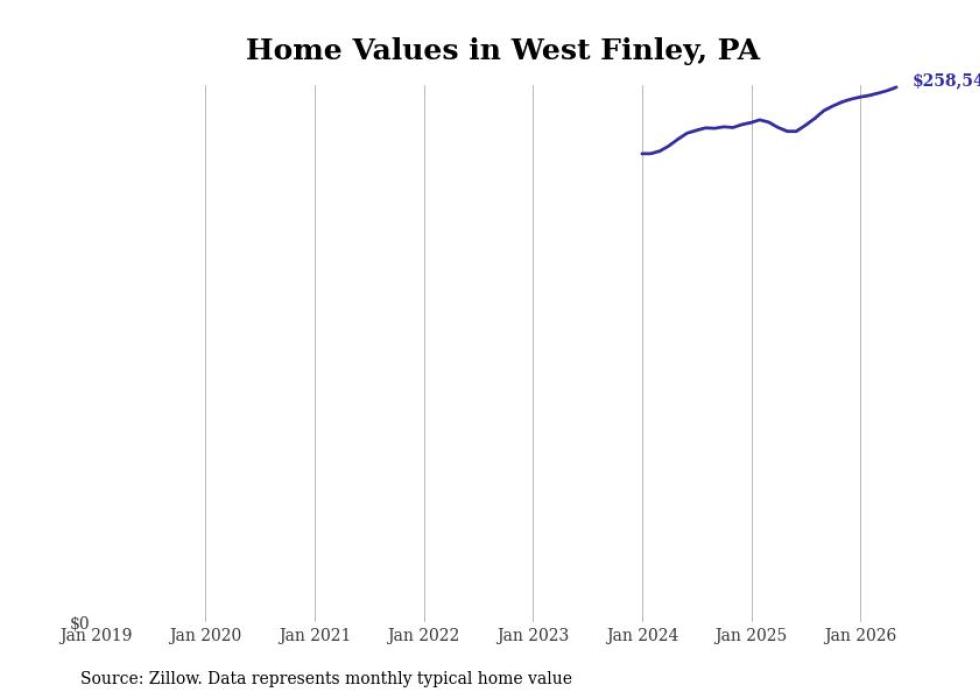
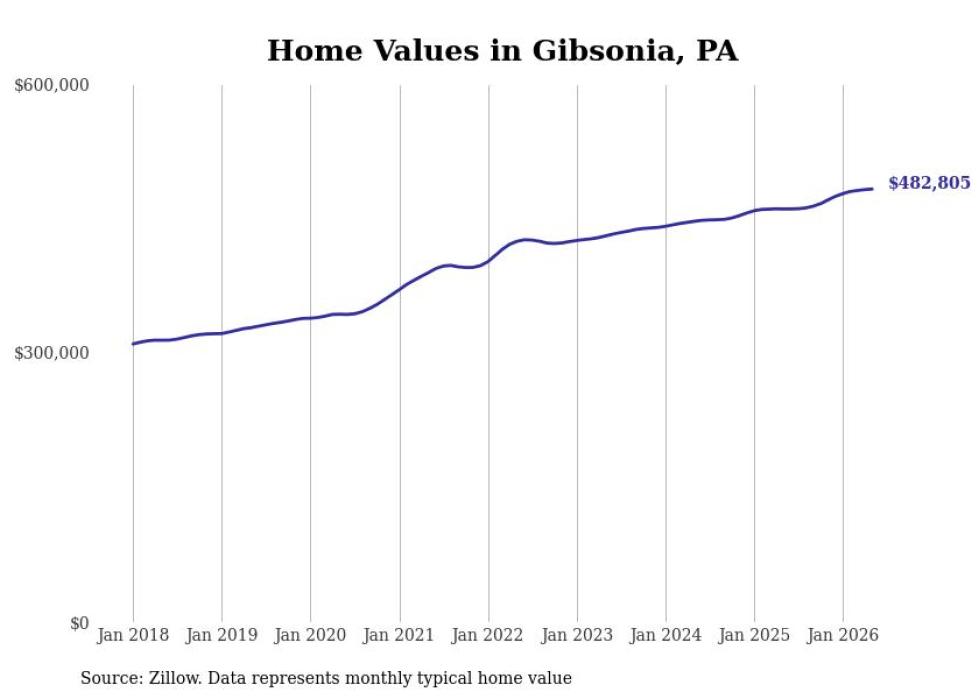
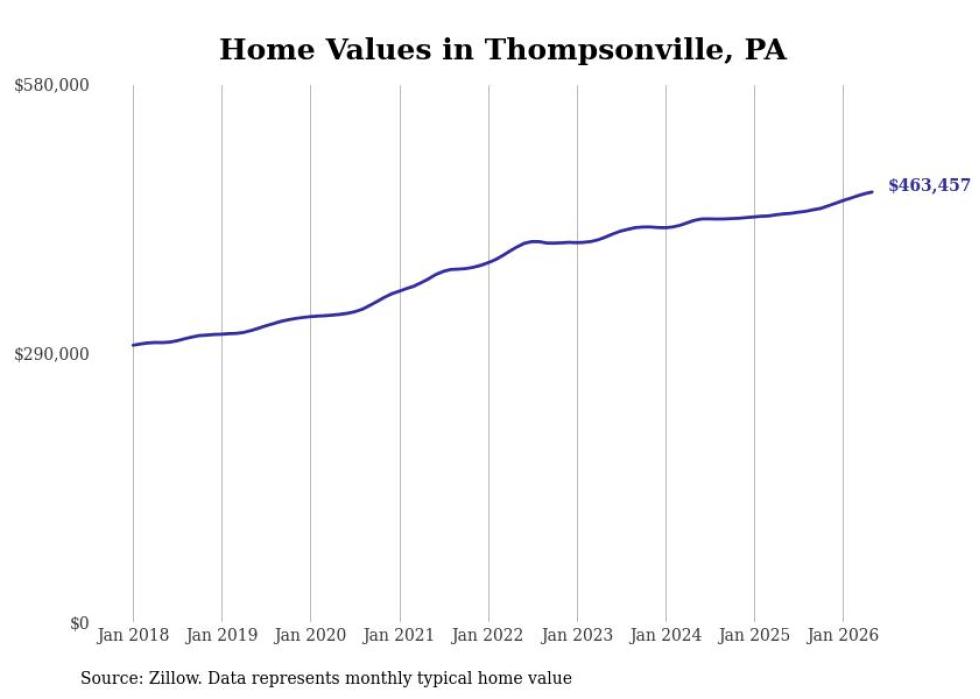
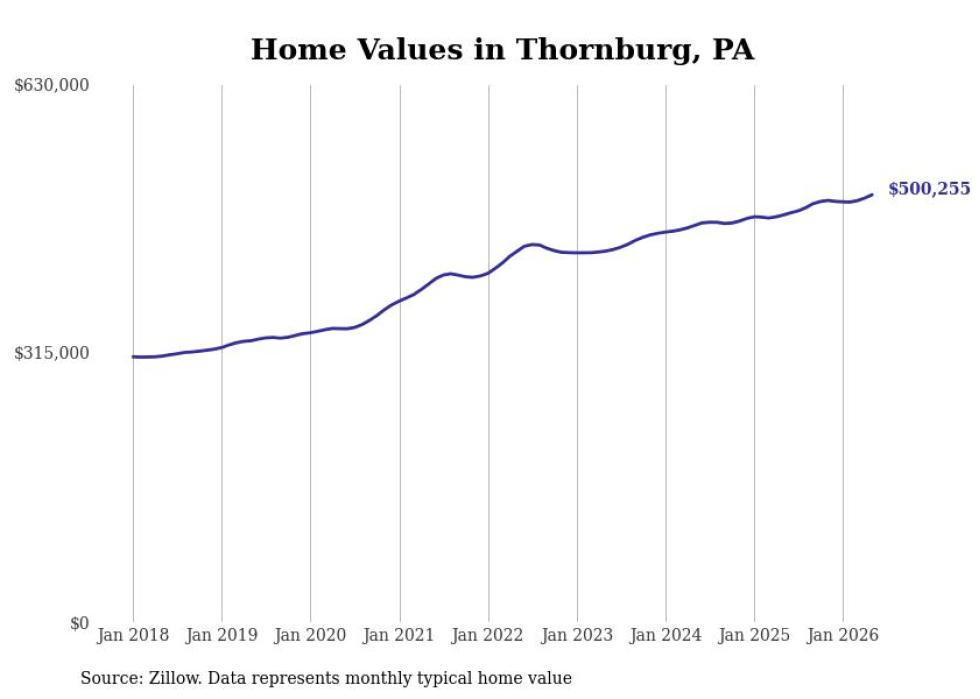
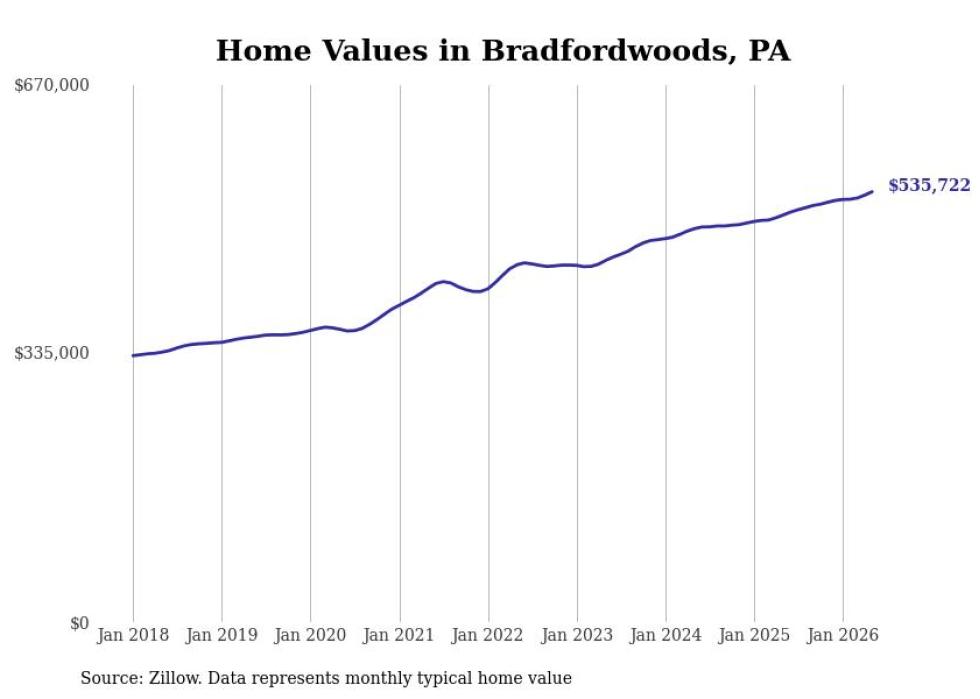
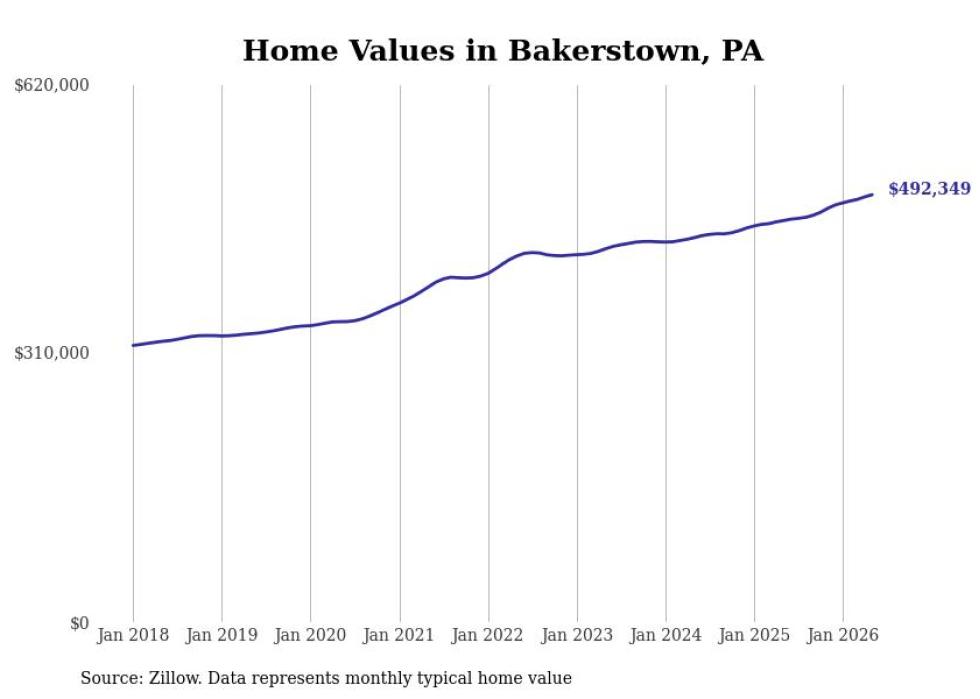
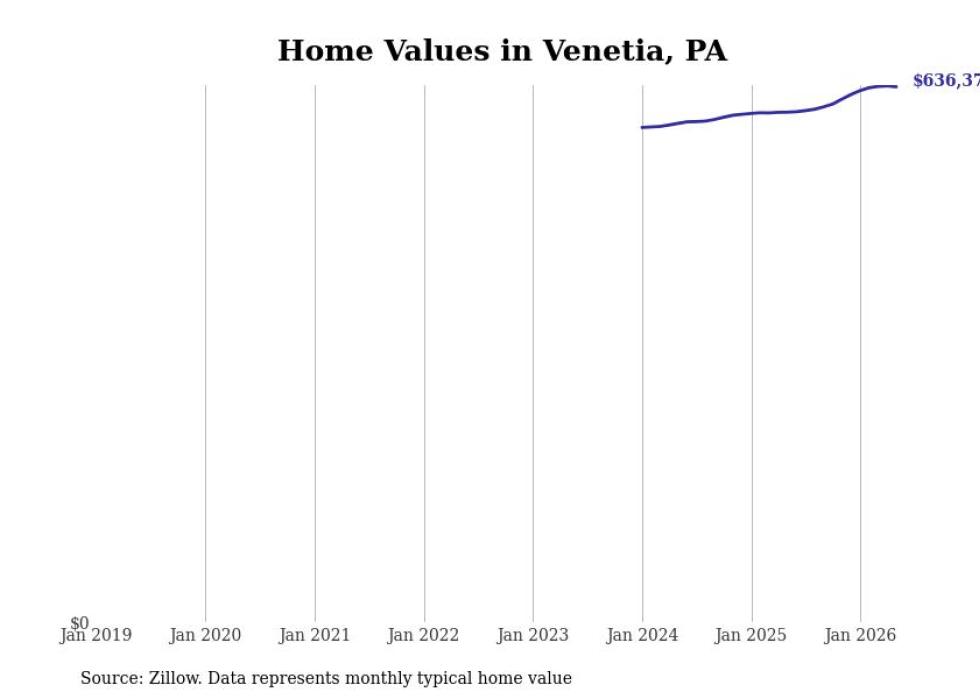
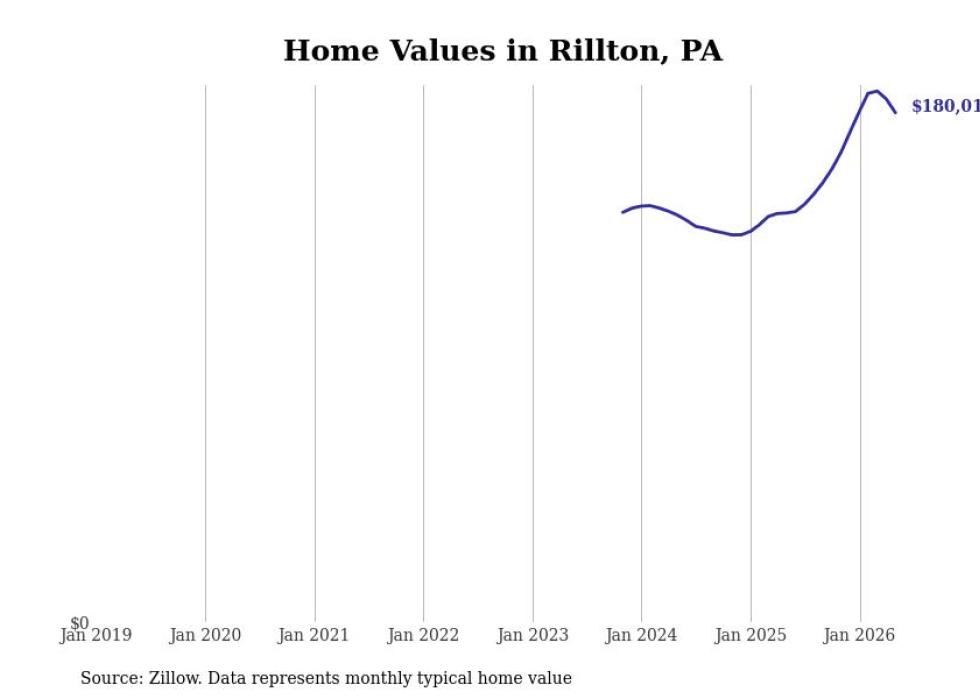
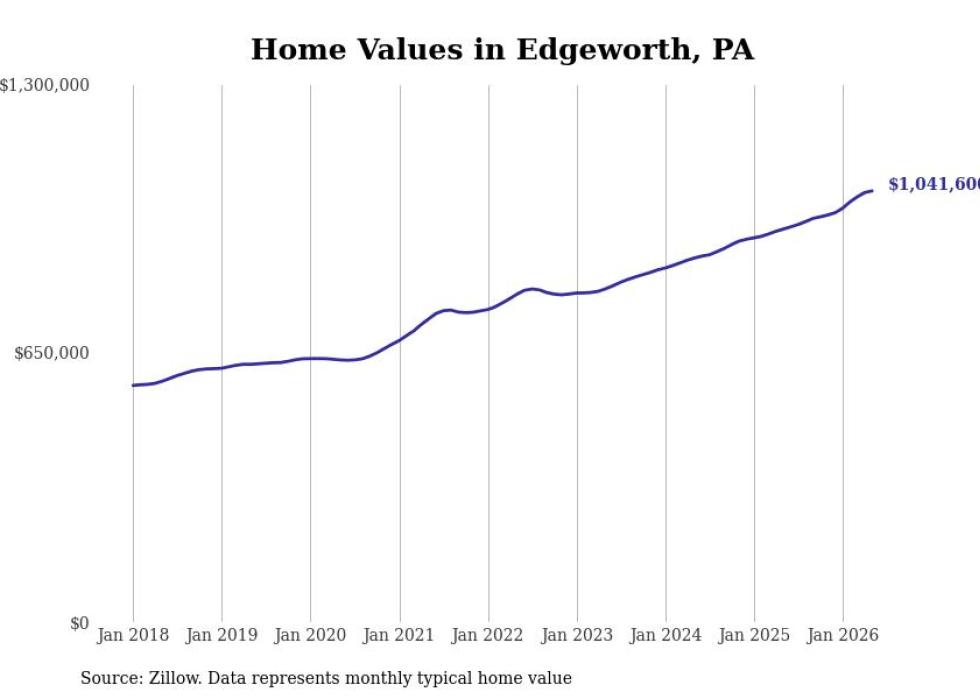
Cities with the fastest-growing home prices in the Pittsburgh metro area
The real estate frenzy spurred by the coronavirus pandemic continues, though at a slower pace. Buyers are still competing for a limited supply of housing, driving up prices for affordable properties.
The typical home value in the United States was $356,776 in January, 2.6% higher than the year before.
Increasing mortgage rates have slowed growth, with prices even declining in some places. But some areas are still seeing price jumps compared to the year before.
Stacker compiled a list of cities with the most expensive homes in the Pittsburgh, PA metro area using data from Zillow. Charts show the monthly typical home value since January 2018.
#30. Scottdale, PA
- 1-year price change: +$11,311 (+7.3%)
- 5-year price change: +$41,885 (+33.5%)
- Typical home value: $167,084 (#88 most expensive city in metro)
#29. Pleasant Hills, PA
- 1-year price change: +$11,805 (+5.0%)
- 5-year price change: +$70,710 (+39.6%)
- Typical home value: $249,126 (#33 most expensive city in metro)
#28. White Oak, PA
- 1-year price change: +$11,893 (+7.1%)
- 5-year price change: +$60,381 (+50.8%)
- Typical home value: $179,240 (#72 most expensive city in metro)
#27. Jeannette, PA
- 1-year price change: +$11,928 (+7.7%)
- 5-year price change: +$42,612 (+34.2%)
- Typical home value: $167,121 (#87 most expensive city in metro)
#26. Avella, PA
- 1-year price change: +$12,113 (+6.7%)
- 5-year price change: +$42,612 (data not available)
- Typical home value: $192,288 (#65 most expensive city in metro)
#25. Trafford, PA
- 1-year price change: +$12,175 (+5.8%)
- 5-year price change: +$60,191 (+37.4%)
- Typical home value: $221,294 (#49 most expensive city in metro)
#24. Sutersville, PA
- 1-year price change: +$12,502 (+9.2%)
- 5-year price change: +$60,191 (data not available)
- Typical home value: $148,787 (#107 most expensive city in metro)
#23. McMurray, PA
- 1-year price change: +$12,941 (+3.2%)
- 5-year price change: +$101,299 (+31.5%)
- Typical home value: $422,449 (#10 most expensive city in metro)
#22. Mount Oliver, PA
- 1-year price change: +$12,962 (+15.8%)
- 5-year price change: +$41,746 (+78.4%)
- Typical home value: $94,968 (#159 most expensive city in metro)
#21. Hyde Park, PA
- 1-year price change: +$13,292 (+14.5%)
- 5-year price change: +$41,746 (data not available)
- Typical home value: $105,124 (#150 most expensive city in metro)
#20. Glassport, PA
- 1-year price change: +$13,348 (+17.3%)
- 5-year price change: +$35,610 (+64.7%)
- Typical home value: $90,610 (#163 most expensive city in metro)
#19. Youngwood, PA
- 1-year price change: +$13,743 (+9.7%)
- 5-year price change: +$41,945 (+36.7%)
- Typical home value: $156,143 (#100 most expensive city in metro)
#18. Eighty Four, PA
- 1-year price change: +$13,748 (+3.9%)
- 5-year price change: +$41,945 (data not available)
- Typical home value: $364,097 (#16 most expensive city in metro)
#17. East Butler, PA
- 1-year price change: +$13,977 (+10.4%)
- 5-year price change: +$41,945 (data not available)
- Typical home value: $148,726 (#108 most expensive city in metro)
#16. Arnold, PA
- 1-year price change: +$14,228 (+20.5%)
- 5-year price change: +$33,716 (+67.3%)
- Typical home value: $83,779 (#171 most expensive city in metro)
#15. West Finley, PA
- 1-year price change: +$14,625 (+6.7%)
- 5-year price change: +$33,716 (data not available)
- Typical home value: $234,416 (#41 most expensive city in metro)
#14. Mars, PA
- 1-year price change: +$14,632 (+3.0%)
- 5-year price change: +$122,975 (+32.6%)
- Typical home value: $500,069 (#4 most expensive city in metro)
#13. Hutchinson, PA
- 1-year price change: +$15,072 (+14.9%)
- 5-year price change: +$122,975 (data not available)
- Typical home value: $116,043 (#137 most expensive city in metro)
#12. Sewickley, PA
- 1-year price change: +$15,214 (+3.3%)
- 5-year price change: +$116,734 (+32.8%)
- Typical home value: $472,313 (#6 most expensive city in metro)
#11. Venetia, PA
- 1-year price change: +$16,104 (+2.8%)
- 5-year price change: +$116,734 (data not available)
- Typical home value: $583,590 (#2 most expensive city in metro)
#10. Gibsonia, PA
- 1-year price change: +$16,404 (+3.9%)
- 5-year price change: +$112,960 (+35.4%)
- Typical home value: $432,214 (#9 most expensive city in metro)
#9. West Leechburg, PA
- 1-year price change: +$16,753 (+10.0%)
- 5-year price change: +$67,920 (+58.7%)
- Typical home value: $183,591 (#69 most expensive city in metro)
#8. Thornburg, PA
- 1-year price change: +$16,932 (+3.9%)
- 5-year price change: +$127,887 (+40.1%)
- Typical home value: $446,806 (#8 most expensive city in metro)
#7. Bakerstown, PA
- 1-year price change: +$18,388 (+4.3%)
- 5-year price change: +$113,568 (+33.7%)
- Typical home value: $450,770 (#7 most expensive city in metro)
#6. Wexford, PA
- 1-year price change: +$18,397 (+3.7%)
- 5-year price change: +$135,978 (+35.7%)
- Typical home value: $516,465 (#3 most expensive city in metro)
#5. Bradfordwoods, PA
- 1-year price change: +$20,464 (+4.5%)
- 5-year price change: +$130,157 (+37.4%)
- Typical home value: $478,376 (#5 most expensive city in metro)
#4. Harmony, PA
- 1-year price change: +$22,569 (+6.3%)
- 5-year price change: +$98,538 (+35.1%)
- Typical home value: $378,893 (#14 most expensive city in metro)
#3. Murrysville, PA
- 1-year price change: +$26,812 (+8.9%)
- 5-year price change: +$109,547 (+50.4%)
- Typical home value: $326,716 (#21 most expensive city in metro)
#2. Cranberry Township, PA
- 1-year price change: +$29,914 (+7.7%)
- 5-year price change: +$133,215 (+47.1%)
- Typical home value: $416,171 (#12 most expensive city in metro)
#1. Edgeworth, PA
- 1-year price change: +$71,256 (+8.5%)
- 5-year price change: +$285,151 (+45.9%)
- Typical home value: $906,594 (#1 most expensive city in metro)