Can you afford a home in 2026? A data-driven look at U.S. housing affordability
In a handful of states, for the right buyer in the right market, homeownership in 2026 is more within reach than headlines may suggest. This picture is not uniform, though. In most U.S. states, the income required to buy a median-priced home exceeds what median households earn. But in a meaningful cluster of states, the gap has effectively closed.
Splitero has broken down data from leading sources, including Zillow and Federal Reserve Economic Data, to spotlight which states offer affordable homes compared to income.
What does it cost to buy a home right now?
Based on the National Association of Realtors' existing-home price data from February 2026, the median cost of a home in the U.S. was $398,000. Applying the 28% debt-to-income ceiling most conventional lenders use, that price point requires a household income of roughly $112,900. This creates a $29,200 disparity when compared with the U.S. median household income of $83,730. That’s the national picture.
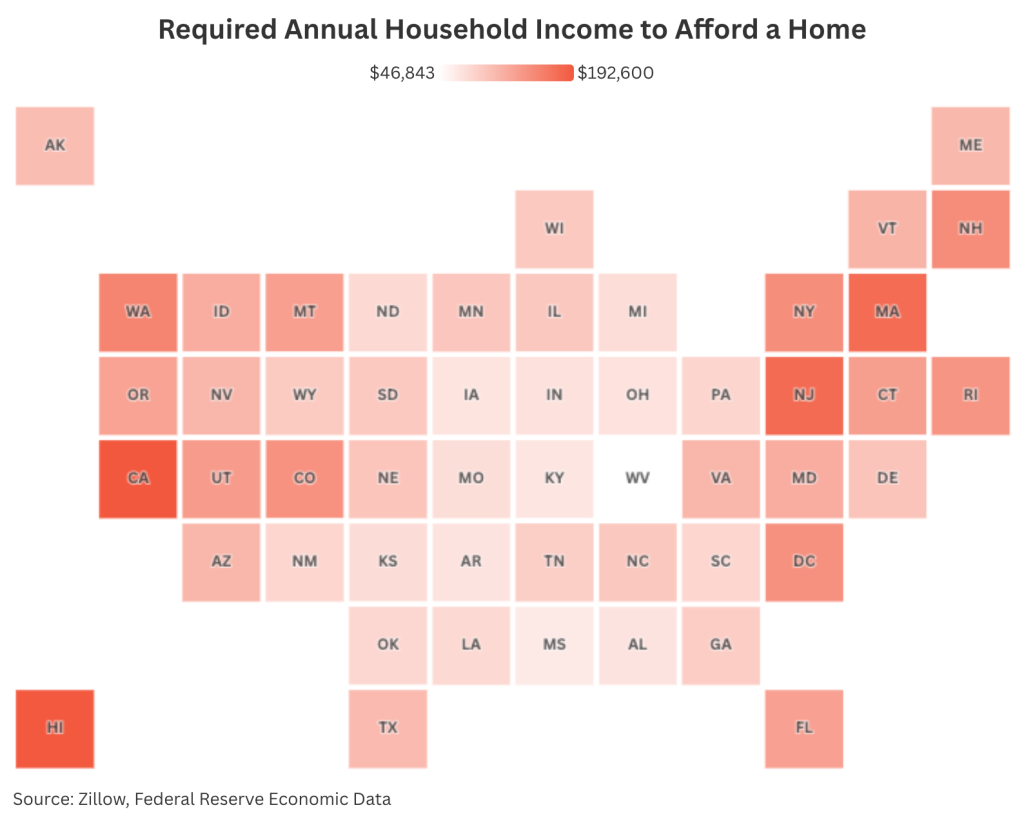
Here is a breakdown of the estimated household income required to buy a home, placed against the median household income, in that state. The required annual household income was calculated using the assumed traditional 28% debt-to-income ratio ceiling most conventional lenders lean on.
Data: Data: Can You Afford a Home in 2026 [Splitero]
Read another way, the picture is starker when you measure the gap between what households need to earn and what they actually do, both at the top and bottom of the list.
On a state-by-state basis, the affordability picture turns on the gap between what households need to earn and what they actually do. Hawaii has the widest shortfall in the country: a household needs $191,449 to afford a median-priced home there, while the typical household earns $98,240, creating a $93,209 gap. California is barely behind, where a $192,600 required income runs $92,000 above the $100,600 state median. New Jersey, Massachusetts, and New York round out the top five widest gaps, each with shortfalls between $58,000 and $73,000.
Florida, despite its reputation as a budget-friendly alternative to other coastal states, doesn't escape the gap either. The state’s required income of $129,532 runs nearly $54,000 above the median household income of $75,630. This shortfall seemingly coincides with significant price increases during the pandemic-era migration period. Near the end of 2022, TD Economics reported that Florida home prices on average were up 58% from the start of the pandemic for perspective.
West Virginia anchors the other end of the ranking. The required income needed to afford a median-priced home is just $46,843, against a median household income of $63,150. This $16,307 surplus is the largest of all the states. It also makes West Virginia one of only eight states on the list where a median household income can technically qualify for a median-priced home. The remaining seven are Iowa, Kansas, Ohio, North Dakota, Indiana, Michigan, and Missouri.
How affordability has changed: A 2022–2026 look back
It’s one thing to look at the modern state of homebuying as a point in time, but taking a historical glance shows just how the trends have evolved.
Between 2022 and 2024, housing affordability fell faster than at any point in modern history. The National Association of Realtors’ Housing Affordability Index, which measures whether a typical family earns enough to qualify for a loan on a median-priced home, slid from above 150 to about 95 by mid-2023. A reading of 100 means a family has exactly enough; above 100 means a cushion, and below 100 means a shortfall.
Since 2024, that trend started to reverse, driven by three forces: mortgage rates have eased from their 8% peak in 2023, wage growth has begun to outpace home price gains, and housing inventory has risen modestly. Home prices have climbed just 1.8% year-over-year as of Q4 2025, according to the Federal Housing Finance Agency, a sharp cooldown from the double-digit jumps of the pandemic era. The National Association of Home Builders reported the same shift, noting that homes remain broadly unaffordable but that conditions improved in the second half of 2025.
The geography of affordability
Mid-size Midwest and Southern cities located adjacent to major metros have seen a strong surge in buyer interest. Chief economist of Realtor.com, Danielle Hale, put the math of the matter plainly in a video snippet on a piece covering home affordability in the U.S.: Where you choose to buy a home can determine not just how soon you can afford a home, but also the tradeoffs you will need to make. In markets where the income gap has closed or narrowed, the question shifts more from whether you can afford to buy to whether you want to put down roots in a certain location.
The future snapshot of U.S. home affordability
The national housing affordability picture in 2026 is genuinely mixed. This should be treated as more hopeful than it sounds, though, given where things stood just two years ago.
In the most expensive states, the income required to buy a median-priced home is still nearly double what median households earn. Even in those markets, the trend has finally started moving in buyers’ favor. In a meaningful cluster of states, including Iowa, Ohio, Indiana, Michigan, Missouri, and West Virginia, the story is cleaner. These markets represent real opportunity, particularly for homeowners willing to look beyond their current geography. For those with equity already built up, having that flexibility could mean the difference between stretching indefinitely in a market that doesn’t work and planting roots in one that does.
Methodology
To determine the household income required to afford a median-priced home in each state, Splitero applied standard mortgage qualification criteria used by most conventional lenders. Splitero started with Zillow’s median home sale price for January 2026 and assumed a 20% down payment (the threshold that eliminates private mortgage insurance), leaving an 80% loan-to-value ratio. The remaining balance was amortized over a 30-year fixed term at 6.65%, the prevailing rate per Freddie Mac's Primary Mortgage Market Survey as of March 2026, using the standard annuity formula to derive monthly principal and interest. Splitero then layered in two additional carrying costs that lenders include in their qualifying calculations: monthly property taxes, derived from each state's average effective tax rate as reported by the Tax Foundation using 2024 American Community Survey data, and monthly homeowners insurance, based on MoneyGeek's 2026 state-average annual premium for a standard policy divided by 12.
These three components, principal and interest, property taxes, and insurance, were summed to produce each state's total monthly housing obligation. Finally, Splitero calculated the minimum gross household income by applying the 28% front-end debt-to-income ratio, the conventional ceiling most lenders use to determine how much of a borrower's pre-tax income can go toward housing. The resulting figure represents the annual gross income a household would need to keep its housing payment at or below that 28% threshold, and states were ranked from highest required income to lowest. These figures were then compared to state-level median household income figures from the Federal Reserve Bank of St. Louis to identify the largest discrepancies between
We acknowledge that buyers with smaller down payments face higher income requirements.
This story was produced by Splitero and reviewed and distributed by Stacker.


