
How mortgage rates compare through the decades
Mortgage rates are one of the most influential drivers of the U.S. housing market dynamic, but they are often misunderstood. And, for generations of homebuyers, the interest rate attached to a mortgage loan has dramatically shaped affordability, savings, and the trajectory of wealth building through homeownership.
Today, however, buyers face mortgage rates that are far above the record lows seen during recent decades. To understand what the highs and lows truly mean, as well as to appreciate how historical conditions affect changing prices and incomes, it’s crucial to examine how mortgage rates have trended over time. Splitero has compiled mortgage rate insights from Freddie Mac, U.S. Federal Housing data, the Bureau of Labor Statistics, and Federal Reserve Economic data to examine how mortgage rates have changed and break down what it means for buyers across generations.
How mortgage rates have shifted through the decades
As economic conditions have changed over the decades, 30-year mortgage rates have fluctuated with them. The following data, compiled from the Federal Reserve Bank of St. Louis and collected from 1970 to 2025, demonstrates the differences over the years.
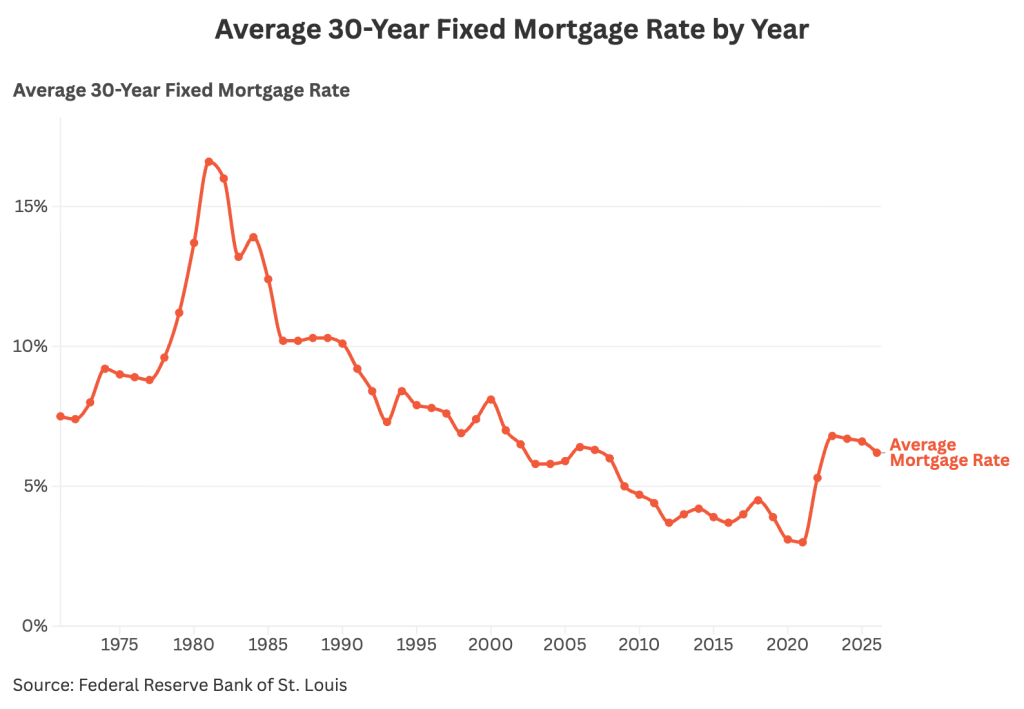
Understanding these historical shifts helps explain why today's rate environment and homeowners' equity positions look the way they do.
Starting in the 1970s, rising inflation and tighter monetary policy caused rates to climb rapidly from the mid-7% range. By 1979, the average 30-year fixed mortgage rate exceeded 11%.
Rates reached their highest levels ever in the early 1980s, when the Federal Reserve aggressively raised rates to tame inflation. With averages peaking around 16% in 1981, the borrowing environment was one that even modern buyers can scarcely imagine.
From that peak, rates began a long, gradual decline. By the 1990s, strong economic growth and easing inflation brought averages into the 7-10% range. While this was still high by today’s standards, it was a significant improvement for borrowers at the time.
The 2000s saw rates hover in the mid-5% to low-7% range, though loose lending practices like subprime and adjustable-rate mortgages masked underlying risks. After the financial crisis of 2008, the Fed’s response pushed rates even lower.
The 2010s and early 2020s brought historically low rates, often lingering between 3%-5%, and dipping below 3% in 2020 and 2021. This fueled a housing frenzy around the time of the pandemic and helped homeowners build the record equity levels we see today.
In response to this increased demand, the Federal Reserve tightened in 2022 and 2023, pushing mortgage rates back above 7%. By late 2025, averages have settled into the mid-6% range, marking the lowest levels in several years and a window that may encourage homeowners to tap their equity.
Adjusting for inflation and home prices: Who really had it harder?
Just comparing mortgage rates at face value doesn’t tell the whole story. Real affordability also depends on how rates interact with home prices and incomes. To illustrate, we consider the cost of buying a home as a percentage of income over the years.
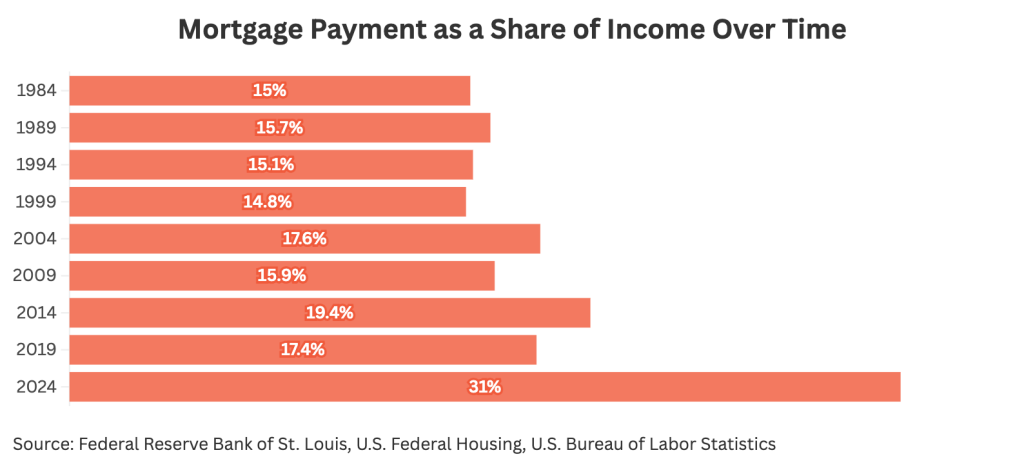
In January 1984, the median home sale price was $79,950, and the average 30-year mortgage rate was 13.9%. With a 20% down payment, a buyer's monthly mortgage payment would have been approximately $753, about 15% of the median household income at the time.
Fast forward to 2024: the median home price has risen to approximately $419,000, while rates have dropped to 6.7%. That sounds like progress, until you calculate the monthly payment. With a 20% down payment, today's buyer would pay roughly $2,163 per month, or about 31% of median household income.
In other words, despite rates being cut nearly in half, today's buyers face a larger monthly burden relative to their earnings. The culprit isn't rates alone, it's the combination of home prices rising faster than wages over four decades.
Generational Impact: Boomers vs. Gen X vs. Millennials and Gen Z
Each generation has entered the housing market under a unique set of conditions. These are the key trends.
- Baby boomers: Boomers benefited from declining rates through the 1980s and 1990s alongside comparatively affordable home prices, allowing significant wealth accumulation through home equity. Today, 74% own their homes, the highest rate of any generation.
- Generation X: Gen X saw moderate rates during the late 1990s and 2000s, but Gen X homeowners in their 30s and 40s were potentially hit hard by foreclosures when the housing bubble burst. However, Gen X homeownership rates have since rebounded from roughly 50% in 2005 to 65% in 2024, after remaining relatively stagnant from 2005 to 2015.
- Millennials: Despite entering adulthood during a low-rate era (before the 2008 crash to the mid 2010s), Millennials faced skyrocketing home prices and tighter lending conditions. Their homeownership rate at ages 25-34 was approximately 8% lower than Boomers and Gen Xers at the same age.
- Gen Z: Gen Z faces elevated rates and near-record home prices, leading many to delay purchasing. A 2025 survey found that 97% report facing barriers to homeownership, with high prices cited as the top obstacle.
What today’s buyers can learn from history
Mortgage rates have swung dramatically over the past five decades, from the double-digit peaks of the early 1980s to the sub-3% lows of the pandemic era. However, the story of housing affordability isn’t just about the interest rates on paper. As the data shows, today's buyers dedicate a larger share of their income to mortgage payments than buyers in 1984, despite rates being half of what they were then. And generational trends reveal that younger buyers face compounding barriers their parents didn't.
Rates may feel high compared to recent years, but they sit at levels that were relatively normal or even favorable for much of the last half-century. The real barrier today isn't the rate itself, but what buyers are financing: home prices that have far outpaced wage growth.
This story was produced by Splitero and reviewed and distributed by Stacker.


