Where and why housing is becoming unaffordable
The Details Behind Home Costs
It’s been a rough few years for home buyers, especially first-time purchasers eager to embark on the path to homeownership. A perfect storm of unfavorable conditions — including continued high list prices, steeper mortgage rates, prolonged inventory shortages, and steep property tax and insurance bills — has put the squeeze on Americans and contributed to their inability to form households or move up or down to next properties. While there are some positive signs in the market lately, many areas remain unaffordable to a wide swath of prospective owners.
In this article, TheZebra takes a closer look at how we got to this point, the various challenges buyers face, key metros where prices remain out of reach, and predictions from the experts on affordability looking ahead.
Housing Affordability: Why the Crisis Has Deepened
The latest numbers paint a sobering picture for aspiring home buyers. Per the National Association of Realtors’ (NAR) latest data (October 2025), the median sales price for all housing types is currently $415,200, an increase of 2.1% from one year ago and the 28th straight month of year-over-year price increases. Home prices rose in 77% of metro areas (176 of 230) during the third quarter of 2025, up from 75% in the previous quarter. Around 4% of metro markets posted double-digit gains, slightly below the 5% recorded in the second quarter, according to NAR data.
According to the Joint Center for Housing Studies of Harvard University’s State of the Nation's Housing 2025 report, U.S. home prices are up roughly 60% nationwide since 2019, pushing the median existing single-family home price to around five times the median household income, well above the traditional affordability benchmark price-to-income ratio of three. Home buyers are now looking at monthly mortgage payments of $2,570 on median-priced homes, which requires a yearly income of at least $126,700 just to meet standard lender debt-to-income limits. The number of cost-burdened owner households (those spending more than 30% of income on housing and utilities) now accounts for about 24% of all homeowners, according to the Joint Center for Housing Studies report.
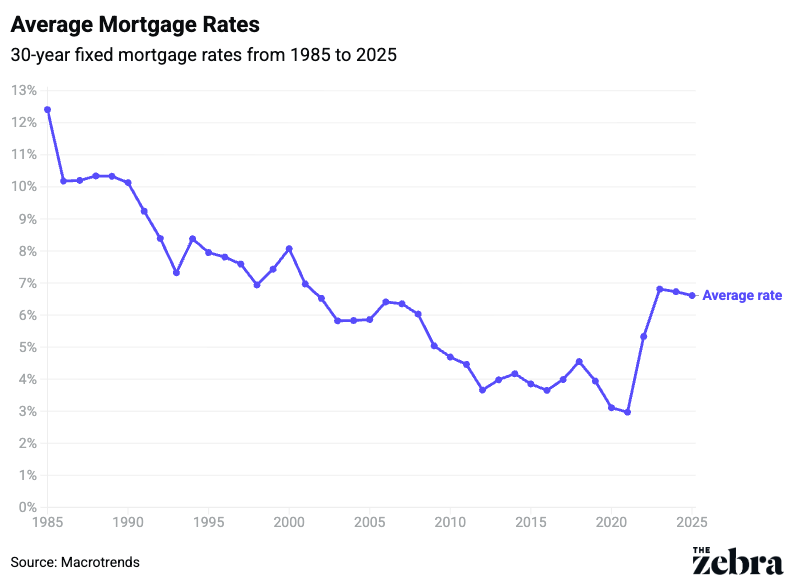
“Additionally, mortgage rates have increased from around 2.7% five years ago to a peak near 8% in 2023 and, even after the recent rate cuts, have hovered around 6%,” says Albert Lord, founder and CEO of Lexerd Capital Management. “Monthly mortgage payments have jumped 82% in five years, while incomes have risen only 26%.”
Additionally, labor shortages have compounded the lack of housing supply; Lord points out that the construction industry faces a shortfall of 350,000 monthly workers, adding two months to new home build times and $10.8 billion in annual economic losses, with 19,000 fewer homes being built. Factor in increased costs in building materials — which are up 41.6% since the COVID-19 pandemic — with the added burden of tariffs (which are expected to add $10,900 per new home), increased zoning regulations, and activity from investors (who have purchased up to 33% of single family homes in early 2025, a five-year high), and it’s clear to see that the deck is stacked against many hopeful buyers.
Ask Nadia Evangelou, senior economist and director of Real Estate Research for the NAR, and she’ll tell you that it’s multiple factors like these that have pushed plenty of shoppers away from the market.
“Affordability has weakened because mortgage rates surged while we were already short on homes,” she says. “We have underbuilt for years, so buyers are still competing for too few listings. Inventory has improved, but not at the prices people actually need it to be. Right now, middle-income buyers can afford only about 21% of listings, and we are still missing roughly half a million homes priced at or below $260,000. Until the market adds homes at those price points, affordability will remain tight.”
The New Barriers to Homeownership
Add to these hurdles the increasing concern over rising homeowners insurance rates.
“Insurance has become more expensive and, in some regions, harder to secure due to climate-related risks,” explains Beth Swanson, one of The Zebra's insurance analysts. She points to California as an alarming example of a state where steep increases in both home prices and home insurance costs — driven mainly by climate risk and the rising expense of rebuilding — are putting extra pressure on homeowners and buyers alike. “The data show higher-frequency, higher-severity events in recent years. Losses like these translate into higher insurance premiums, stricter underwriting, or in some areas, fewer insurers willing to write new policies.”
Dennis Shirshikov, a professor of finance and economics at Queens College, CUNY, believes a lack of buying confidence is another recent impediment to purchasing.
“Just a few years ago, the talk about what was preventing Americans from gaining a foothold in the housing market centered on student debt, down payments, and price appreciation,” Shirshikov says. “Today, however, another growing impediment is economic confidence. House hunters are asking themselves: Am I willing to buy when so much else feels wrong?”
What’s more, current homeowners remain reluctant to list their properties for sale.
“They’re not willing to give up the 2.5% to 3.5% mortgages they secured a few years ago to trade up to a bigger, more expensive home with a 6.5% mortgage today,” says Rick Sharga, president and CEO of CJ Patrick Company.
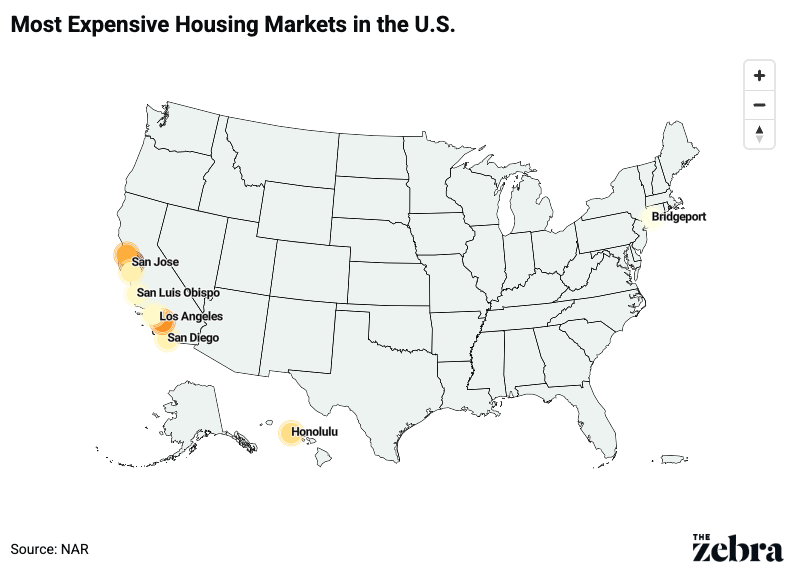
Where Are the Most Unaffordable Markets?
Currently, the 10 most expensive markets in the country, as identified by the National Association of Realtors (NAR), are:
- San Jose-Sunnyvale-Santa Clara, Calif. (third quarter 2025 median sales price: $1.915 million, up 0.8% year over year)
- Anaheim-Santa Ana-Irvine, Calif. ($1.4 million, +0.1%)
- San Francisco-Oakland-Hayward, Calif. ($1.315 million, +0.5%)
- Urban Honolulu, Hawai’i ($1.128 million, -0.9%)
- Salinas, Calif. ($1.019 million, +6.3%)
- San Diego-Carlsbad, Calif. ($1.009 million, 0.0%)
- Los Angeles-Long Beach-Glendale, Calif. ($954,100, +0.7%)
- Oxnard-Thousand Oaks-Ventura, Calif. ($935,700, -1.2%)
- San Luis Obispo-Paso Robles, Calif. ($931,800, -1.9%)
- Bridgeport-Stamford-Norwalk, Conn. ($844,900, +7.8%)
The inclusion of many metros named on that former list, topped by San Jose, doesn’t surprise Evangelou.
“In markets like San Jose and Los Angeles, there are a lot of high-income jobs and not enough housing. The land is limited, zoning is restrictive, and it takes a long time to build,” she notes, adding that she doesn’t expect these 10 rankings to change much in the coming years. “There may be some movement, but many of the same markets will stay near the top. We could also see fast-growing markets move up the list if housing construction doesn’t keep up with population and job growth.”
Consider that most of the areas on that 10 most expensive list are coastal California metros, where the same basic recipe applies, per Shirshikov: very high incomes for a subset of workers living there, severe land-use constraints and regulations that limit new construction, and decades of underbuilding relative to job growth.
Areas with the highest increases in 2025
Meanwhile, the 10 largest markets with the highest year-over-year median home price increases are Trenton, New Jersey (+9.9%); Lansing/East Lansing, Michigan (+9.8%); Nassau/Suffolk, New York (+9.4%); New Haven/Milford, Connecticut (+9.0%); New York/Jersey City/White Plains, New York-New Jersey (+8.1%); Manchester/Nashua, New Hampshire (+8.0%); St. Louis, Missouri (+7.9%); Bridgeport/Stamford/Norwalk, Connecticut (+7.8%); Toledo, Ohio (+7.7%); and Cleveland-Elyria, Ohio (+7.7%).
Identifying Regional Housing Trends
Median prices for existing single-family homes vary across regions, the NAR reports.
- In the Northeast, prices have risen to $540,100 (up 6.0%).
- In the Midwest and South, they’ve hit $331,100 (up 4.2%) and $372,800 (up 0.5%), respectively.
- Prices in the West, meanwhile, dipped slightly to $633,900 (down 0.1%).
Price gains were most robust in locations with tight housing supply, particularly in the Northeast and parts of the Midwest, while modest declines in several southern markets show the impact of significant new construction. But these softer Southern prices are considered temporary, a hypothesis bolstered by strong job growth.
“The South and Midwest are generally more affordable, because it’s easier to build there. The Northeast and West, meanwhile, tend to be more expensive due to land constraints and regulations. That gap is likely to stick around,” continues Evangelou.
But Sharga notes that Midwest and Northeast markets, where inventory remains extra low, are still seeing home prices increase by 3% to 6%.
“However, in other parts of the country, particularly the South, Southeast, and Mountain states, where inventory is much higher, we are seeing prices fall,” he adds.
Housing Forecast: Will Affordability Improve Anytime Soon?
The experts spot a few silver linings among the affordability gray clouds. First, the NAR noted in its third quarter report that 23% of markets saw home prices decline. Additionally, the typical existing single-family home with a 20% down payment now carries a slightly lower monthly mortgage of $2,187, down 2.8% from the previous quarter, with families spending an average of 24.8% of their income on payments, down from 25.6% last quarter and 25.2% last year. Also, first-time buyers are allocating a slightly smaller portion of their income to payments: 37.4% versus 38.6% last quarter and 38.1% a year earlier.
“Also, more inventory is coming. Realtor.com has forecast an 8.9% increase in existing inventory for 2026. More listings lead to more supply — and more negotiating power for buyers,” says Lord. “Also, price cuts are becoming common. The average time to sell a home is longer now (62 days), which gives buyers an advantage. Additionally, institutional investors are now net sellers for six consecutive quarters; almost 45% of their sales go to traditional buyers. And more politicians are paying attention to this focus on housing. So far, 22 states have introduced favorable legislation to make housing more affordable, while zoning reforms have gained traction in a few states.”
Selma Hepp, senior vice president and chief economist for Cotality, also expresses optimism for buyers in 2026.
“Price momentum has cooled, listings are rebuilding, more builders are offering incentives like rate buy-downs to buyers, and rates are easing, creating more choices for first-time buyers,” she says. “I expect gradual, uneven improvement into 2026, with rates remaining in the low 6% range, flatter home prices, and modest inventory gains.”
Shirshikov anticipates that affordability will continue to improve at the national level over the next few years, though not at the pace most buyers and renters would prefer.
“There will be wild price variations from region to region and metro to metro. The most likely outcome is not a crash in home prices across the country, but a gradual adjustment in which mortgage rates fall back from their recent highs and income slowly catches up, with expectations of price growth to average out over the longer run,” he says. “I’m encouraged that the market has begun to transition from ‘panic and bid up the price to whatever it takes’ in many metros. Moving toward a more balanced price-bidding environment matters because expectations drive behavior. Overall, the indications are that we could be past the worst of the mortgage payment shock if rates continue to slip as they have been.”
Sharga reminds readers that current home price appreciation (2.1%) is actually lower than the rate of inflation (3%) and wage growth (roughly 4%).
“In some markets, especially states like Florida and Texas, and certain metro areas where home prices skyrocketed during COVID, like Boise, Las Vegas, and Phoenix, prices have actually declined year-over-year while mortgage rates are down by about a half percentage point,” continues Sharga. “That combination — rising wages, flat or declining home prices, and lower mortgage rates — will help at least some buyers be able to afford to become homeowners in 2026.”
This story was produced by TheZebra and reviewed and distributed by Stacker.


