
Where home prices increased most: 2026 study
Home values can reflect cost of living trends in an area, giving hopeful homebuyers as well as existing homeowners a pulse on the momentum in their local market. Between 2025 and 2026, the typical home value in large U.S. cities actually declined by 1.04%, with values dropping in 70% of cities. But the full range of changes from market to market ran the gamut from a decrease of 9.1% to a 5.6% increase, putting both hopeful buyers and homeowners in starkly different environments across the nation.
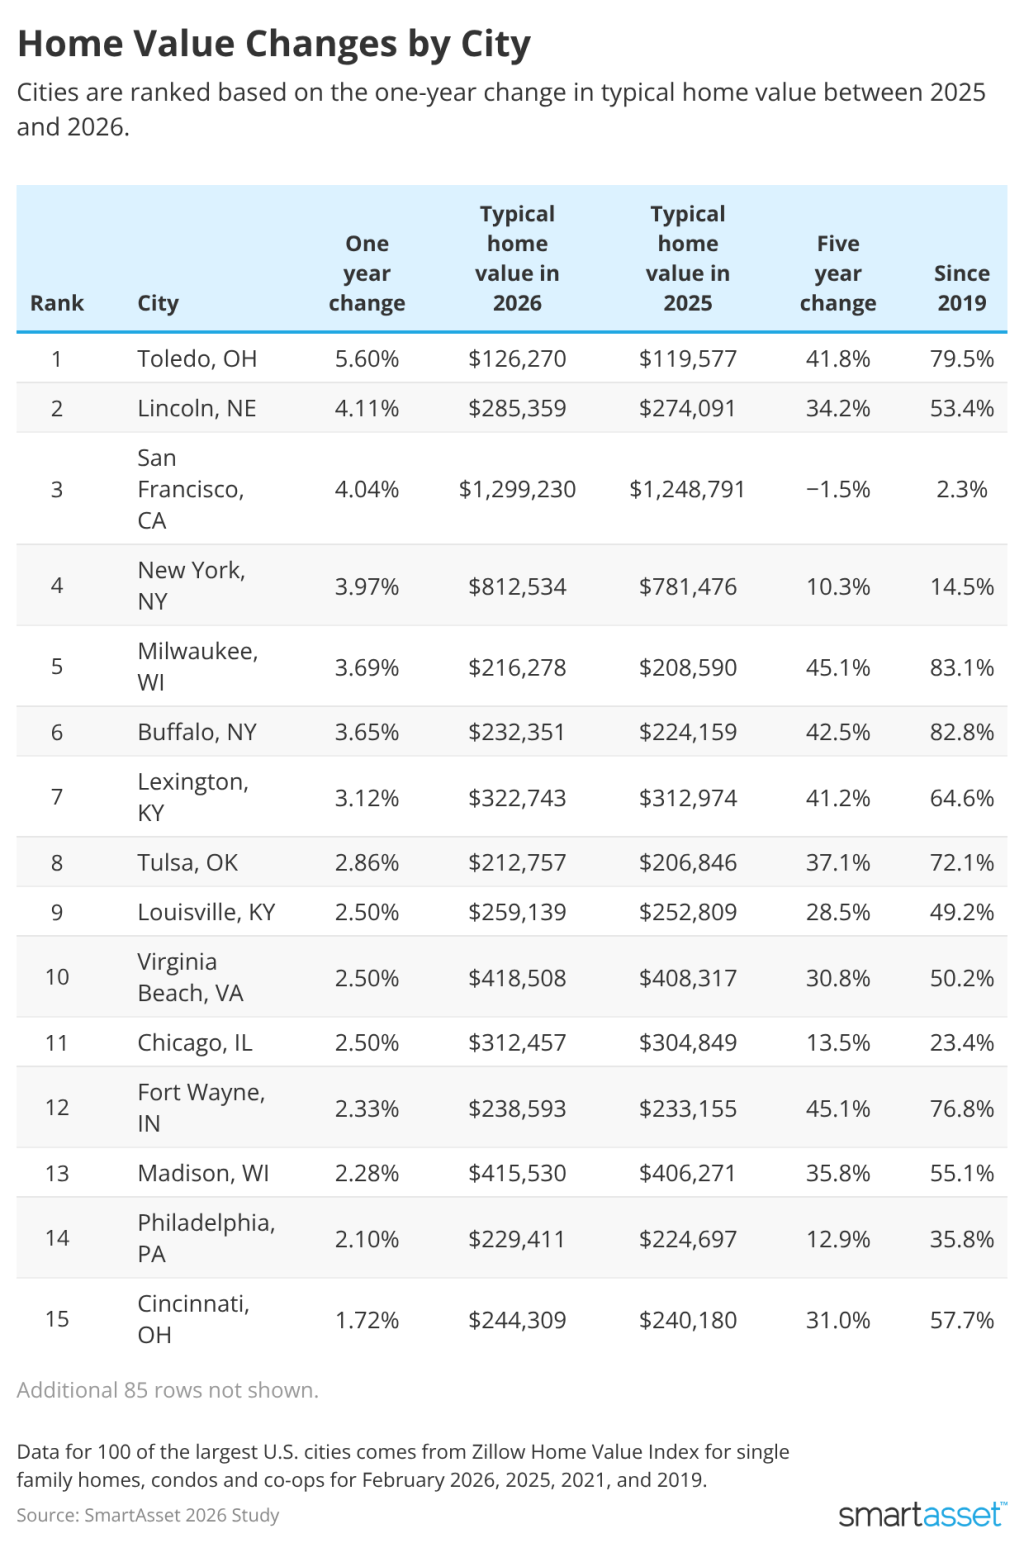
With this in mind, SmartAsset ranked 100 of the largest U.S. cities based on the one-year change in the typical local home value. Changes over the last five years and from pre-pandemic times are also reported.
Key Findings
- These midwestern cities contend with San Francisco, NYC for increasing home values. Toledo, Ohio ranked number one for highest home value increase at 5.6% year over year, with a resulting typical home value of $126,270. Lincoln, Nebraska ranked second with a 4.1% increase putting homes at a typical $285,359. San Francisco and New York City — among some of the priciest housing markets nationwide at a typical value of $1.3 million and $800k respectively — ranked third and fourth for price growth at roughly 4.0% each.
- Typical homes cost over $1.5 million in Irvine, CA. Of large U.S. cities, Irvine has the most expensive homes this year at a typical value of $1,541,925. Despite a 0.6% decrease in values year over year, Irvine maintains the largest five-year value increase at 70.1%. San Jose, California, which has the second highest home value in 2026 at $1,435,993, experienced a larger year-over-year decline of 2.7%.
- Home values fall more than 9% in this Bay Area city. Oakland, California experienced the steepest decline in home values at 9.1% in just one year, dropping from $770,708 to $700,829. It is also the only large city where home values declined since 2019 (6.7%). Over the past year, home values in St. Petersburg, FL (7.5%); Naples, FL (6.4%); Austin, TX (6%); and Plano, TX (5.1%) follow Oakland with some of the steepest declines.
- Since pre-pandemic, home values increased most in Knoxville, TN. Over the last seven years, the typical home value in Knoxville increased 94.0%, nearly doubling from $187,490 to $363,688 today. On average, home values in big cities have increased 48.6% over this time period.
Top 10 Cities Where Home Values Increased Most
- Toledo, Ohio
- One year change: 5.60%
- Typical home value in 2026: $126,270
- Typical home value in 2025: $119,577
- Five year change: 41.75%
- Change since pre-pandemic: 79.48%
- Lincoln, Nebraska
- One year change: 4.11%
- Typical home value in 2026: $285,359
- Typical home value in 2025: $274,091
- Five year change: 34.15%
- Change since pre-pandemic: 53.44%
- San Francisco
- One year change: 4.04%
- Typical home value in 2026: $1,299,230
- Typical home value in 2025: $1,248,791
- Five year change: -1.46%
- Change since pre-pandemic: 2.25%
- New York City
- One year change: 3.97%
- Typical home value in 2026: $812,534
- Typical home value in 2025: $781,476
- Five year change: 10.29%
- Change since pre-pandemic: 14.53%
- Milwaukee, Wisconsin
- One year change: 3.69%
- Typical home value in 2026: $216,278
- Typical home value in 2025: $208,590
- Five year change: 45.08%
- Change since pre-pandemic: 83.14%
- Buffalo, New York
- One year change: 3.65%
- Typical home value in 2026: $232,351
- Typical home value in 2025: $224,159
- Five year change: 42.51%
- Change since pre-pandemic: 82.79%
- Lexington, Kentucky
- One year change: 3.12%
- Typical home value in 2026: $322,743
- Typical home value in 2025: $312,974
- Five year change: 41.15%
- Change since pre-pandemic: 64.61%
- Tulsa, Oklahoma
- One year change: 2.86%
- Typical home value in 2026: $212,757
- Typical home value in 2025: $206,846
- Five year change: 37.10%
- Change since pre-pandemic: 72.06%
- Louisville, Kentucky
- One year change: 2.50%
- Typical home value in 2026: $259,139
- Typical home value in 2025: $252,809
- Five year change: 28.50%
- Change since pre-pandemic: 49.20%
- Virginia Beach, Virginia
- One year change: 2.50%
- Typical home value in 2026: $418,508
- Typical home value in 2025: $408,317
- Five year change: 30.83%
- Change since pre-pandemic: 50.24%
Top 10 Cities Where Home Values Decreased Most
- Oakland, California
- One year change: -9.07%
- Typical home value in 2026: $700,829
- Typical home value in 2025: $770,708
- Five year change: -15.52%
- Change since pre-pandemic: -6.65%
- Saint Petersburg, Florida
- One year change: -7.47%
- Typical home value in 2026: $345,243
- Typical home value in 2025: $373,112
- Five year change: 28.01%
- Change since pre-pandemic: 56.47%
- Naples, Florida
- One year change: -6.35%
- Typical home value in 2026: $548,175
- Typical home value in 2025: $585,350
- Five year change: 43.98%
- Change since pre-pandemic: 55.48%
- Austin, Texas
- One year change: -5.93%
- Typical home value in 2026: $500,627
- Typical home value in 2025: $532,202
- Five year change: 6.88%
- Change since pre-pandemic: 32.41%
- Plano, Texas
- One year change: -5.10%
- Typical home value in 2026: $501,564
- Typical home value in 2025: $528,510
- Five year change: 32.43%
- Change since pre-pandemic: 44.13%
- Aurora, Colorado
- One year change: -4.43%
- Typical home value in 2026: $458,953
- Typical home value in 2025: $480,216
- Five year change: 15.40%
- Change since pre-pandemic: 31.61%
- Denver
- One year change: -4.32%
- Typical home value in 2026: $530,920
- Typical home value in 2025: $554,868
- Five year change: 10.98%
- Change since pre-pandemic: 24.67%
- Atlanta
- One year change: -3.95%
- Typical home value in 2026: $381,549
- Typical home value in 2025: $397,252
- Five year change: 11.15%
- Change since pre-pandemic: 22.57%
- Stockton, California
- One year change: -3.95%
- Typical home value in 2026: $426,138
- Typical home value in 2025: $443,665
- Five year change: 17.14%
- Change since pre-pandemic: 39.30%
- Tampa, Florida
- One year change: -3.93%
- Typical home value in 2026: $369,079
- Typical home value in 2025: $384,167
- Five year change: 36.35%
- Change since pre-pandemic: 65.02%
Data and Methodology
This study examined home sale data for 100 of the largest metro areas in the U.S. to determine one-year and five-year price growth. Data for February, 2026, 2025 and 2021 comes from Zillow’s Home Value Index for single-family homes, condos and co-ops.
This story was produced by SmartAsset and reviewed and distributed by Stacker.


