
Where homeowners have gained the most equity since 2019
Between 2019 and mid-2025, the housing market in America has rewritten what it means to build home equity. From small Southern metros to massive coastal abodes, homeowners have seen property values soar or stagnate depending on where they live. To find out which markets saw the biggest gains over this six-year time period, Splitero analyzed Federal Housing Finance Agency (FHFA) home price index data from both 2019 and 2025 to measure annual changes in home prices. This story provides aggregated snapshots of how much equity the standard homeowner has gained in the last several years.
Key Takeaways
- Atlantic City, Knoxville, Athens (GA), and Hilton Head are among the biggest winners, each adding roughly 90% in home equity for the typical homeowner.
- Fifteen major metros, including San Francisco and Lake Charles, lagged badly with home price increases under 40%, barely growing despite already-high values.
- The Southern Atlantic corridor, from Florida through the Carolinas into Tennessee, now dominates housing wealth growth; 16 out of the 22 metro areas with house price indexes increasing above 80% from 2019 to 2025 are positioned in this region.
The equity growth leaders
The biggest winners across the country weren’t in the traditional power markets for real estate. It was instead mid-sized metros in the South and Southeast regions of the country that dominated. Fueled by factors including pandemic-era migration, remote work flexibility, and relatively affordable starting prices, the following snapshot compiling data from the FHFA tells a unique story. 22 of the 233 most populous metro areas saw their house price indexes increase above 80% from 2019 to 2025.
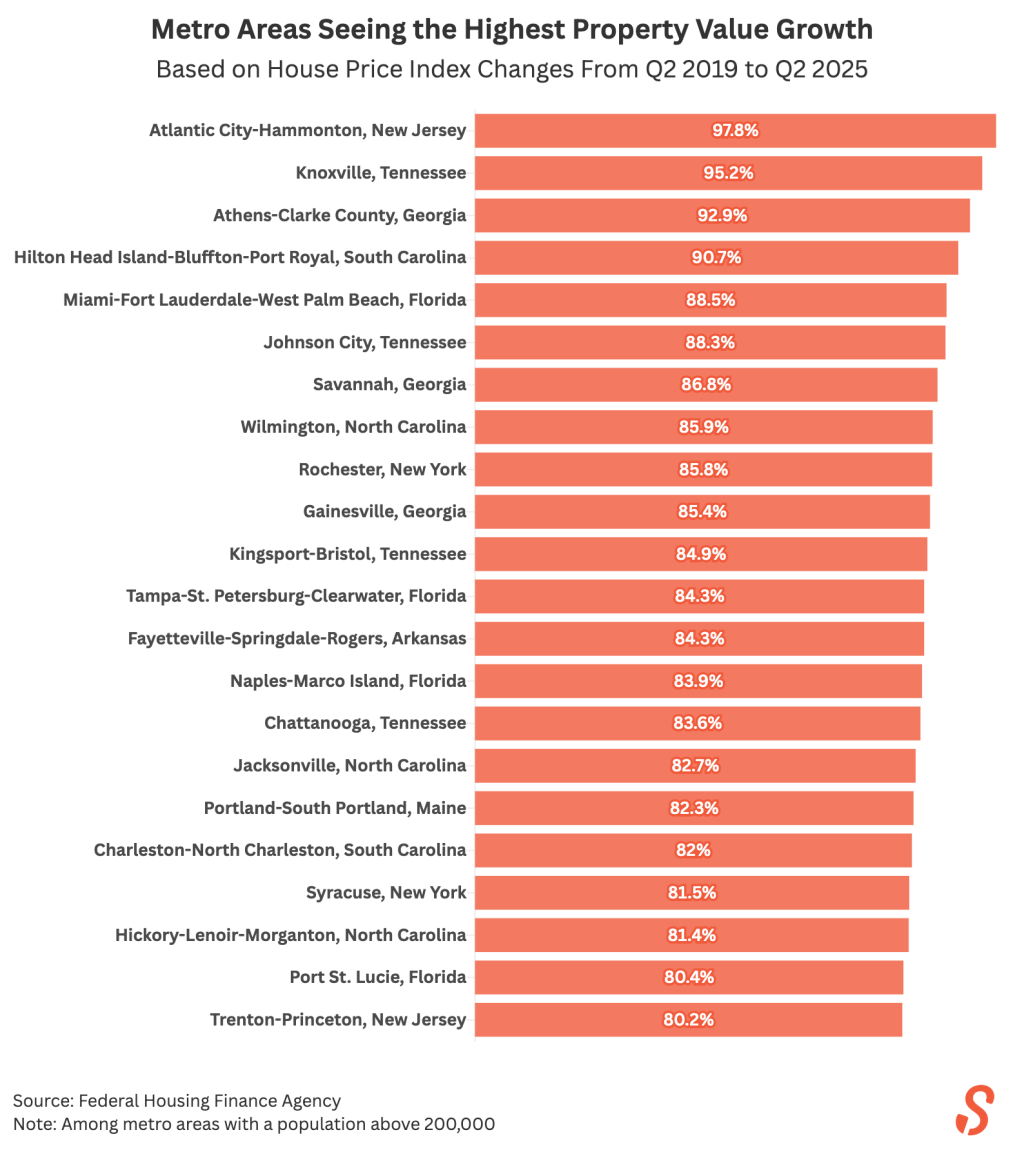
Atlantic City-Hammonton in New Jersey tops the list with a staggering 97.8% jump in home values between Q2 2019 and Q2 2025. Hammonton average prices were a little over $300,000 and Atlantic City prices were a little over $200,000 in Q2 2019, resulting in an average home price for the areas of around $220,000. This means that the 97.8% average jump results in an increase of roughly $215,000 in equity for owners in that market.
Right on the heels of this region are Knoxville, Tennessee (95.2%), Athens, Georgia (92.9%), and Hilton Head Island, South Carolina (90.7%). Again, pandemic-era relocations met limited supply in these markets. Based on the same data, average home prices in Knoxville hovered around $190,000 back in 2019, resulting in roughly $180,000 in new equity for homeowners in the market.
The pandemic effect stemmed from homebuyers leaving more traditionally expensive metropolitan hubs like San Francisco or New York for less crowded metros where a down payment stretched further. As outlined by Brookings, a non-partisan research provider based out of Washington D.C., the 50 major metropolitan hubs with populations over one million across the United States saw a noticeable decline throughout the pandemic. Markets like Atlantic City, Hammonton, and Knoxville not only offered affordability but also appealing lifestyle offerings that likely drove higher demand amid tight inventory, resulting in higher prices in 2025.
As covered by research from professors Xialu Liu of San Diego State University and Lei Lei of Rutgers University, analyzing Google Trends keyword searches from 2020, the researchers observed a marked increase in searches for permanent relocation options. The professors found that lockdown strictness, educational options, proximity to family and medical care, as well as working conditions, all components of lifestyle, were the primary motivators for this shift.
The slowdown markets
On the other end of the spectrum, some metros barely moved the needle over the past six years. Of the 233 most populous metro areas, 15 saw their house price indexes increase by less than 40% from 2019 to 2025. Lake Charles, Louisiana, in particular, saw the least growth in home prices at 14.3% from 2019 to 2025, followed by a clustering of cities in the San Francisco Bay Area at 23.3%. The vast majority of the underperformers are sitting in markets that either started from already-high valuations or faced local economic headwinds.
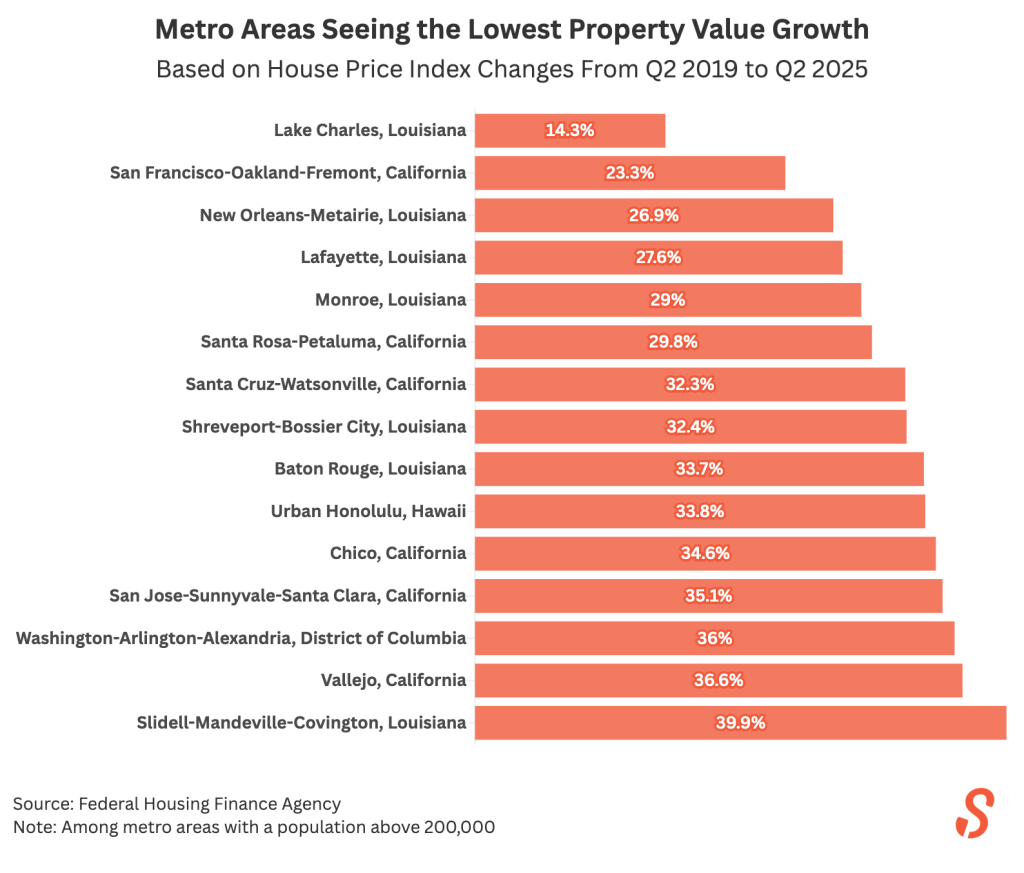
Louisiana, in particular, was faced with back-to-back hurricanes in 2020 and 2021. This, coupled with general industry slowdowns amidst the pandemic, is the most likely driver for dampened local demand. In California, the culprit is a little different. Bay Area pricing has long been notoriously high, and as price fatigue has set in over recent years, modest percentage gains in already-expensive markets like Santa Rosa and San Francisco translate to little equity earned.
To add some perspective, five-year data from Zillow shows that homes in Santa Rosa and San Francisco had average values of $602,175 and $1,271,393 at the end of June, 2019. In June 2025, average values as reported by Zillow for homes in those markets were $716,522 and $1,248,805, respectively. San Francisco homes themselves saw a decline, whereas gains in Santa Rosa were marginal, from a percentage basis, despite the fact that equity did, in fact, increase.
Now, compare this to a top performer from the prior list, such as Hammonton, New Jersey. Average home values in that city based on Zillow estimates were $221,633 at the end of June 2019 versus $363,466 in the same period this year. Home prices may be far lower in this market, but equity earned on a percentage basis is far higher given the lower average home price starting point.
When equity growth outpaces local wages: Affordability implications
While rising home equity boosts household wealth, it can also inadvertently deepen the affordability divide. In many of the top-gaining metros around the country, wages haven’t kept pace. According to data from the Federal Reserve Bank of St. Louis, the real median household income in the United States in 2019 was $83,260. In 2024, the last full year in the study, the median income was $83,730. This differential clearly does not match the rapid equity growth in certain housing markets across the country.
As a result, affordability pressure has pushed renters and new buyers into outlying suburbs or even out of their home state in an effort to find homes that fit their budget. This inevitably changes the cultures of cities around the country.
Regional patterns: Why geography matters
Geography still remains one of the most important indicators for real estate pricing. In particular, the following trends are still seen:
- Southeast and Mountain West: Migration-driven growth, lower cost of living, and favorable tax environments have fueled demand, with leading real estate listing provider Realtor.com noting 46% of their clients moved to the South in 2024 as opposed to only 25% who moved West.
- Northeast and California: Slower gains due to high starting prices, limited population growth, and post-pandemic outmigration have stifled migration to the state, with U-Haul migration data nationwide ranking California last in 2024 at an arrival percentage of 49% versus a departure percentage of 51%.
- Gulf South: Stagnation can often be linked to weather risks, insurance costs, and energy-sector volatility, coupled with the appeal of the Southeast as outlined previously.
The aforementioned FHFA data also seems to indicate that the Southern Atlantic corridor, specifically the region from Florida through the Carolinas up towards Tennessee, has quickly emerged as one of the new centers of U.S. home price momentum. Sixteen out of the 22 metro areas with house price indexes increasing by more than 80% from 2019 to 2025 are located in this region.
What this means for homeowners
For homeowners living in top-performing metros, the equity boom represents a nice cushion against inflation and perhaps even a source of funds for eliminating high-interest debt or planning for retirement. For buyers and policymakers, though, it also signals an urgent affordability issue.
Should mortgage rates continue to ease during 2026, it wouldn’t be unreasonable to expect renewed activity in markets that underperformed over the last six years. As buyers who left those markets in an attempt to get into lower-cost areas around the country continue to settle into their new homes, it’s possible that the population gap left by their departure may stimulate more favorable home pricing in some of the country’s most crowded metros due to lower demand.
Riding the next wave of home equity
The past six years have redefined housing wealth in America. Some metros, particularly in the Southeast, have nearly doubled in homeowners’ equity, whereas others have barely kept pace. Location remains a natural driver of long-term equity growth, but timing also plays a significant role.
As the next housing cycle begins, if you are a homeowner sitting on large equity gains, your home equity could provide you with the funds to make home renovations or pursue necessary maintenance projects, all of which help to preserve and grow the value of your home. Many Splitero homeowners use the funds from their agreement to tackle these types of projects, enabling them to address essential home upgrades without altering their existing mortgage or taking on monthly payments.
Methodology
We analyzed home price index data from the Federal Housing Finance Agency (FHFA) from 2019 to 2025 to measure the changes in homeowner equity, on a percentage basis, across six years. This data was compiled using information from all 50 states. Specifically, we compiled home price index data from the second quarter of 2019 to the second quarter of 2025 for metro areas with a population above 200,000. Average home price data from Zillow for select cities was also utilized.
This story was produced by Splitero and reviewed and distributed by Stacker.


