
How employees use EAP services: Key trends and utilization rates
Adopting an employee assistance program (EAP) is a strategic move toward building a healthier and more productive workforce. However, investing in an EAP service is only one piece of the puzzle. The next and most crucial step to maximize this valuable investment is to cultivate widespread, consistent employee utilization across your organization. This allows you to tap into the transformative impact of this service.
The adoption rate of EAP services among employers has increased in recent years, due to their impact on employee well-being, productivity, and business outcomes. Despite this increasing adoption, EAP utilization rates among employees are not always high. Underutilization of a service as beneficial as EAPs signals rectifiable problems, such as lack of awareness, confidentiality concerns, mental health stigma, and service complexities, among other structural challenges.
EAPs are as effective for organizational growth and productivity as the number of employees who utilize them. In light of the widespread adoption of EAPs by employers and the recent shift to modern, digital accessibility, AllOne Health, a U.S.-based EAP provider, conducted a study to explore usage trends and patterns across various EAP service categories.
The study, which was published in the Journal of Psychology and Behavioral Science in 2024, utilized data provided by AllOne Health, covering over 59,000 work/life benefit requests by employees from 4,981 different organizations across a five-year period, and analyzed details such as employee age and employer industry. This guide breaks down key trends and EAP utilization rates, while also highlighting tips for increasing employee usage.
What Share of U.S. Workers Have Access to EAPs?
Data shows that over 3.2 million private-sector employer organizations provided EAPs for their employees in 2022, as well as 182,000 government and public-sector organizations. According to the United States Department of Labor, Bureau of Labor Statistics, 61% of all workers had access to EAPs in 2024.
The size of the organization often influences access to EAPs — the larger the employer, the more access employees have to the services provided. For instance, data shows that a higher percentage of individuals working in organizations with 500 or more employees had access to EAPs. On the other hand, those at smaller organizations with a maximum of 99 employees had less access to EAPs.
Common Services Offered by EAPs
EAPs offer a wide variety of services, with some taking a holistic approach that encompasses all of these services. When analyzing EAP utilization rates, it’s crucial to evaluate the rate of use for each service to understand employee needs better and ensure cost-effectiveness.
The following are some standard EAP services that will be the focus of this study on utilization rates.
Confidential Counseling
Counseling is at the heart of most EAPs. Through this service, employees can access licensed professional counselors on a short-term basis to address immediate personal and professional issues. EAPs may adopt one or more counseling models.
In many cases, EAPs provide organizations with trained and certified specialists to help employees who are dealing with issues related to substance abuse. Through behavioral therapy, confidential counseling, and ongoing support, EAPs enhance the recovery process for such employees.
Organizational-Level Services
This service encompasses several work-based support systems, including workplace consulting and managerial training, designed to foster a more positive work environment overall.
Work/Life Services
EAPs have offered work/life services since the 1990s — data shows that at least two-thirds of EAPs incorporate this service offering in addition to counseling. With this service, employees can access expert guidance from nonclinical specialists to address common work/life issues, including child care, financial stressors, caring for aging parents, and achieving a work/life balance.
In the AllOne Health report published in 2025, 171 EAPs provided data on the types of services they offered organizations, including work/life services. The following are subtypes of work/life services and the percentage of the EAPs analyzed that offer them:
- Finance-related services: Many EAPs connect employees with financial advisors to address money-related issues and concerns, with 64% of the EAPs analyzed by AllOne Health providing employees with assistance addressing financial-related challenges. However, 66% of workers in another survey by Willis Towers Watson in 2024 stated that they wanted more employer-provided support for their financial health. EAP financial support may include assisting an employee in setting up a budget when filing for bankruptcy.
- Legal referrals: To help employees better manage their legal issues, some EAPs provide support sessions and legal referrals — 58% of EAPs in the earlier highlighted study offered support for legal matters.
- Medical advocacy: This service provides support for employees navigating health issues, while helping them assess their medical options and make informed decisions. An example of an EAP medical advocacy service is assisting an employee with a medical insurance claim.
- Eldercare: Several EAPs incorporate eldercare services into their offerings. With this service, employees can receive support in managing their caregiving responsibilities for aging parents. Examples include connecting employees with eldercare specialists for consultation on in-home care resources.
- Child care: By offering child care support services, EAPs help employees with children find a balance between work and their parental responsibilities. Sixty-one percent of EAPs in the AllOne Health study offered support for child care, eldercare, and housing. This service addresses the issue of limited access to employer-provided child care benefits, which only 13% of all workers had access to in 2024, according to the Bureau of Labor Statistics. An example of this service in practice would be helping an employee seeking homeschool alternatives for her child.
The Significance of EAP Utilization Rates
EAP utilization rates are more than just metrics organizations track. They provide insight into several key factors related to employee welfare, deployment strategy, and organizational growth. These factors include:
- Employee well-being: High EAP utilization rates indicate that employees are seeking the support necessary to enhance productivity, reduce burnout and absenteeism, and improve mental health.
- Return on investment: EAP utilization rates are crucial for evaluating an organization’s return on investment — low utilization rates indicate wasted investment, while high rates indicate funds well spent.
- Strategy assessment: By evaluating EAP utilization rates, organizations can review their internal structures and implement more effective strategies to promote utilization.
Key Trends and Utilization Rates of EAP Services
Below is a breakdown of the AllOne Health study’s findings, highlighting key trends and utilization rates of EAP services across various industries.
Distribution of Work/Life Service Requests by Time Period
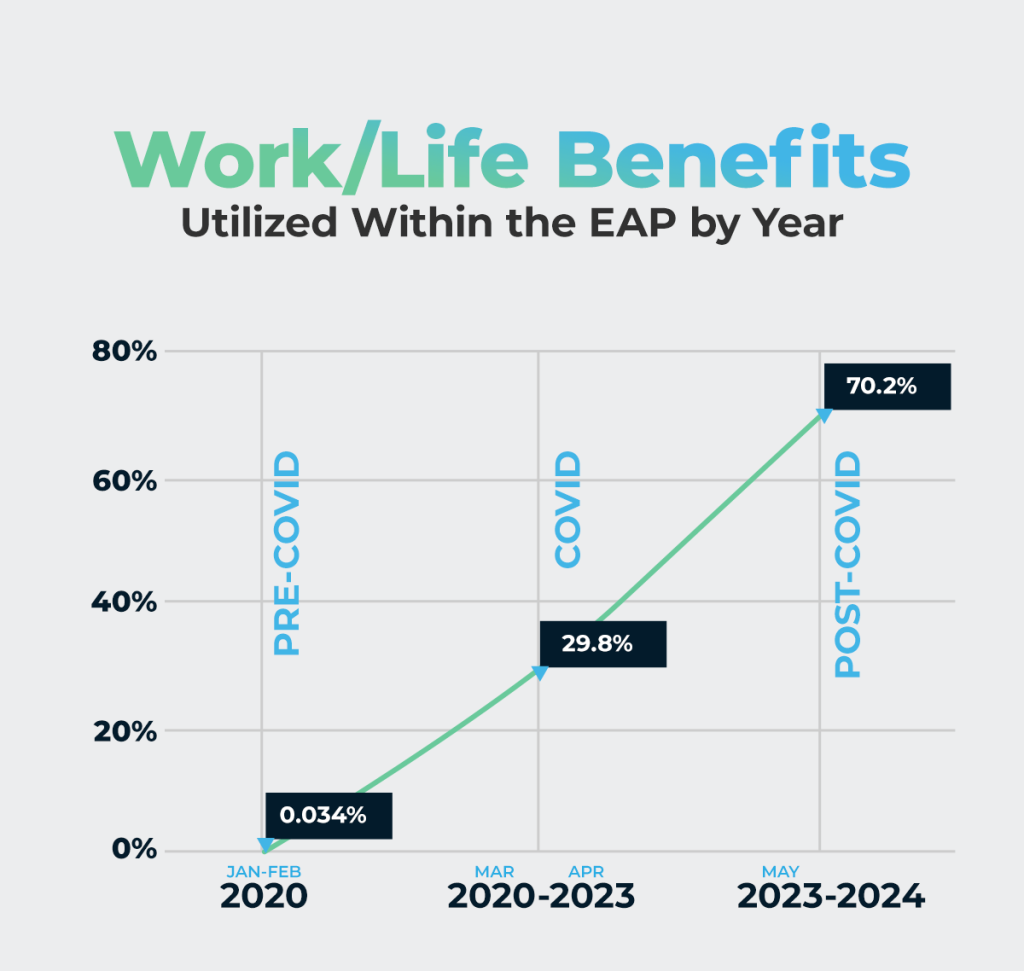
This analysis examined the distribution of work/life service requests across three time periods — pre-pandemic, during the COVID-19 pandemic, and post-pandemic — as part of the five-year period of work-life cases reviewed in this study. Overall, the distribution of work-life requests over time reflects the length of each period analyzed rather than a substantive change in employee demand for work/life services during or after the pandemic.
Pre-COVID period: A negligible share of total work-life requests occurred during this brief pre-pandemic window.
COVID-19 period (March 2020-April 2023): Approximately 29.8% of total work-life requests analyzed during the five-year study were submitted during the pandemic period (17,619 total requests).
Post-COVID period: Approximately 70.2% of total work-life requests analyzed occurred after the pandemic period.
Top Requested Work/Life Services
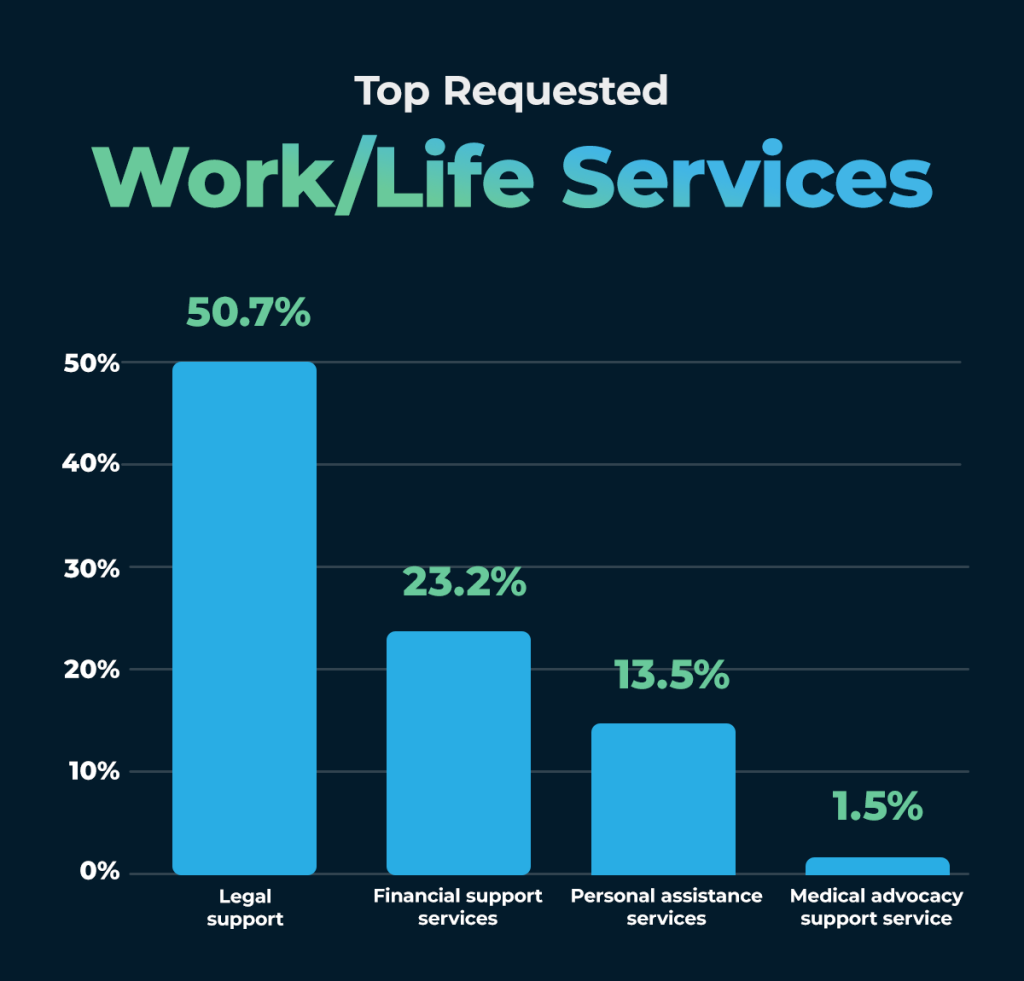
Below are the most-requested work/life benefits within the EAP over the five-year study of 59,137 cases:
- Legal support: 50.7% of employees analyzed in the study requested this service for both personal and family legal issues.
- Financial support services: 23.2% of all employees, or approximately 1 in every 4 users, requested financial support services to address personal or family finance-related issues.
- Personal assistance services: 13.5% of requests were placed for personal assistance services, which cover issues related to general life assistance support, with requests for child care support at 4.2% and eldercare at 2.9%.
- Medical advocacy support service: Four percent of the analyzed employees placed requests for the medical advocacy support services, while 1.5% requested the wellness and health promotion services.
Service Usage According to Employer Industry
To gain a well-balanced insight into work/life benefit requests within EAP utilization across different industries, the study included 28% of employees from education, 25% from health care, 17% from government, 9% from manufacturing, 4% from service/retail, 3% from financial, 2% from transportation, and 12% from other sectors. A sufficient number of employees represented each industry group to draw notable and reliable conclusions.
An analysis was conducted to compare each industry represented in terms of EAP utilization, taking into account client age and employer size. The following results showcase service usage according to employer industry:
Legal Support
Legal concerns represent the largest category of work-life requests across several industries. Transportation stands out in particular, with legal referrals accounting for 66% of all work-life requests within that sector, the highest share of any industry analyzed.
The following breakout shows the percentage of legal requests as a share of total work-life requests by industry, ranked from highest to lowest:
- Financial: 59%
- Government: 58%
- “Other”: 53%
- Manufacturing: 53%
- Health care: 48%
- Education: 46%
- Service/retail: 42%
Financial Support
Requests for financial consultations show meaningful variation by industry, reflecting differences in workforce demographics, compensation structures, and financial stressors.
The following breakout shows the percentage of financial consultation requests out of total work-life requests by industry, ranked from highest to lowest:
- Education: 25.8%
- Health care: 25.6%
- Transportation: 24.4%
- “Other”: 21.6%
- Government: 20.7%
- Manufacturing: 19.3%
- Service/retail: 18.4%
- Financial/business: 16.7%
Child Care
Child care support requests represent a smaller but important portion of total work-life volume and vary notably by industry and workforce composition.
The following percentages reflect child care requests as a share of each industry’s total work-life requests:
- Financial/business: 6.6%
- Service/retail: 6.6%
- Health care: 5.8%
- “Other”: 4.6%
- Government: 4.5%
- Manufacturing: 4.1%
- Education: 2.3%
- Transportation: 1.1%
Eldercare
Eldercare requests tend to increase in industries with older workforces or higher caregiving responsibilities outside of work.
The following industries showed the highest rates of eldercare support requests as a percentage of total work-life requests:
- Service/retail: 5.8%
- Financial/business: 4.4%
- Manufacturing: 3.1%
- “Other”: 3.1%
- Health care: 3%
- Education: 2.4%
- Government: 2.2%
- Transportation: 0.5%
Medical Advocacy
Medical advocacy requests reflect employees’ need for support in navigating health care systems, insurance, and treatment options.
The following industries submitted medical advocacy requests at the rates shown, measured as a percentage of total work-life requests:
- Manufacturing: 7.7%
- Service/retail: 4.4%
- “Other”: 4.3%
- Education: 3.7%
- Financial/business: 3.7%
- Government: 3.6%
- Health: 3.5%
- Transportation: 3%
How Does EAP Work/Life Service Usage Vary by Employer Size?
Another crucial metric the study focused on was the variation in work/life service usage by employer size. The average number of employees analyzed who had access to work/life services was 24,000, with the median declining to roughly 3,000 employees — the workforce size in question varied widely, from 1 to over 2.8 million employees.
The following numbers represent the work/life service usage categorized by organization size:
- 1-250: 11.6% of employees used the service.
- 251-500: 7.4% of employees used the service.
- 501-1,000: 10.6% of employees used the service.
- 1,001-2,500: 16.2% of employees used the service.
- 2,501-5,000: 15.2 % of employees used the service.
- 5,001-10,000: 10% of employees used the service.
- 10,001-20,000: 10.4% of employees used the service.
- 20,001 or more: 18.7% of employees used the service.
Assessing Work/Life Service Usage by Age
The age range of the analyzed employees was between 20 and 70 years — the average age of EAP work/life service users is 43 years. Most people who used the work/life service fell in the age groups of 30s, 40s, and 50s. This broad age span made it possible to assess the interaction between age and variables such as service use. The following examines the correlation results, highlighting the connection between age and work/life benefit utilization rates within the EAP.
Child Care Support
The results showed that younger age groups are most likely to use EAP child care support, with an 8% utilization rate recorded among employees 40 years and younger. The high utilization by this age group is most likely because childbirth rates are higher among them. Understandably, the usage rate declined as the ages increased — only 1% of requests for child care support were made by employees above 60.
Financial Support
Similar to child care, younger employees are more likely to use EAP financial support than employees in older age groups. According to the findings, 31% of work/life requests for financial-related concerns were made by employees under the age of 30, while employees aged 50 and older used it less frequently. Clients aged 60 and older only made up 18% of the total financial requests within work/life cases in the EAP. This outcome is expected, given that financial resources are typically limited at younger ages.
Eldercare Support
Older groups use EAP eldercare support the most, with employees aged 50 and older comprising 6% of total work/life requests for eldercare support. Although younger age groups also used this service, only 1% of eldercare requests were submitted by employees aged 30 and younger. This decreased usage is most likely because their parents are typically younger than those of older employees, who would require care as a result.
Legal Support
While the usage rate was high for legal support services among employees 40 years and younger, it was much higher among employees 60 years and older. The results were in this order: 30s (46%), 40s (46%), 50s (61%), and 60s (62%). High usage by older employees may be a result of more legal contracts and agreements requiring legal referrals, compared to those who are younger.
Discover How to Increase EAP Utilization
Understanding how employees engage with work/life services is essential for maximizing the value of an EAP and addressing the real-world challenges employees face. This research highlights clear patterns in service demand across industries, organization sizes, and time periods — insights that can help employers better align EAP offerings with workforce needs.
Increasing the effectiveness of an EAP requires more than availability alone. Ongoing evaluation of service usage, targeted communication, and a continued focus on awareness, confidentiality, and trust all play a critical role in ensuring employees feel comfortable accessing support when they need it most.
This story was produced by AllOne Health and reviewed and distributed by Stacker.


