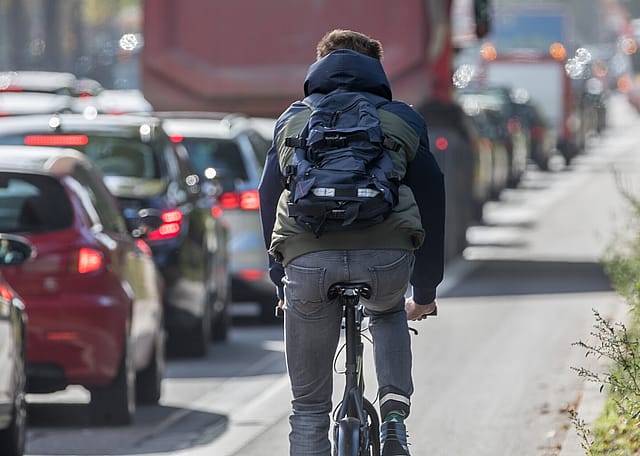
Stacker compiled a list of the counties with the best commutes in Texas using data from the U.S. Census Bureau. Counties are ranked by the shortest average travel time to work, with ties broken by lowest percent of residents that commute over 60 minutes, and any further ties broken by lowest percent of residents that work outside the county of residence.
You may also like: Hottest Januarys in Texas since 1895
Larry D. Moore // Wikimedia Commons
1 / 50#50. Haskell County
- Mean travel time to work: 18.2
- Workers with 60+ minute commute: 7.3%
- Worked outside of county of residence: 30.5%
Renelibrary // Wikimedia Commons
2 / 50#49. Young County
- Mean travel time to work: 18.2
- Workers with 60+ minute commute: 7.1%
- Worked outside of county of residence: 10.3%
#48. Hale County
- Mean travel time to work: 18.2
- Workers with 60+ minute commute: 5.9%
- Worked outside of county of residence: 23.0%
Billy Hathorn // Wikimedia Commons
4 / 50#47. Scurry County
- Mean travel time to work: 18.1
- Workers with 60+ minute commute: 5.4%
- Worked outside of county of residence: 11.1%
25or6to4 // Wikimedia Commons
5 / 50John Stanton // Wikimedia Commons
6 / 50#45. Val Verde County
- Mean travel time to work: 17.9
- Workers with 60+ minute commute: 4.3%
- Worked outside of county of residence: 8.9%
Jeffrey Beall // Wikimedia Commons
7 / 50#44. Gray County
- Mean travel time to work: 17.8
- Workers with 60+ minute commute: 6.3%
- Worked outside of county of residence: 14.7%
Larry D. Moore // Wikimedia Commons
8 / 50#43. Uvalde County
- Mean travel time to work: 17.8
- Workers with 60+ minute commute: 5.7%
- Worked outside of county of residence: 9.6%
Robert Blaine Camp // Wikimedia Commons
9 / 50#42. Moore County
- Mean travel time to work: 17.8
- Workers with 60+ minute commute: 3.9%
- Worked outside of county of residence: 13.6%
Mark Oxner // Wikimedia Commons
10 / 50Larry D. Moore // Wikimedia Commons
11 / 50#40. Martin County
- Mean travel time to work: 17.7
- Workers with 60+ minute commute: 1.4%
- Worked outside of county of residence: 43.1%
Aualliso // Wikimedia Commons
12 / 50#39. Irion County
- Mean travel time to work: 17.5
- Workers with 60+ minute commute: 1.8%
- Worked outside of county of residence: 36.9%
Larry D. Moore // Wikimedia Commons
13 / 50#38. Brazos County
- Mean travel time to work: 17.4
- Workers with 60+ minute commute: 2.8%
- Worked outside of county of residence: 6.9%
Nicolas Henderson // Wikimedia Commons
14 / 50#37. Knox County
- Mean travel time to work: 17.3
- Workers with 60+ minute commute: 9.6%
- Worked outside of county of residence: 24.5%
Aualliso // Wikimedia Commons
15 / 50Aualliso // Wikimedia Commons
16 / 50#35. Throckmorton County
- Mean travel time to work: 17.3
- Workers with 60+ minute commute: 5.6%
- Worked outside of county of residence: 31.5%
Renelibrary // Wikimedia Commons
17 / 50#34. Brown County
- Mean travel time to work: 17.2
- Workers with 60+ minute commute: 3.5%
- Worked outside of county of residence: 7.7%
Larry D. Moore // Wikimedia Commons
18 / 50#33. Calhoun County
- Mean travel time to work: 17.2
- Workers with 60+ minute commute: 2.2%
- Worked outside of county of residence: 17.0%
Aualliso // Wikimedia Commons
19 / 50#32. Cottle County
- Mean travel time to work: 17.1
- Workers with 60+ minute commute: 3.4%
- Worked outside of county of residence: 20.3%
Renelibrary // Wikimedia Commons
20 / 50Larry D. Moore // Wikimedia Commons
21 / 50#30. Nolan County
- Mean travel time to work: 16.9
- Workers with 60+ minute commute: 4.3%
- Worked outside of county of residence: 14.6%
Larry D. Moore // Wikimedia Commons
22 / 50#29. Taylor County
- Mean travel time to work: 16.9
- Workers with 60+ minute commute: 3.7%
- Worked outside of county of residence: 6.6%
Elred // Wikimedia Commons
23 / 50#28. Lubbock County
- Mean travel time to work: 16.8
- Workers with 60+ minute commute: 3.2%
- Worked outside of county of residence: 4.9%
Larry D. Moore // Wikimedia Commons
24 / 50#27. McCulloch County
- Mean travel time to work: 16.6
- Workers with 60+ minute commute: 3.6%
- Worked outside of county of residence: 11.7%
Larry D. Moore // Wikimedia Commons
25 / 50Aualliso // Wikimedia Commons
26 / 50#25. Hemphill County
- Mean travel time to work: 16.5
- Workers with 60+ minute commute: 6.8%
- Worked outside of county of residence: 19.1%
Larry D. Moore // Wikimedia Commons
27 / 50#24. Menard County
- Mean travel time to work: 16.5
- Workers with 60+ minute commute: 4.4%
- Worked outside of county of residence: 21.2%
Billy Hathorn // Wikimedia Commons
28 / 50#23. Deaf Smith County
- Mean travel time to work: 16.5
- Workers with 60+ minute commute: 3.9%
- Worked outside of county of residence: 15.3%
#22. Pecos County
- Mean travel time to work: 15.9
- Workers with 60+ minute commute: 8.5%
- Worked outside of county of residence: 15.9%
Larry D. Moore // Wikimedia Commons
30 / 50Aualliso // Wikimedia Commons
31 / 50#20. Jeff Davis County
- Mean travel time to work: 15.7
- Workers with 60+ minute commute: 0.4%
- Worked outside of county of residence: 13.7%
Larry D. Moore // Wikimedia Commons
32 / 50#19. Real County
- Mean travel time to work: 15.6
- Workers with 60+ minute commute: 2.0%
- Worked outside of county of residence: 20.9%
Liveon001 // Wikimedia Commons
33 / 50#18. Hall County
- Mean travel time to work: 15.5
- Workers with 60+ minute commute: 5.3%
- Worked outside of county of residence: 23.2%
#17. Collingsworth County
- Mean travel time to work: 15.4
- Workers with 60+ minute commute: 1.0%
- Worked outside of county of residence: 23.4%
Travis K. Witt // Wikimedia Commons
35 / 50Aualliso // Wikimedia Commons
36 / 50#15. Ochiltree County
- Mean travel time to work: 15.2
- Workers with 60+ minute commute: 4.6%
- Worked outside of county of residence: 4.7%
Austin Lamar Allison // Wikimedia Commons
37 / 50#14. Roberts County
- Mean travel time to work: 15.0
- Workers with 60+ minute commute: 1.3%
- Worked outside of county of residence: 55.4%
Larry D. Moore // Wikimedia Commons
38 / 50#13. Wilbarger County
- Mean travel time to work: 14.9
- Workers with 60+ minute commute: 4.7%
- Worked outside of county of residence: 11.1%
Billy Hathorn // Wikimedia Commons
39 / 50#12. Castro County
- Mean travel time to work: 14.9
- Workers with 60+ minute commute: 4.4%
- Worked outside of county of residence: 26.8%
Billy Hathorn // Wikimedia Commons
40 / 50Patriarca12 // Wikimedia Commons
41 / 50#10. Brewster County
- Mean travel time to work: 14.6
- Workers with 60+ minute commute: 4.3%
- Worked outside of county of residence: 13.6%
Aualliso // Wikimedia Commons
42 / 50#9. Dallam County
- Mean travel time to work: 14.2
- Workers with 60+ minute commute: 2.3%
- Worked outside of county of residence: 25.8%
Aualliso // Wikimedia Commons
43 / 50#8. Stonewall County
- Mean travel time to work: 14.1
- Workers with 60+ minute commute: 5.6%
- Worked outside of county of residence: 23.0%
Aualliso // Wikimedia Commons
44 / 50#7. Hartley County
- Mean travel time to work: 14.0
- Workers with 60+ minute commute: 3.2%
- Worked outside of county of residence: 55.3%
Josh Berglund from Richardson, United States // Wikimedia Commons
45 / 50#6. Hardeman County
- Mean travel time to work: 13.9
- Workers with 60+ minute commute: 1.1%
- Worked outside of county of residence: 25.1%
You may also like: Highest-rated IPAs in Texas
#5. Baylor County
- Mean travel time to work: 13.6
- Workers with 60+ minute commute: 2.9%
- Worked outside of county of residence: 16.1%
Aualliso // Wikimedia Commons
47 / 50#4. Kent County
- Mean travel time to work: 13.4
- Workers with 60+ minute commute: 6.6%
- Worked outside of county of residence: 27.5%
Aualliso // Wikimedia Commons
48 / 50#3. King County
- Mean travel time to work: 13.3
- Workers with 60+ minute commute: 5.4%
- Worked outside of county of residence: 13.3%
#2. Brooks County
- Mean travel time to work: 13.2
- Workers with 60+ minute commute: 2.6%
- Worked outside of county of residence: 46.8%
Aualliso // Wikimedia Commons
50 / 50